| Param | Original file | Final file |
|---|---|---|
| Filename | modeM0/AS1A10_049T01_9000004032_27934cztM0_level2.evt | modeM0/AS1A10_049T01_9000004032_27934cztM0_level2_quad_clean.evt |
| Size (bytes) | 561,913,920 | 78,396,480 |
| Size | 535.9 MB | 74.8 MB |
| Events in quadrant A | 3,142,369 | 510,534 |
| Events in quadrant B | 3,695,942 | 505,554 |
| Events in quadrant C | 4,554,671 | 468,012 |
| Events in quadrant D | 5,213,307 | 465,254 |
| Mode M9 | |||
|---|---|---|---|
| Quadrant | BADHDUFLAG | Total packets | Discarded packets |
| A | 0 | 12 | 0 |
| B | 0 | 12 | 0 |
| C | 0 | 12 | 0 |
| D | 0 | 12 | 0 |
| Mode M0 | |||
|---|---|---|---|
| Quadrant | BADHDUFLAG | Total packets | Discarded packets |
| A | 0 | 13194 | 0 |
| B | 0 | 14832 | 0 |
| C | 0 | 17544 | 0 |
| D | 0 | 19777 | 0 |
| Quadrant | Total seconds | Saturated seconds | Saturation percentage |
|---|---|---|---|
| A | 6075 | 55 | 0.905350% |
| B | 6076 | 198 | 3.258723% |
| C | 6076 | 414 | 6.813693% |
| D | 6076 | 363 | 5.974325% |
Noise dominated data is calculated using 1-second bins in cleaned event files. If a bin has >2000 counts, and if more than 50% of those come from <1% of pixels, then it is considered to be noise-dominated and hence unusable.
| Quadrant | # 1 sec bins | Bins with >0 counts | Bins with >2000 counts | High rate bins dominated by noise | Noise dominated (total time) | Noise dominated (detector-on time) | Marked lightcurve |
|---|---|---|---|---|---|---|---|
| A | 7255 | 6075 | 0 | 0 | 0.00% | 0.00% | 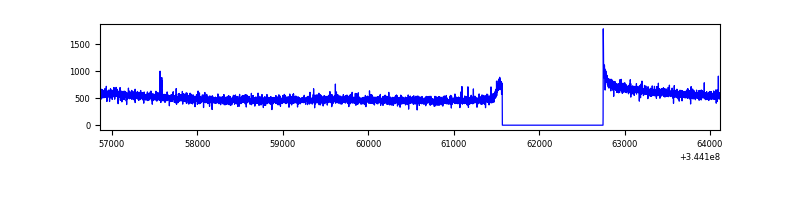 |
| B | 7256 | 6076 | 116 | 116 | 1.60% | 1.91% | 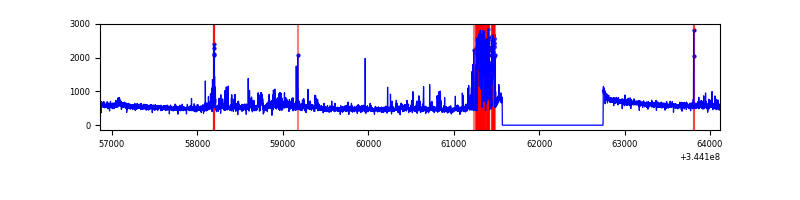 |
| C | 7256 | 6076 | 183 | 183 | 2.52% | 3.01% |  |
| D | 7256 | 6076 | 271 | 271 | 3.73% | 4.46% | 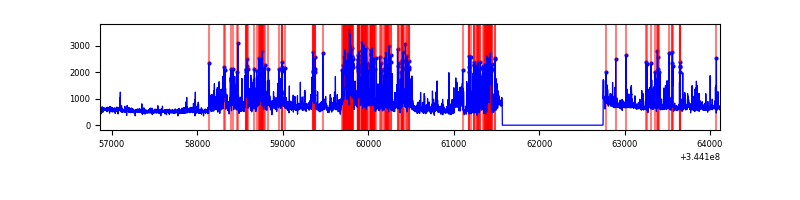 |
Top three noisy pixels from each quadrant. If the there are fewer than three noisy pixels in the level2.evt file, extra rows are filled as -1
| Pixel properties | Quadrant properties | ||||||
|---|---|---|---|---|---|---|---|
| Quadrant | DetID | PixID | Counts | Sigma | Mean | Median | Sigma |
| A | 13 | 254 | 10471 | 60.22 | 813 | 799 | 160.6 |
| A | 3 | 137 | 7235 | 40.07 | 813 | 799 | 160.6 |
| A | 0 | 226 | 6961 | 38.37 | 813 | 799 | 160.6 |
| B | 10 | 245 | 484775 | 3300.58 | 793 | 775 | 146.6 |
| B | 0 | 230 | 55332 | 372.05 | 793 | 775 | 146.6 |
| B | 0 | 190 | 19764 | 129.49 | 793 | 775 | 146.6 |
| C | 2 | 16 | 1295731 | 7372.59 | 760 | 767 | 175.6 |
| C | 3 | 233 | 165697 | 938.99 | 760 | 767 | 175.6 |
| C | 14 | 238 | 124739 | 705.81 | 760 | 767 | 175.6 |
| D | 1 | 52 | 1478970 | 8126.52 | 774 | 755 | 181.9 |
| D | 8 | 195 | 473695 | 2600.0 | 774 | 755 | 181.9 |
| D | 7 | 80 | 190319 | 1042.13 | 774 | 755 | 181.9 |
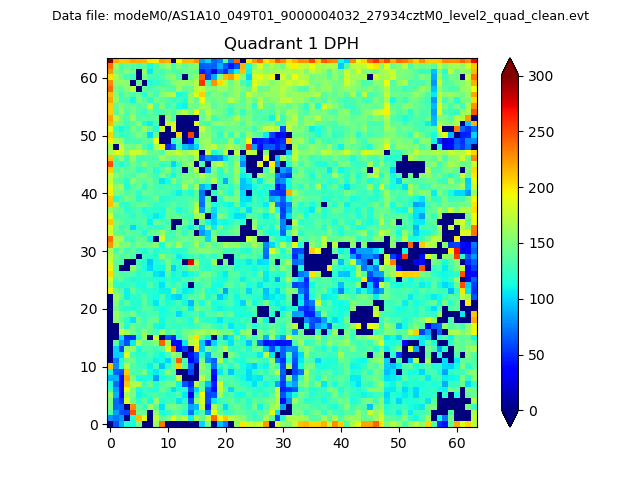
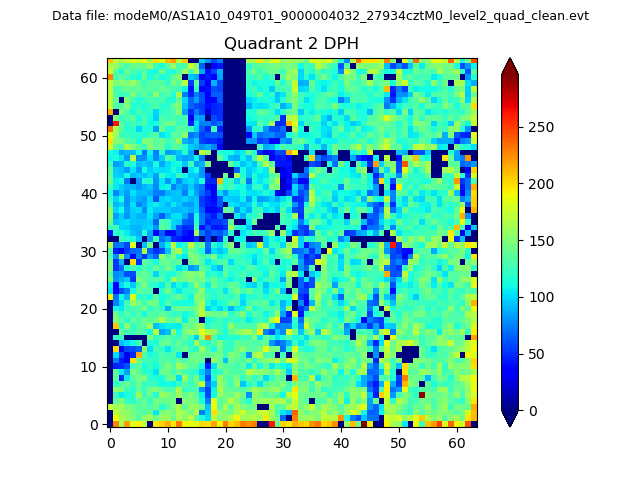
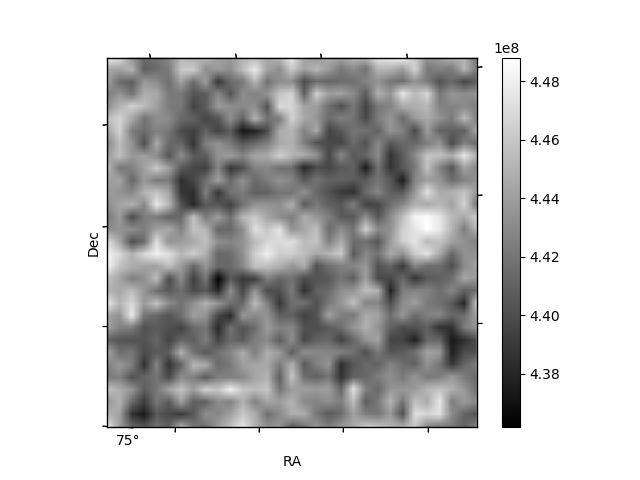
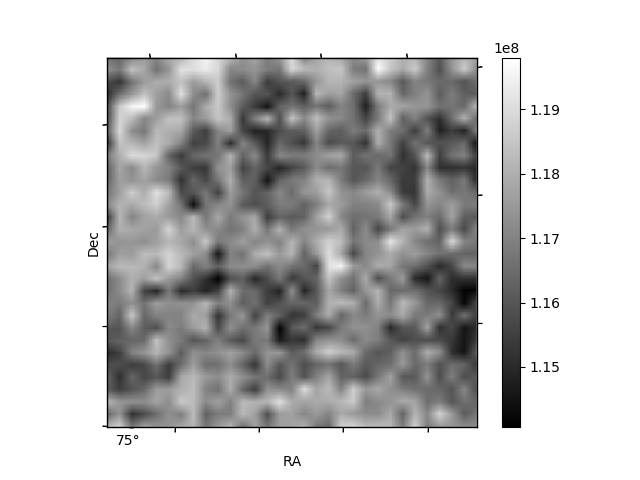
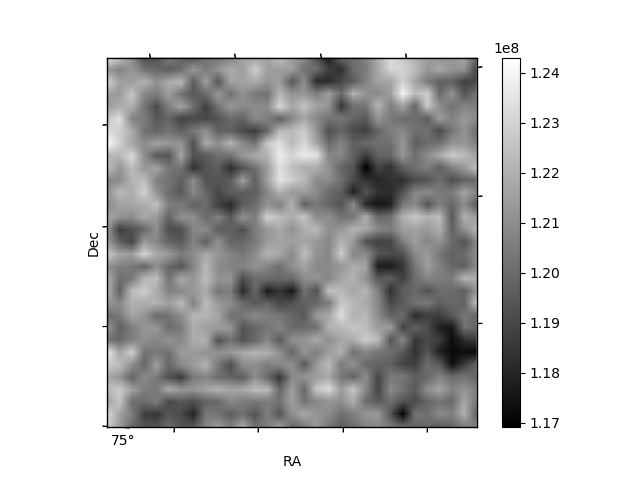
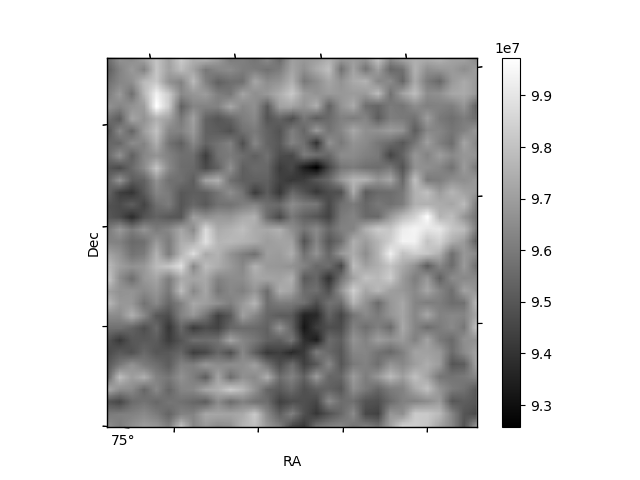
Histogram calculated using DETX and DETY for each event in the final _common_clean file
| Quadrant A | 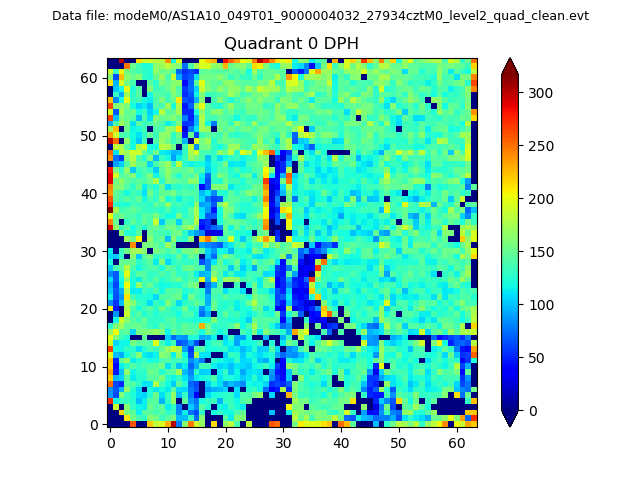 |
 |
Quadrant B |
|---|---|---|---|
| Quadrant D | 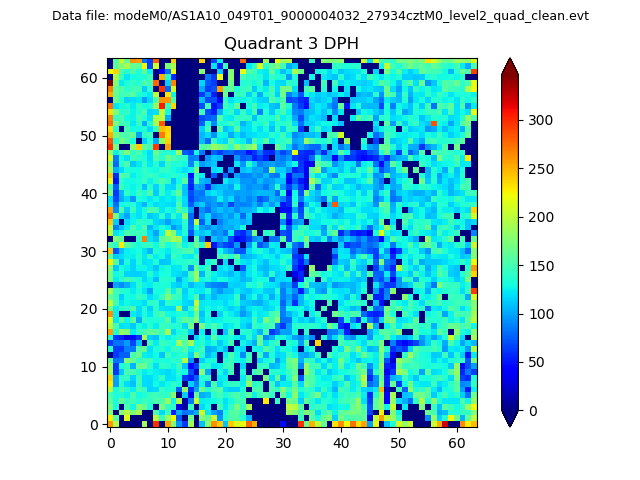 |
 |
Quadrant C |
| Plot type | Count rate plots | Images |
|---|---|---|
| Comparison with Poisson distribution Blue bars denote a histogram of data divided into 1 sec bins. Red curve is a Poisson curve with rate = median count rate of data. |
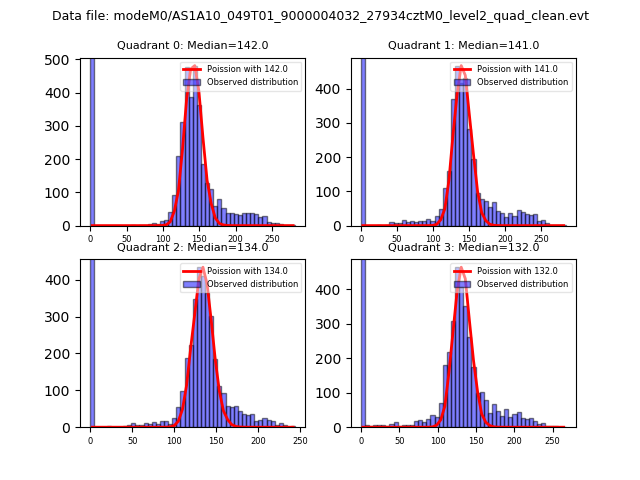 |
 |
| Quadrant-wise count rates Data is divided into 100 sec bins |
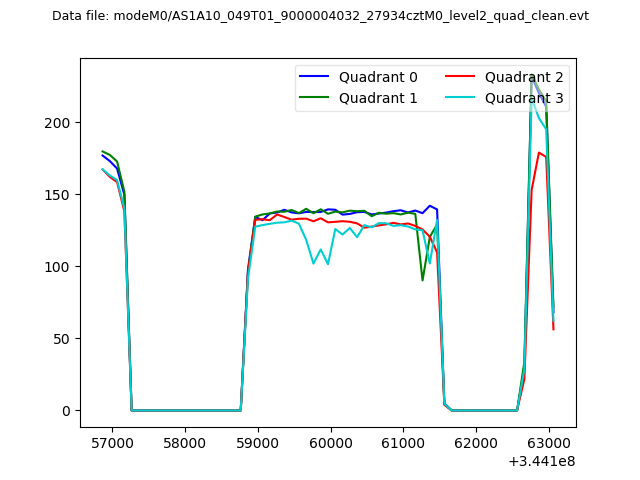 |
|
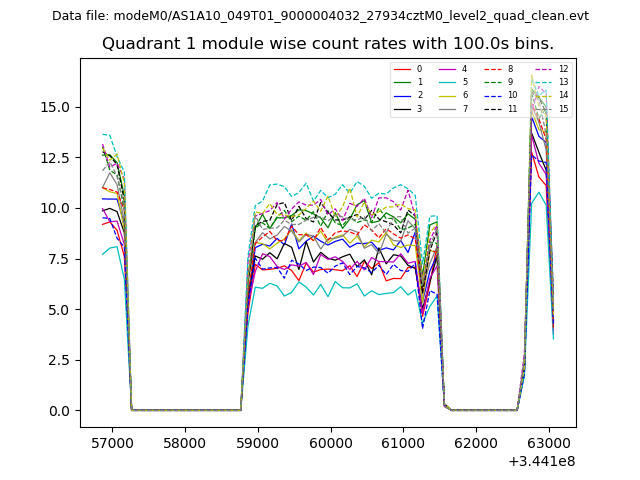
| Module-wise count rates for Quadrant A Data is divided into 100 sec bins |
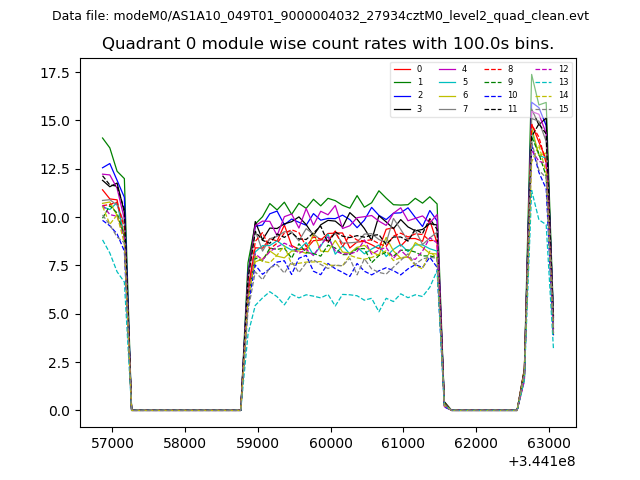 |
 |
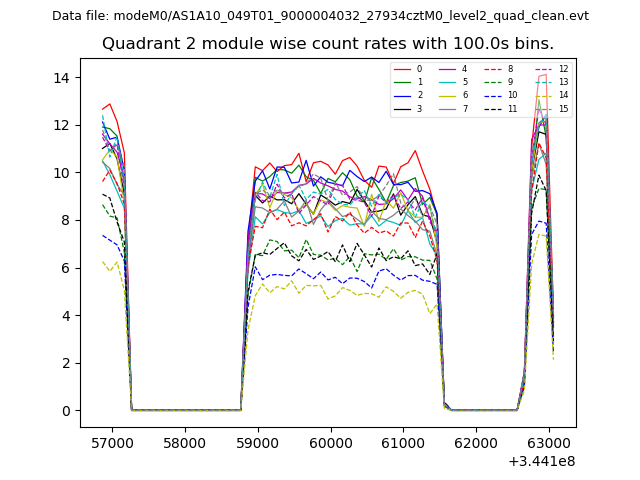
| Module-wise count rates for Quadrant B Data is divided into 100 sec bins |
 |
 |
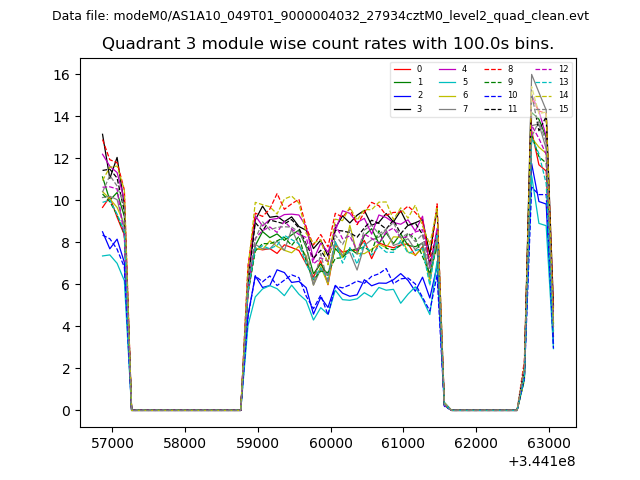
| Module-wise count rates for Quadrant C Data is divided into 100 sec bins |
 |
 |
| Module-wise count rates for Quadrant D Data is divided into 100 sec bins |
 |
 |
| Parameter | Plot |
|---|---|
| CZT HV Monitor | 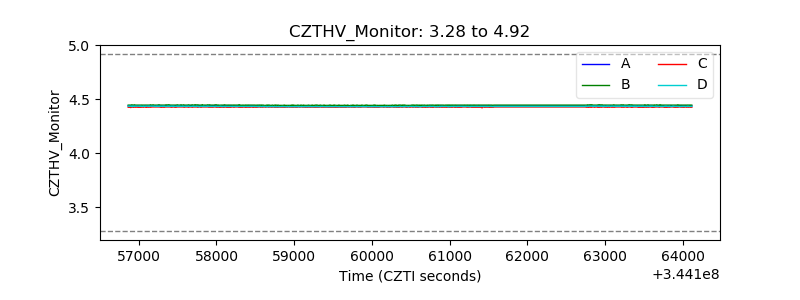 |
| D_VDD | 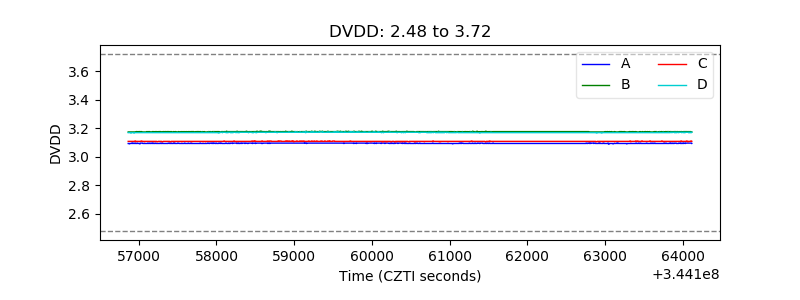 |
| Temperature 1 | 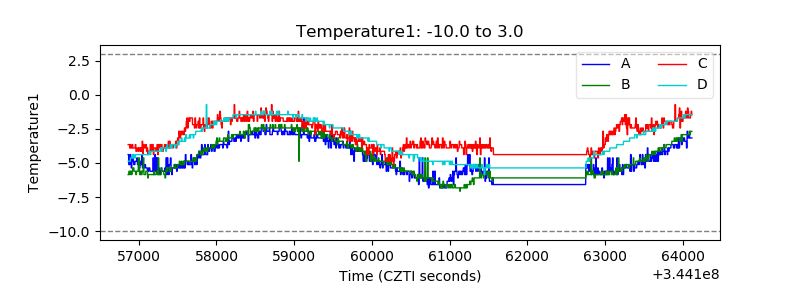 |
| Veto HV Monitor | 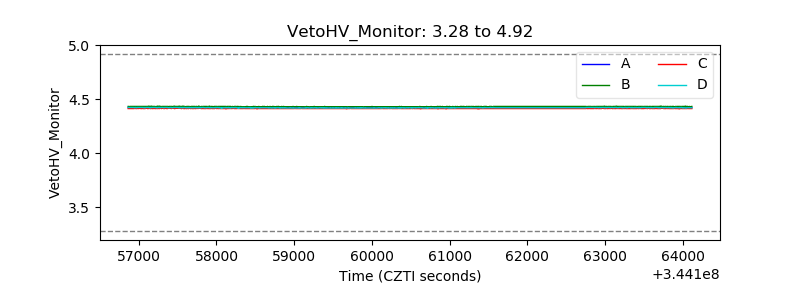 |
| Veto LLD | 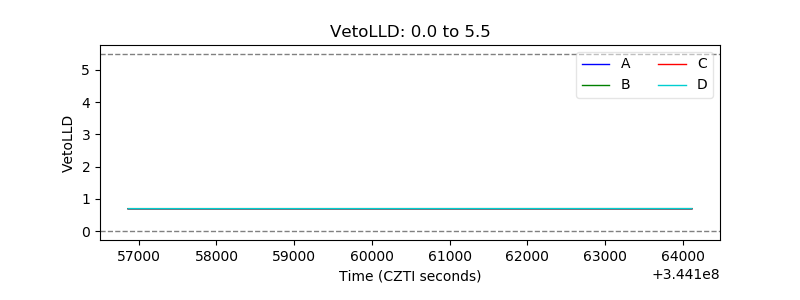 |
| Alpha Counter | 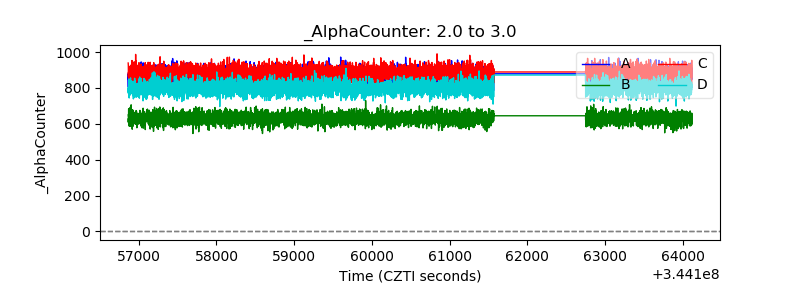 |
| _CPM_Rate | 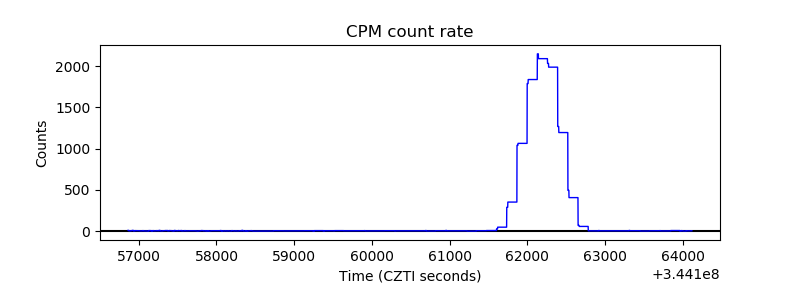 |
| CZT Counter | 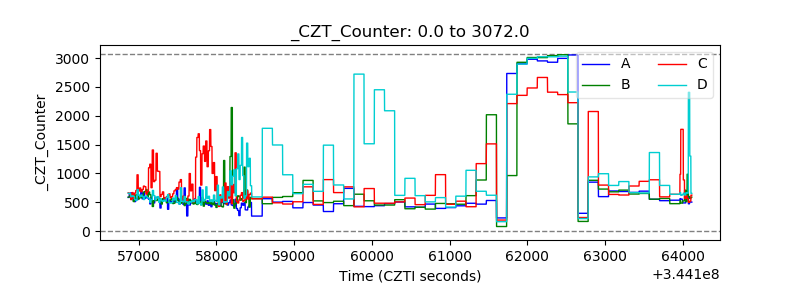 |
| +2.5 Volts monitor |  |
| +5 Volts monitor |  |
| _ROLL_ROT | 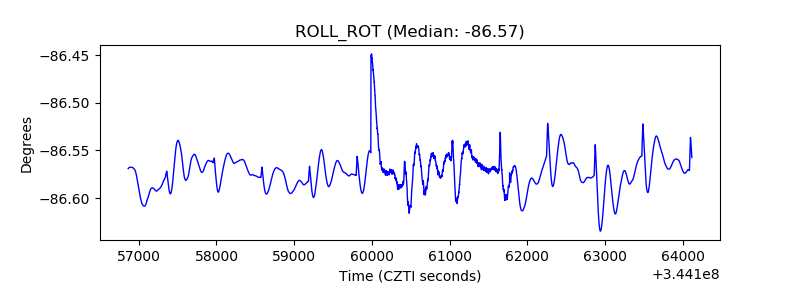 |
| _Roll_DEC | 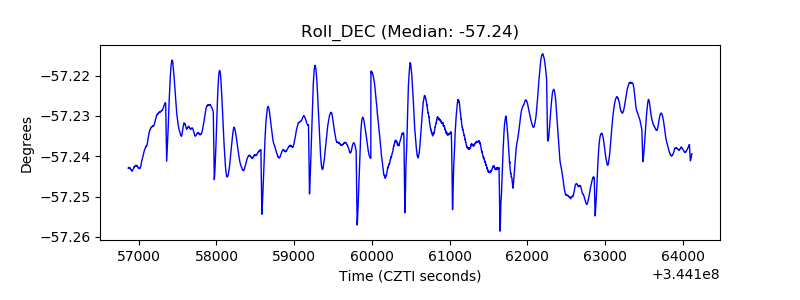 |
| _Roll_RA | 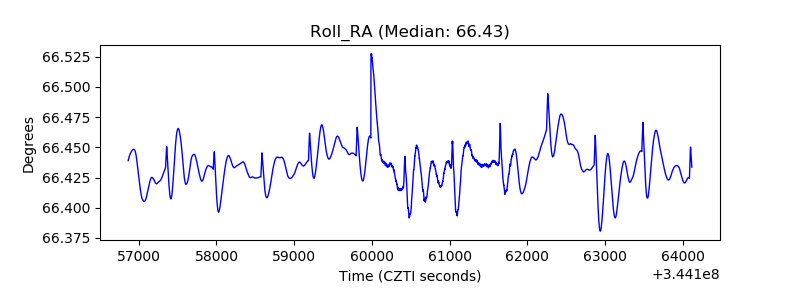 |
| Veto Counter | 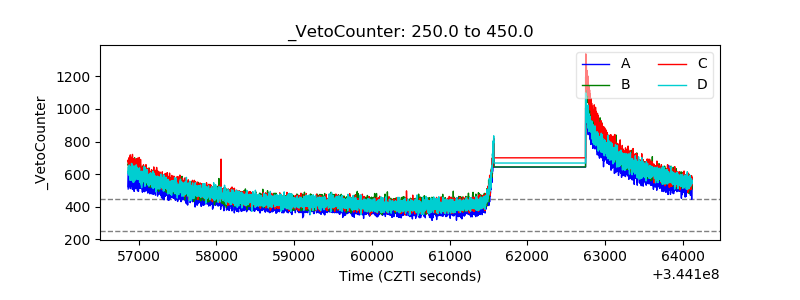 |