| Param | Original file | Final file |
|---|---|---|
| Filename | modeM0/AS1A10_049T01_9000004032_27936cztM0_level2.evt | modeM0/AS1A10_049T01_9000004032_27936cztM0_level2_quad_clean.evt |
| Size (bytes) | 381,479,040 | 64,872,000 |
| Size | 363.8 MB | 61.9 MB |
| Events in quadrant A | 2,373,632 | 432,412 |
| Events in quadrant B | 2,488,888 | 431,633 |
| Events in quadrant C | 2,533,089 | 405,638 |
| Events in quadrant D | 3,860,159 | 386,757 |
| Mode M9 | |||
|---|---|---|---|
| Quadrant | BADHDUFLAG | Total packets | Discarded packets |
| A | 0 | 3 | 0 |
| B | 0 | 4 | 0 |
| C | 0 | 4 | 0 |
| D | 0 | 4 | 0 |
| Mode M0 | |||
|---|---|---|---|
| Quadrant | BADHDUFLAG | Total packets | Discarded packets |
| A | 0 | 9775 | 0 |
| B | 0 | 10172 | 0 |
| C | 0 | 10399 | 0 |
| D | 0 | 14550 | 0 |
| Quadrant | Total seconds | Saturated seconds | Saturation percentage |
|---|---|---|---|
| A | 4374 | 13 | 0.297211% |
| B | 4374 | 14 | 0.320073% |
| C | 4374 | 69 | 1.577503% |
| D | 4374 | 388 | 8.870599% |
Noise dominated data is calculated using 1-second bins in cleaned event files. If a bin has >2000 counts, and if more than 50% of those come from <1% of pixels, then it is considered to be noise-dominated and hence unusable.
| Quadrant | # 1 sec bins | Bins with >0 counts | Bins with >2000 counts | High rate bins dominated by noise | Noise dominated (total time) | Noise dominated (detector-on time) | Marked lightcurve |
|---|---|---|---|---|---|---|---|
| A | 4374 | 4374 | 0 | 0 | 0.00% | 0.00% | 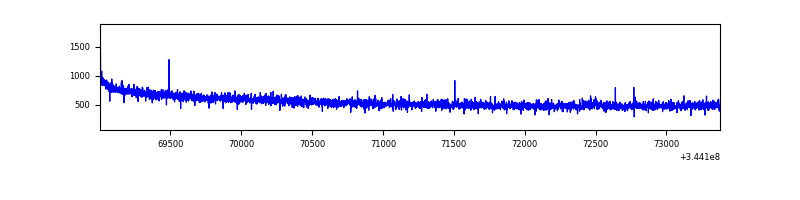 |
| B | 4374 | 4374 | 1 | 1 | 0.02% | 0.02% | 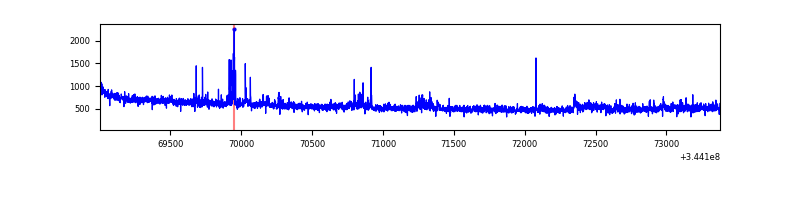 |
| C | 4374 | 4374 | 1 | 1 | 0.02% | 0.02% | 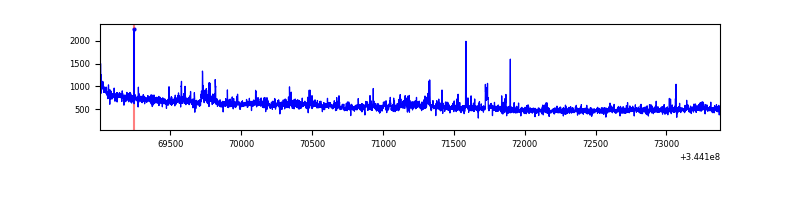 |
| D | 4374 | 4374 | 361 | 361 | 8.25% | 8.25% | 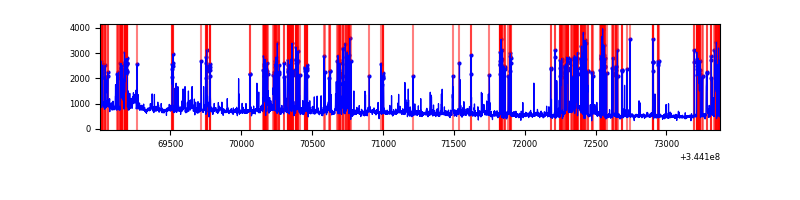 |
Top three noisy pixels from each quadrant. If the there are fewer than three noisy pixels in the level2.evt file, extra rows are filled as -1
| Pixel properties | Quadrant properties | ||||||
|---|---|---|---|---|---|---|---|
| Quadrant | DetID | PixID | Counts | Sigma | Mean | Median | Sigma |
| A | 13 | 254 | 7214 | 55.39 | 613 | 604 | 119.3 |
| A | 0 | 226 | 5372 | 39.96 | 613 | 604 | 119.3 |
| A | 3 | 137 | 5032 | 37.11 | 613 | 604 | 119.3 |
| B | 10 | 245 | 77399 | 696.75 | 603 | 590 | 110.2 |
| B | 0 | 183 | 25095 | 222.29 | 603 | 590 | 110.2 |
| B | 4 | 52 | 15190 | 132.44 | 603 | 590 | 110.2 |
| C | 3 | 233 | 154556 | 1180.54 | 575 | 583 | 130.4 |
| C | 14 | 238 | 97147 | 740.37 | 575 | 583 | 130.4 |
| C | 2 | 16 | 39718 | 300.06 | 575 | 583 | 130.4 |
| D | 1 | 52 | 1222197 | 9182.94 | 566 | 553 | 133.0 |
| D | 8 | 195 | 365265 | 2741.49 | 566 | 553 | 133.0 |
| D | 2 | 250 | 66722 | 497.38 | 566 | 553 | 133.0 |
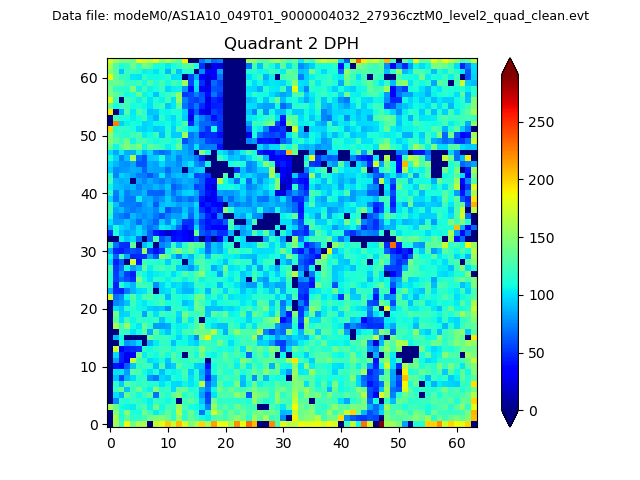
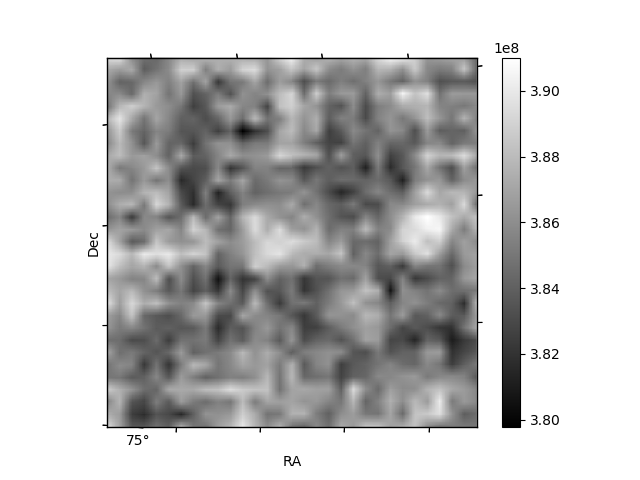
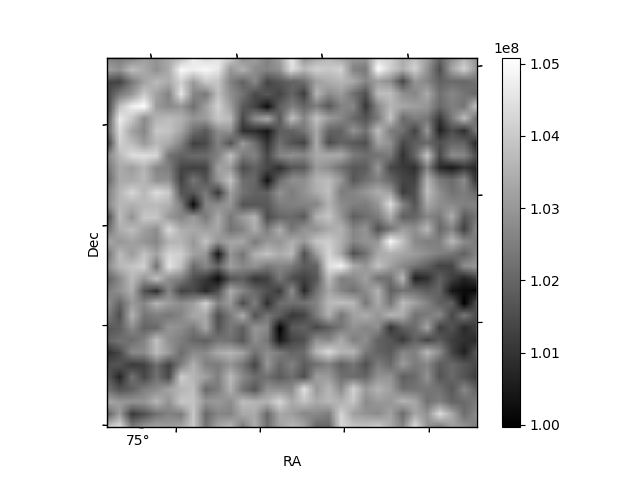
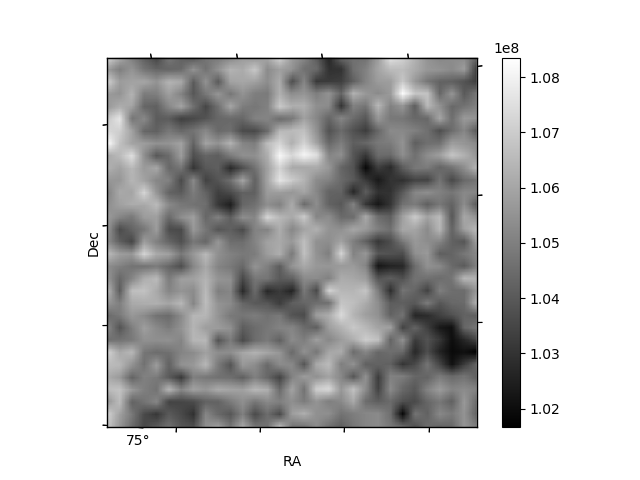
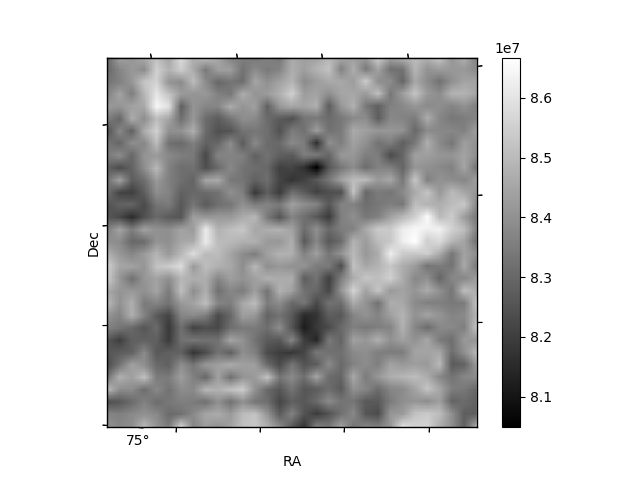
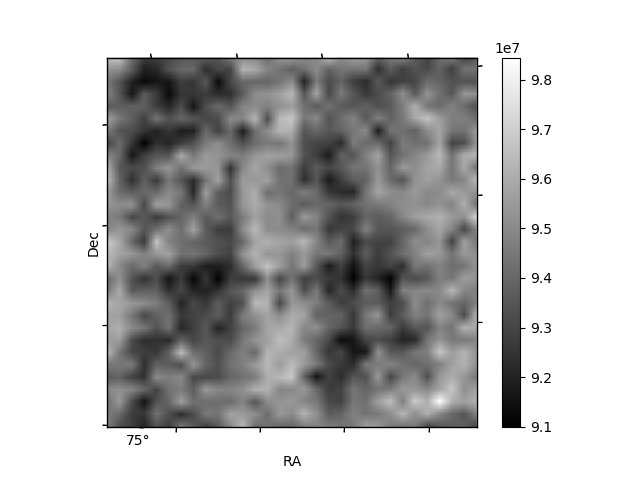
Histogram calculated using DETX and DETY for each event in the final _common_clean file
| Quadrant A | 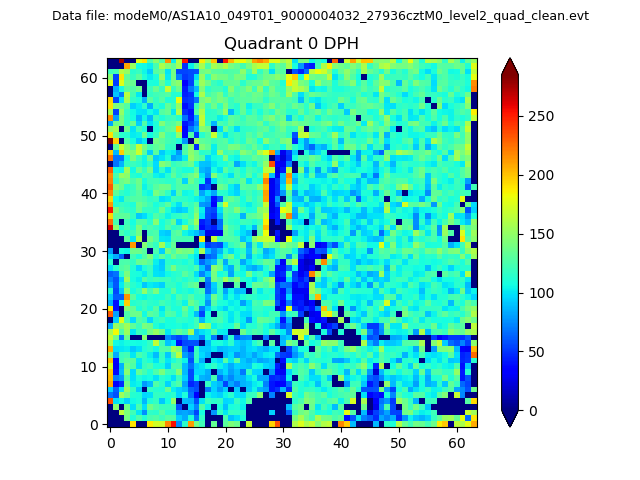 |
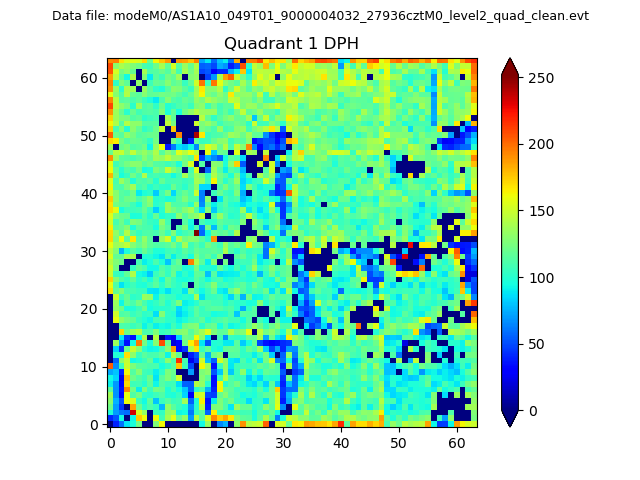 |
Quadrant B |
|---|---|---|---|
| Quadrant D | 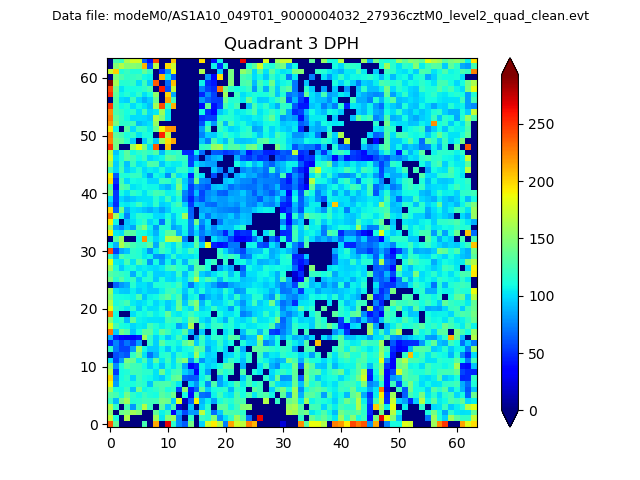 |
 |
Quadrant C |
| Plot type | Count rate plots | Images |
|---|---|---|
| Comparison with Poisson distribution Blue bars denote a histogram of data divided into 1 sec bins. Red curve is a Poisson curve with rate = median count rate of data. |
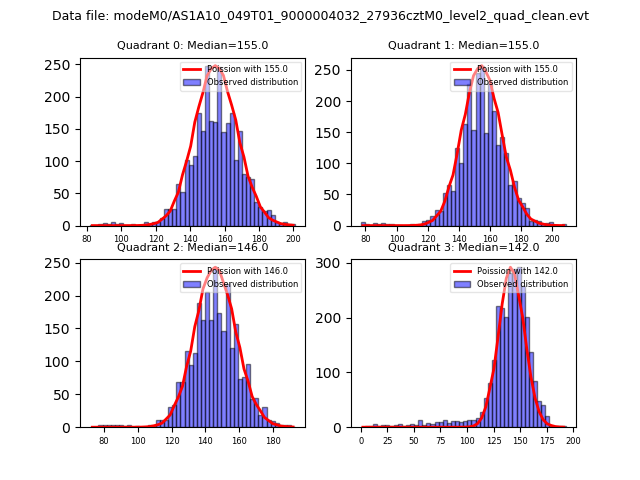 |
 |
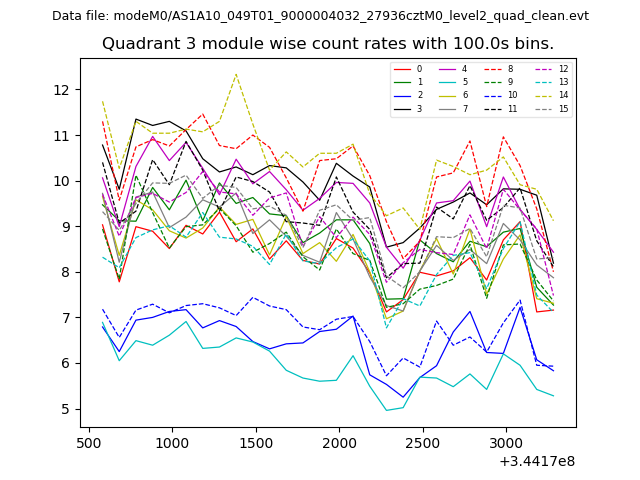
| Quadrant-wise count rates Data is divided into 100 sec bins |
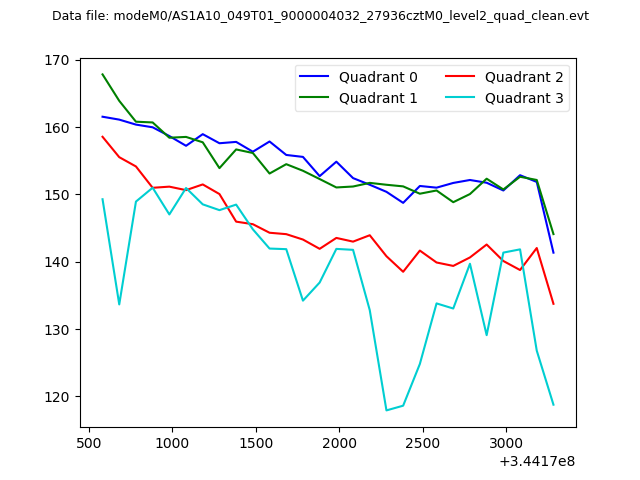 |
|
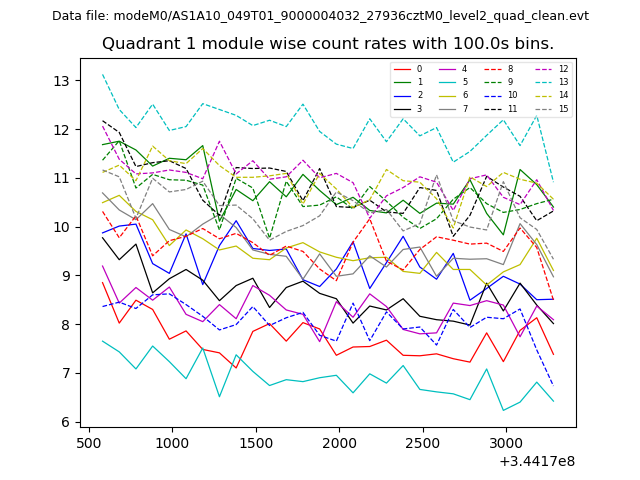
| Module-wise count rates for Quadrant A Data is divided into 100 sec bins |
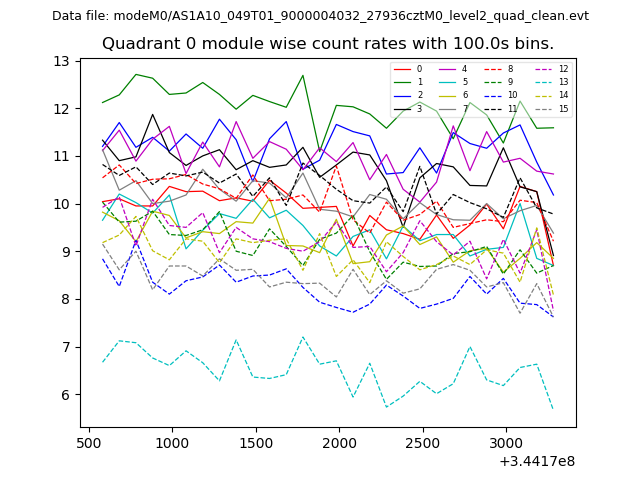 |
 |
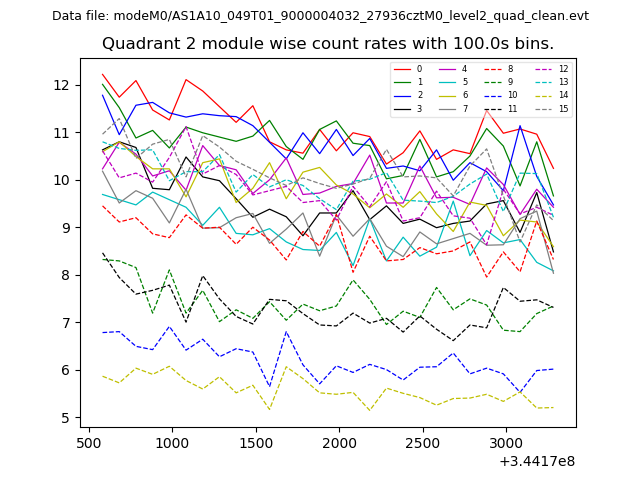
| Module-wise count rates for Quadrant B Data is divided into 100 sec bins |
 |
 |
| Module-wise count rates for Quadrant C Data is divided into 100 sec bins |
 |
 |
| Module-wise count rates for Quadrant D Data is divided into 100 sec bins |
 |
 |
| Parameter | Plot |
|---|---|
| CZT HV Monitor | 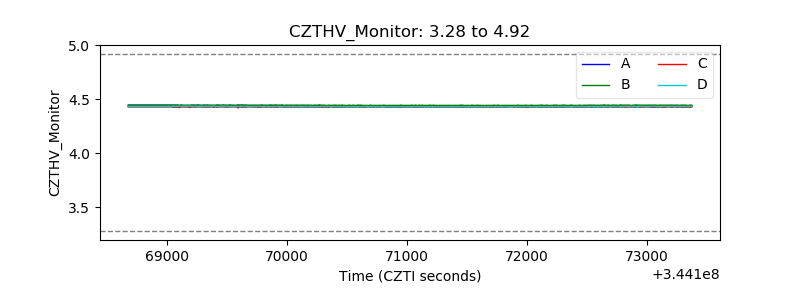 |
| D_VDD |  |
| Temperature 1 | 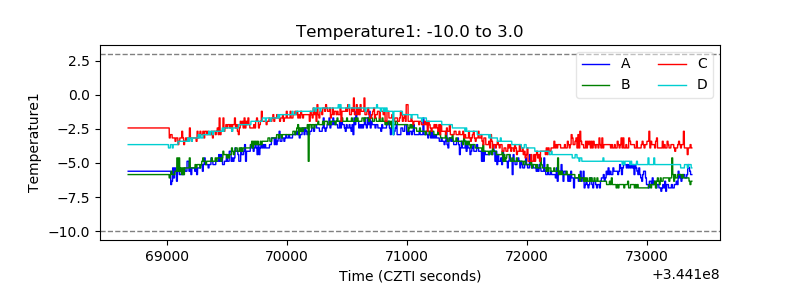 |
| Veto HV Monitor | 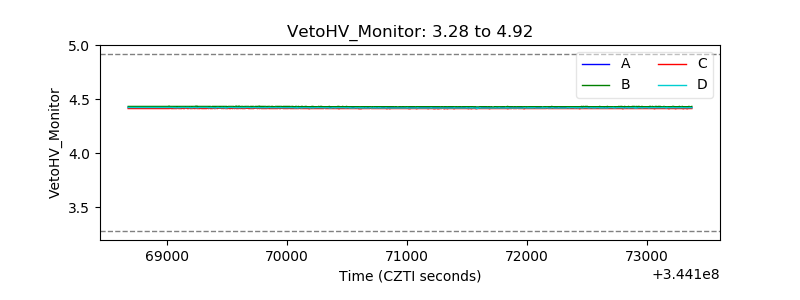 |
| Veto LLD | 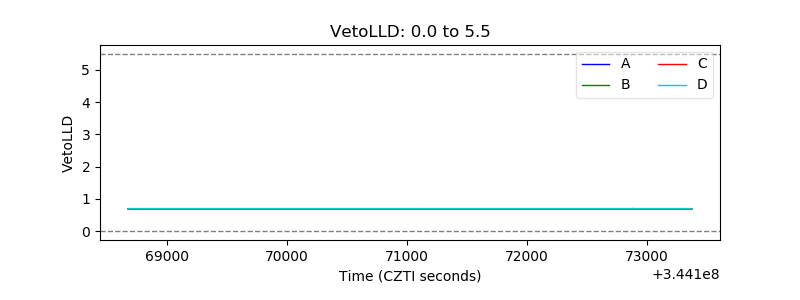 |
| Alpha Counter | 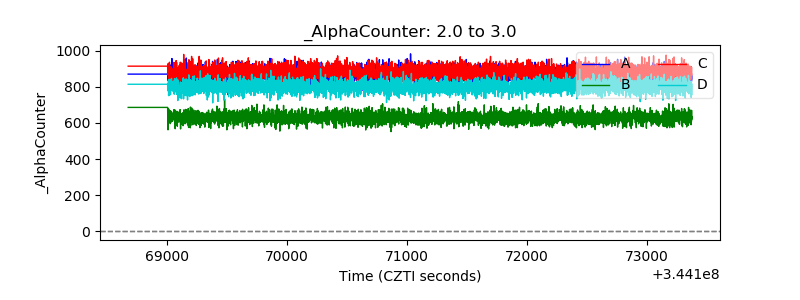 |
| _CPM_Rate | 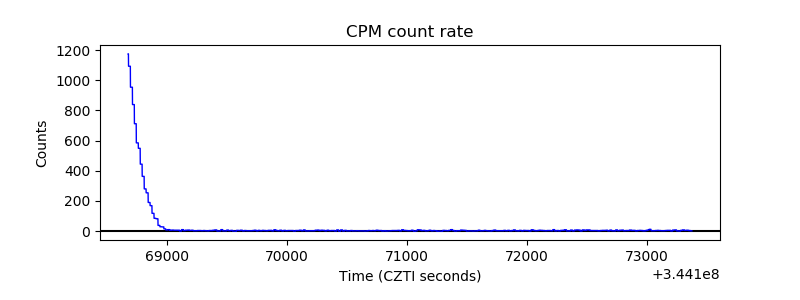 |
| CZT Counter | 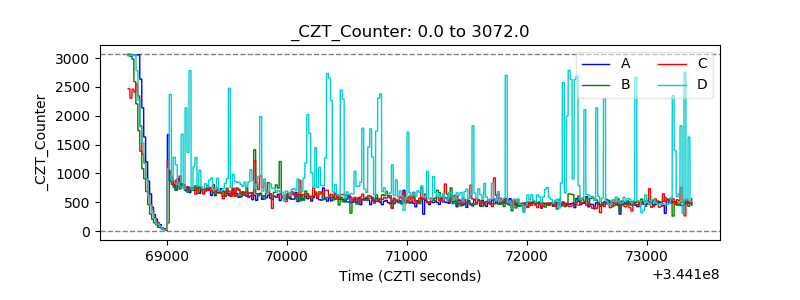 |
| +2.5 Volts monitor | 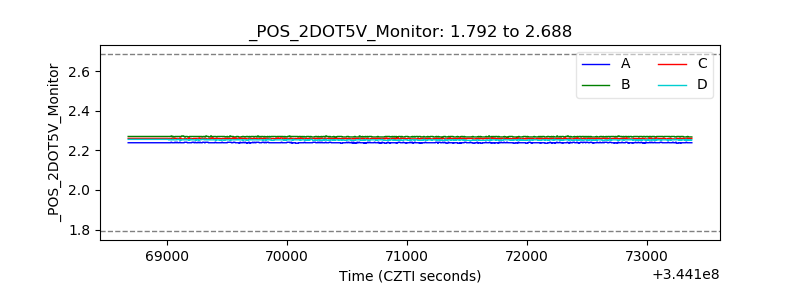 |
| +5 Volts monitor | 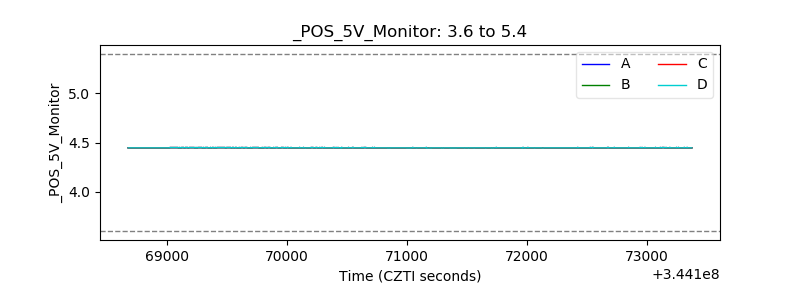 |
| _ROLL_ROT | 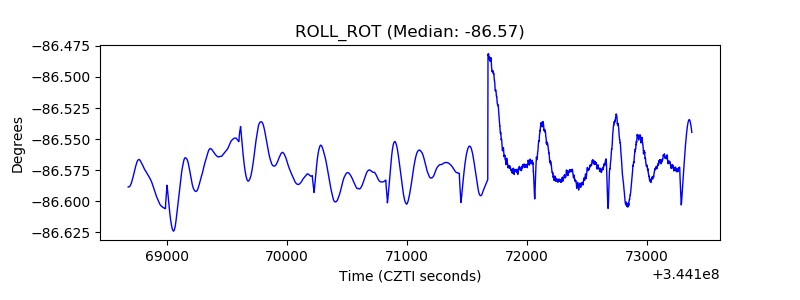 |
| _Roll_DEC | 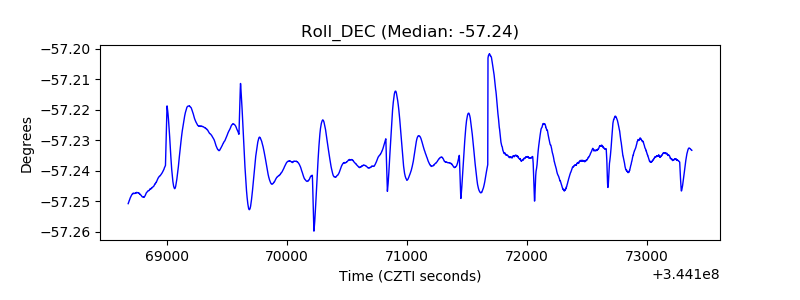 |
| _Roll_RA | 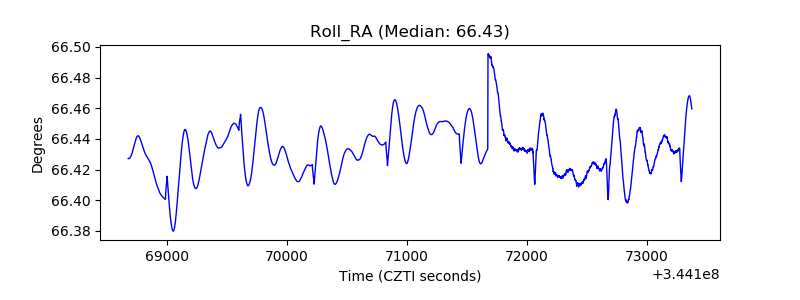 |
| Veto Counter | 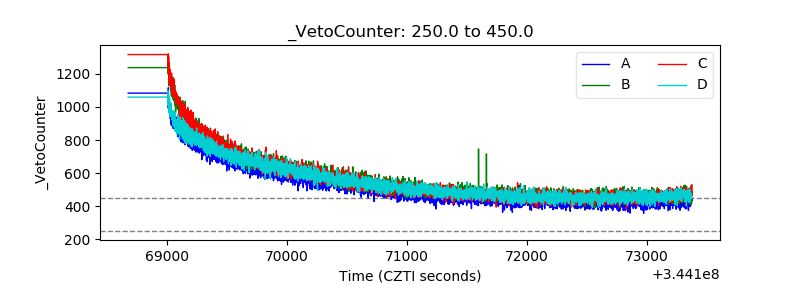 |