| Param | Original file | Final file |
|---|---|---|
| Filename | modeM0/AS1A10_016T01_9000004034cztM0_level2.fits | modeM0/AS1A10_016T01_9000004034cztM0_level2_quad_clean.evt |
| Size (bytes) | 930,968,640 | 654,845,760 |
| Size | 887.8 MB | 624.5 MB |
| Events in quadrant A | 5,944,776 | 3,655,858 |
| Events in quadrant B | 5,605,056 | 3,641,090 |
| Events in quadrant C | 5,751,280 | 3,437,077 |
| Events in quadrant D | 4,702,786 | 2,909,971 |
| Mode M0 | |||
|---|---|---|---|
| Quadrant | BADHDUFLAG | Total packets | Discarded packets |
| A | 0 | 190941 | 0 |
| B | 0 | 204506 | 0 |
| C | 0 | 203793 | 0 |
| D | 0 | 341873 | 0 |
| Mode SS | |||
|---|---|---|---|
| Quadrant | BADHDUFLAG | Total packets | Discarded packets |
| A | 0 | 1838 | 0 |
| B | 0 | 1836 | 0 |
| C | 0 | 1838 | 0 |
| D | 0 | 1840 | 0 |
| Mode M9 | |||
|---|---|---|---|
| Quadrant | BADHDUFLAG | Total packets | Discarded packets |
| A | 0 | 157 | 0 |
| B | 0 | 157 | 0 |
| C | 0 | 157 | 0 |
| D | 0 | 157 | 0 |
| Quadrant | Total seconds | Saturated seconds | Saturation percentage |
|---|---|---|---|
| A | 90233 | 1204 | 1.334323% |
| B | 90217 | 1740 | 1.928683% |
| C | 90198 | 2557 | 2.834874% |
| D | 90229 | 14112 | 15.640204% |
Noise dominated data is calculated using 1-second bins in cleaned event files. If a bin has >2000 counts, and if more than 50% of those come from <1% of pixels, then it is considered to be noise-dominated and hence unusable.
| Quadrant | # 1 sec bins | Bins with >0 counts | Bins with >2000 counts | High rate bins dominated by noise | Noise dominated (total time) | Noise dominated (detector-on time) | Marked lightcurve |
|---|---|---|---|---|---|---|---|
| A | 101875 | 88634 | 0 | 0 | 0.00% | 0.00% |  |
| B | 101875 | 88632 | 0 | 0 | 0.00% | 0.00% |  |
| C | 101875 | 88627 | 0 | 0 | 0.00% | 0.00% |  |
| D | 101875 | 88468 | 0 | 0 | 0.00% | 0.00% |  |
Top three noisy pixels from each quadrant. If the there are fewer than three noisy pixels in the level2.evt file, extra rows are filled as -1
| Pixel properties | Quadrant properties | ||||||
|---|---|---|---|---|---|---|---|
| Quadrant | DetID | PixID | Counts | Sigma | Mean | Median | Sigma |
| A | 0 | 29 | 4842 | 9.05 | 1548 | 1455 | 374.1 |
| A | 7 | 110 | 4561 | 8.3 | 1548 | 1455 | 374.1 |
| A | 9 | 19 | 4366 | 7.78 | 1548 | 1455 | 374.1 |
| B | 2 | 9 | 4435 | 10.31 | 1487 | 1420 | 292.4 |
| B | 2 | 8 | 3728 | 7.89 | 1487 | 1420 | 292.4 |
| B | 5 | 225 | 3625 | 7.54 | 1487 | 1420 | 292.4 |
| C | 1 | 80 | 4321 | 7.59 | 1519 | 1426 | 381.4 |
| C | 1 | 81 | 4284 | 7.49 | 1519 | 1426 | 381.4 |
| C | 12 | 241 | 3902 | 6.49 | 1519 | 1426 | 381.4 |
| D | 3 | 14 | 3344 | 5.97 | 1344 | 1229 | 354.2 |
| D | 7 | 3 | 3316 | 5.89 | 1344 | 1229 | 354.2 |
| D | 10 | 189 | 3292 | 5.82 | 1344 | 1229 | 354.2 |
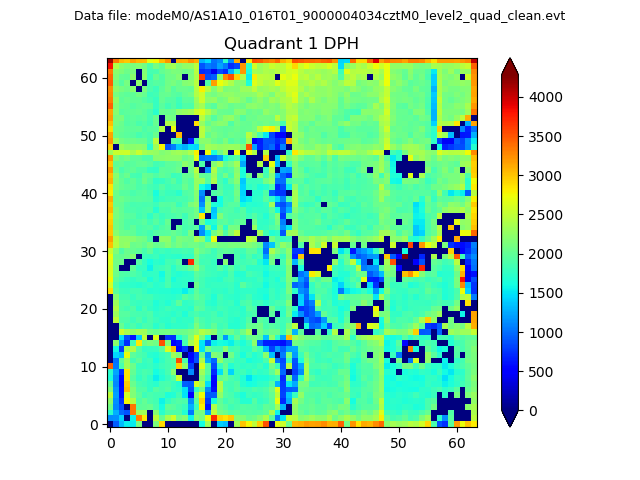
Histogram calculated using DETX and DETY for each event in the final _common_clean file
| Quadrant A |  |
 |
Quadrant B |
|---|---|---|---|
| Quadrant D | 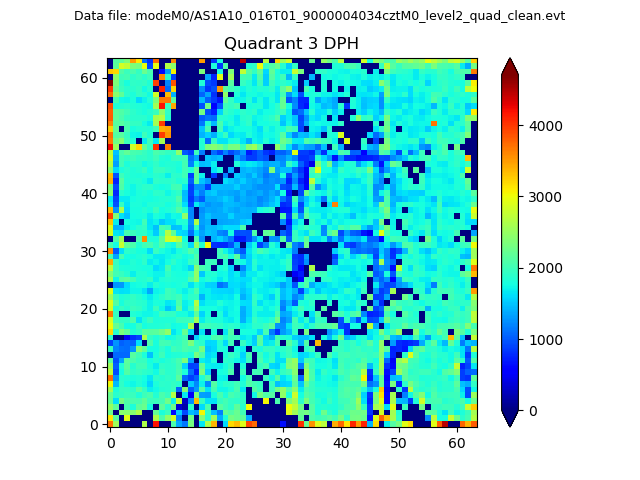 |
 |
Quadrant C |
| Plot type | Count rate plots | Images |
|---|---|---|
| Comparison with Poisson distribution Blue bars denote a histogram of data divided into 1 sec bins. Red curve is a Poisson curve with rate = median count rate of data. |
 |
 |
| Quadrant-wise count rates Data is divided into 100 sec bins |
 |
|
| Module-wise count rates for Quadrant A Data is divided into 100 sec bins |
 |
 |
| Module-wise count rates for Quadrant B Data is divided into 100 sec bins |
 |
 |
| Module-wise count rates for Quadrant C Data is divided into 100 sec bins |
 |
 |
| Module-wise count rates for Quadrant D Data is divided into 100 sec bins |
 |
 |
| Parameter | Plot |
|---|---|
| CZT HV Monitor |  |
| D_VDD | 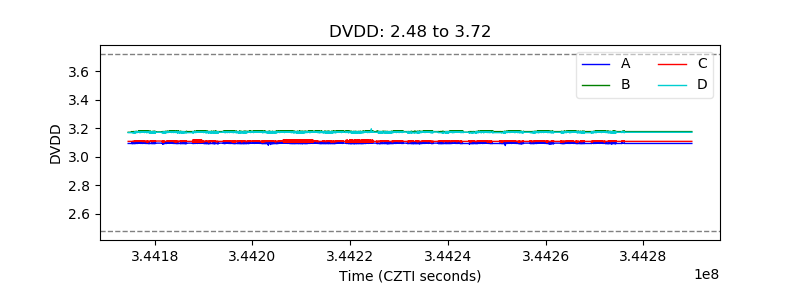 |
| Temperature 1 |  |
| Veto HV Monitor |  |
| Veto LLD |  |
| Alpha Counter |  |
| _CPM_Rate |  |
| CZT Counter |  |
| +2.5 Volts monitor |  |
| +5 Volts monitor |  |
| _ROLL_ROT |  |
| _Roll_DEC |  |
| _Roll_RA |  |
| Veto Counter |  |