| Param | Original file | Final file |
|---|---|---|
| Filename | modeM0/AS1A10_016T01_9000004034_27936cztM0_level2.evt | modeM0/AS1A10_016T01_9000004034_27936cztM0_level2_quad_clean.evt |
| Size (bytes) | 124,525,440 | 25,560,000 |
| Size | 118.8 MB | 24.4 MB |
| Events in quadrant A | 829,839 | 171,685 |
| Events in quadrant B | 858,503 | 176,119 |
| Events in quadrant C | 860,147 | 167,347 |
| Events in quadrant D | 1,130,973 | 159,932 |
| Mode M0 | |||
|---|---|---|---|
| Quadrant | BADHDUFLAG | Total packets | Discarded packets |
| A | 0 | 3472 | 0 |
| B | 0 | 3594 | 0 |
| C | 0 | 3633 | 0 |
| D | 0 | 4405 | 0 |
| Mode M9 | |||
|---|---|---|---|
| Quadrant | BADHDUFLAG | Total packets | Discarded packets |
| A | 0 | 7 | 0 |
| B | 0 | 7 | 0 |
| C | 0 | 7 | 0 |
| D | 0 | 7 | 0 |
| Quadrant | Total seconds | Saturated seconds | Saturation percentage |
|---|---|---|---|
| A | 1315 | 11 | 0.836502% |
| B | 1315 | 9 | 0.684411% |
| C | 1314 | 25 | 1.902588% |
| D | 1314 | 51 | 3.881279% |
Noise dominated data is calculated using 1-second bins in cleaned event files. If a bin has >2000 counts, and if more than 50% of those come from <1% of pixels, then it is considered to be noise-dominated and hence unusable.
| Quadrant | # 1 sec bins | Bins with >0 counts | Bins with >2000 counts | High rate bins dominated by noise | Noise dominated (total time) | Noise dominated (detector-on time) | Marked lightcurve |
|---|---|---|---|---|---|---|---|
| A | 1315 | 1315 | 1 | 1 | 0.08% | 0.08% | 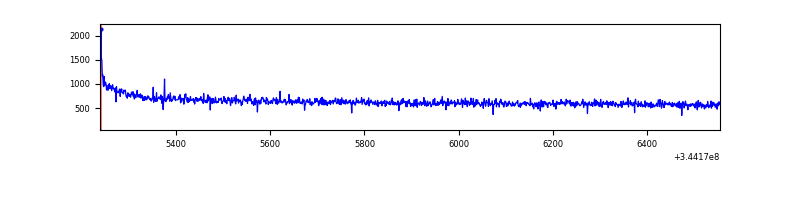 |
| B | 1315 | 1315 | 0 | 0 | 0.00% | 0.00% | 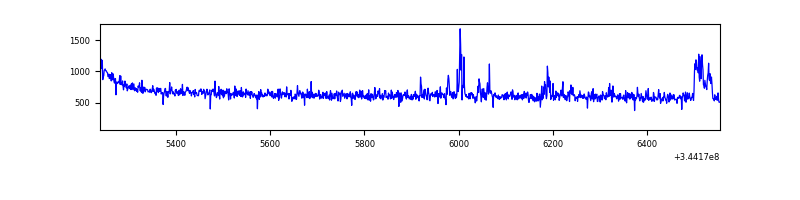 |
| C | 1314 | 1314 | 0 | 0 | 0.00% | 0.00% | 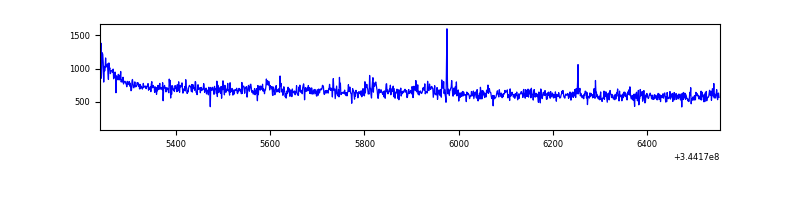 |
| D | 1314 | 1314 | 38 | 38 | 2.89% | 2.89% | 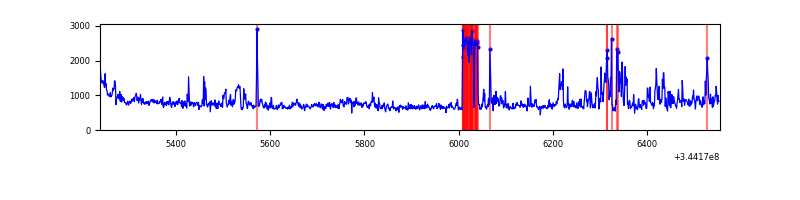 |
Top three noisy pixels from each quadrant. If the there are fewer than three noisy pixels in the level2.evt file, extra rows are filled as -1
| Pixel properties | Quadrant properties | ||||||
|---|---|---|---|---|---|---|---|
| Quadrant | DetID | PixID | Counts | Sigma | Mean | Median | Sigma |
| A | 8 | 192 | 4406 | 97.06 | 214 | 210 | 43.2 |
| A | 0 | 226 | 1934 | 39.88 | 214 | 210 | 43.2 |
| A | 13 | 254 | 1887 | 38.79 | 214 | 210 | 43.2 |
| B | 10 | 245 | 27674 | 689.4 | 207 | 204 | 39.8 |
| B | 0 | 183 | 10077 | 247.78 | 207 | 204 | 39.8 |
| B | 0 | 190 | 5898 | 142.9 | 207 | 204 | 39.8 |
| C | 14 | 238 | 33944 | 705.33 | 203 | 205 | 47.8 |
| C | 3 | 233 | 32750 | 680.37 | 203 | 205 | 47.8 |
| C | 2 | 16 | 1484 | 26.74 | 203 | 205 | 47.8 |
| D | 1 | 52 | 258747 | 5260.01 | 204 | 200 | 49.2 |
| D | 8 | 195 | 70781 | 1435.93 | 204 | 200 | 49.2 |
| D | 13 | 104 | 21098 | 425.16 | 204 | 200 | 49.2 |
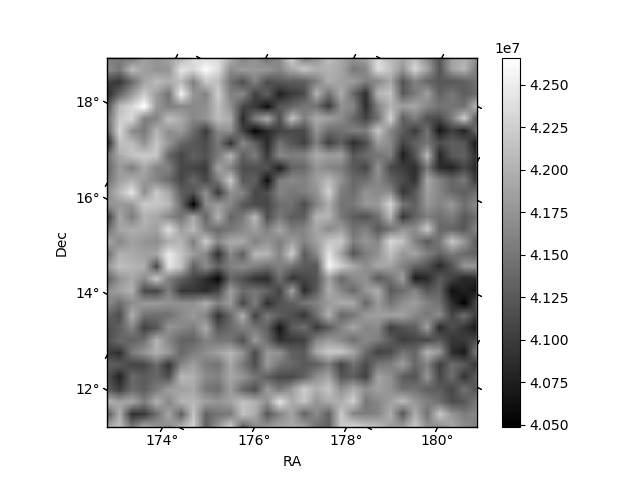
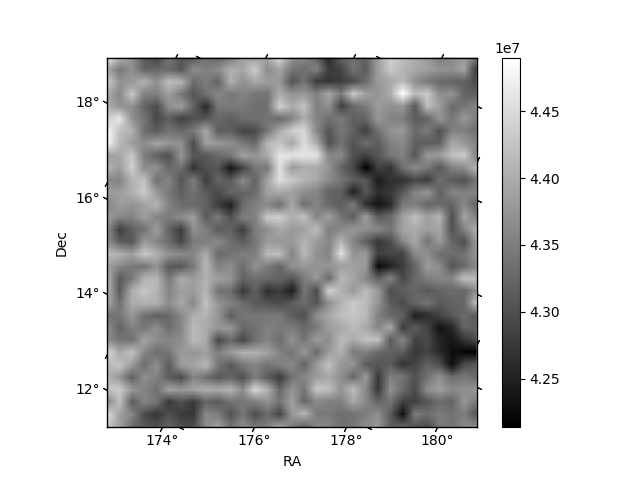
Histogram calculated using DETX and DETY for each event in the final _common_clean file
| Quadrant A | 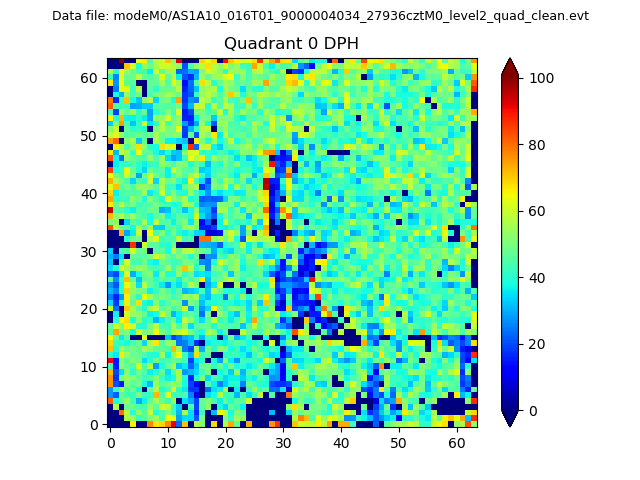 |
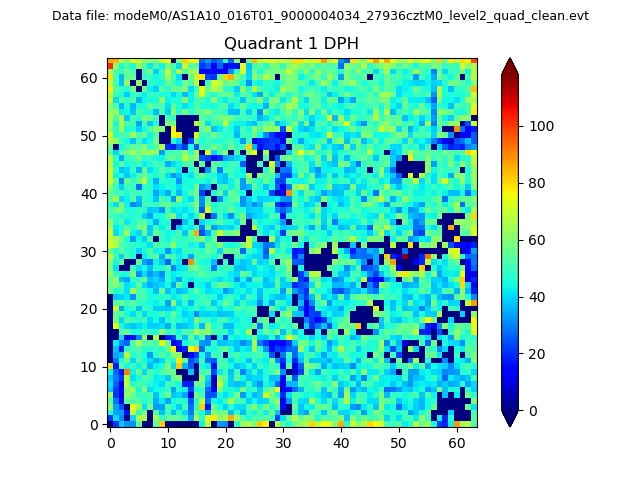 |
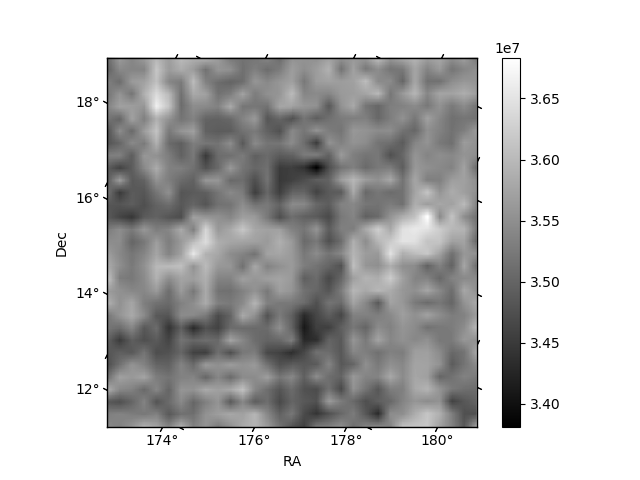
Quadrant B |
|---|---|---|---|
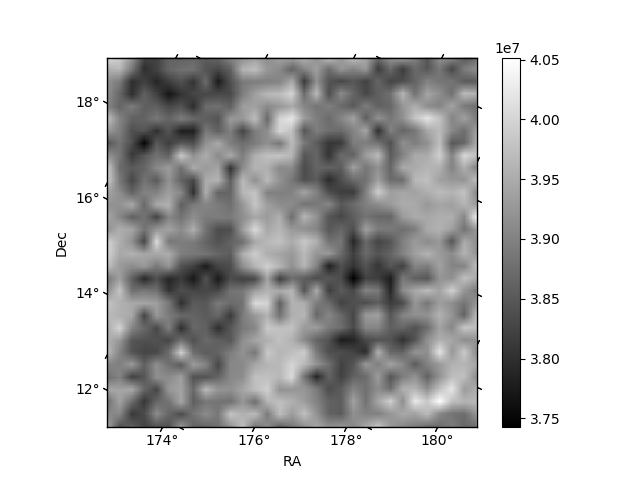
| Quadrant D | 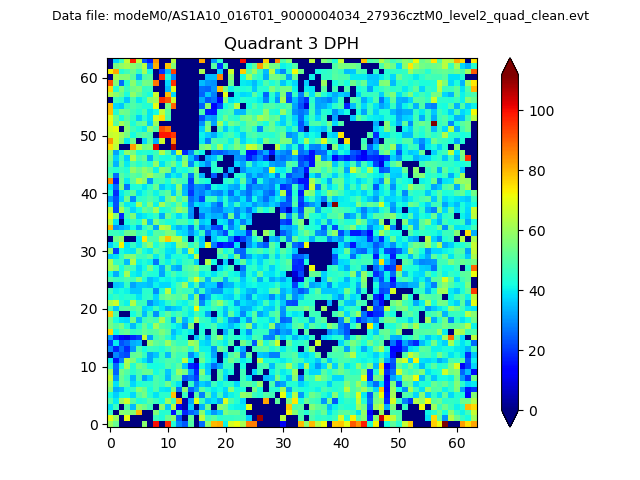 |
 |
Quadrant C |
| Plot type | Count rate plots | Images |
|---|---|---|
| Comparison with Poisson distribution Blue bars denote a histogram of data divided into 1 sec bins. Red curve is a Poisson curve with rate = median count rate of data. |
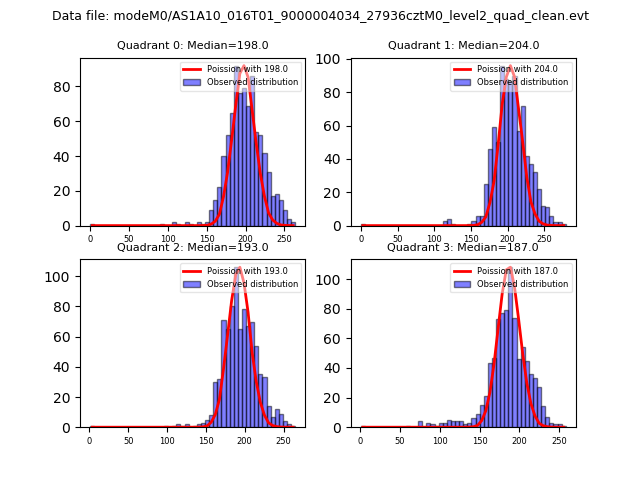 |
 |
| Quadrant-wise count rates Data is divided into 100 sec bins |
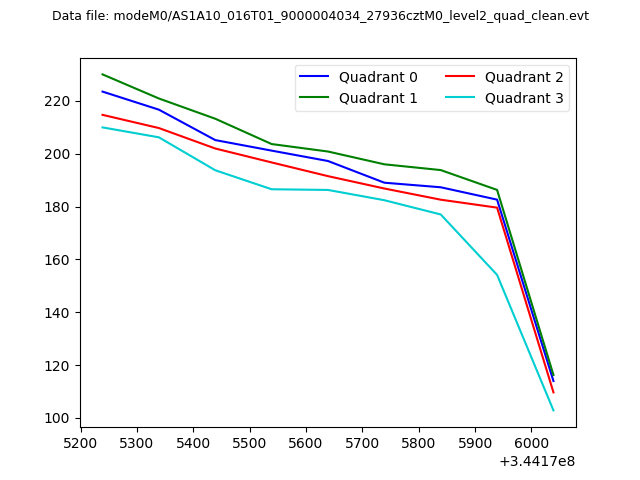 |
|
| Module-wise count rates for Quadrant A Data is divided into 100 sec bins |
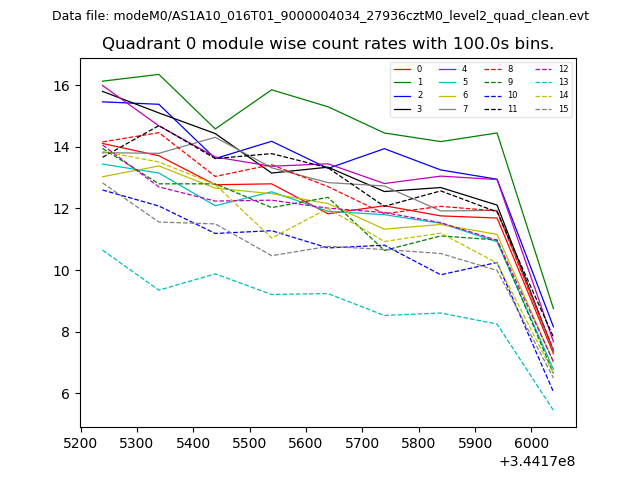 |
 |
| Module-wise count rates for Quadrant B Data is divided into 100 sec bins |
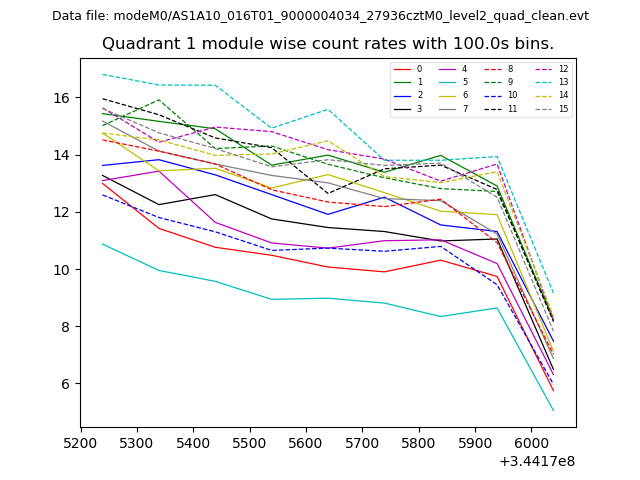 |
 |
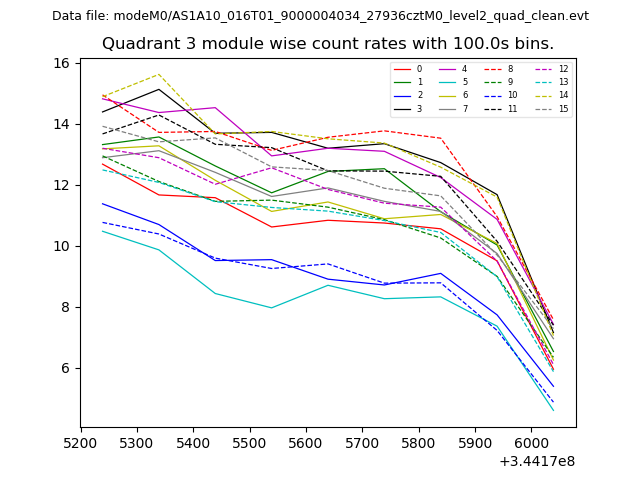
| Module-wise count rates for Quadrant C Data is divided into 100 sec bins |
 |
 |
| Module-wise count rates for Quadrant D Data is divided into 100 sec bins |
 |
 |
| Parameter | Plot |
|---|---|
| CZT HV Monitor | 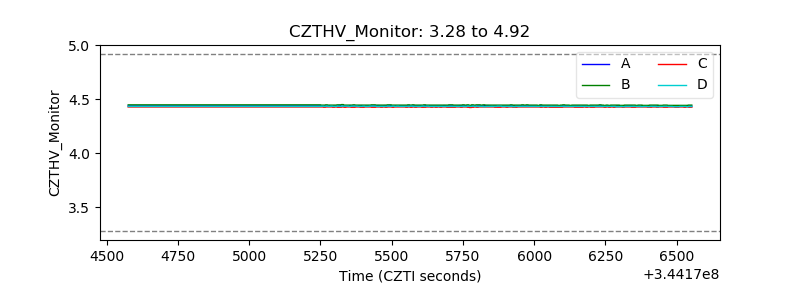 |
| D_VDD | 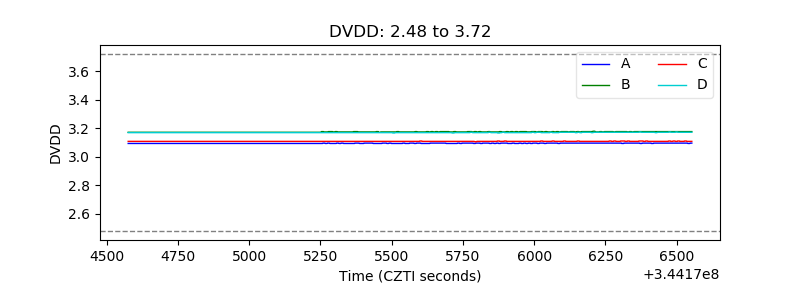 |
| Temperature 1 | 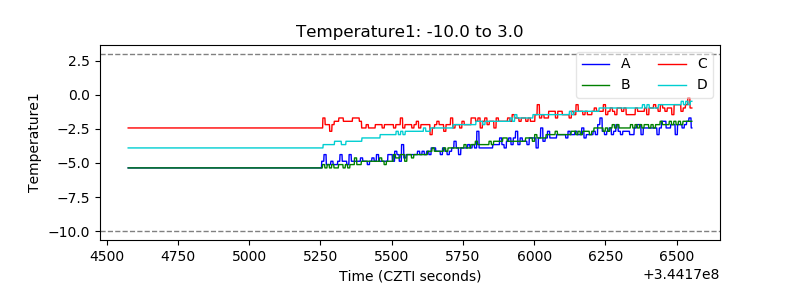 |
| Veto HV Monitor | 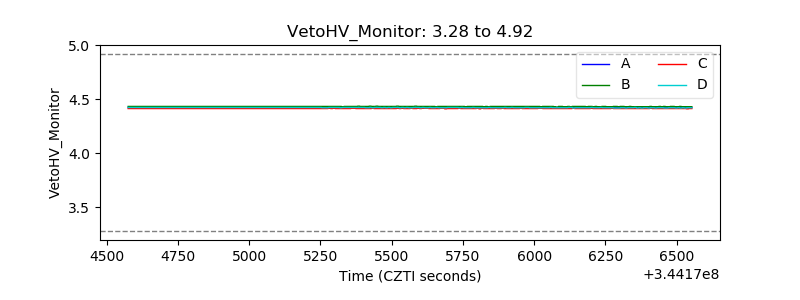 |
| Veto LLD | 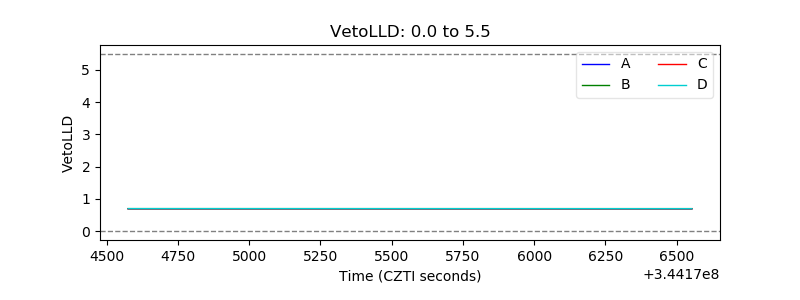 |
| Alpha Counter |  |
| _CPM_Rate | 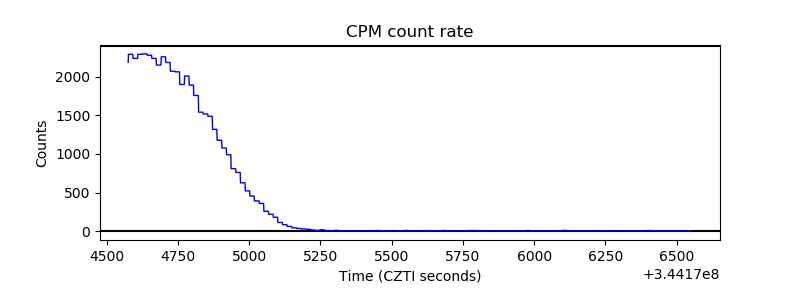 |
| CZT Counter | 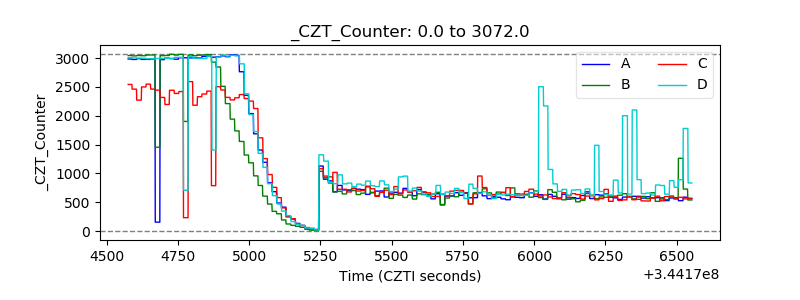 |
| +2.5 Volts monitor |  |
| +5 Volts monitor |  |
| _ROLL_ROT | 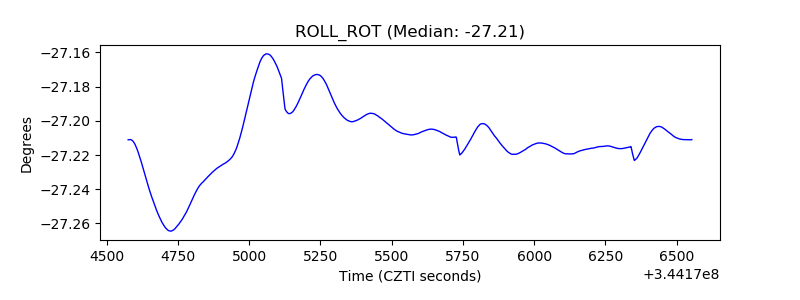 |
| _Roll_DEC | 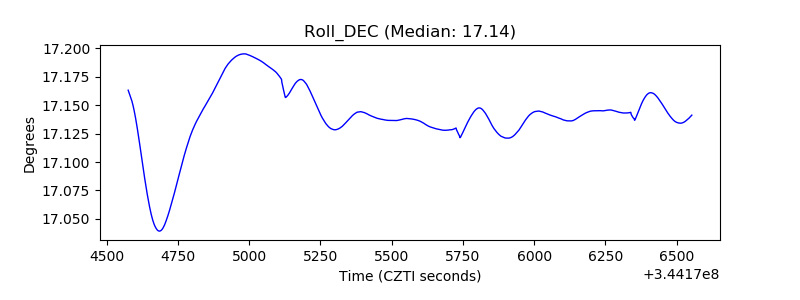 |
| _Roll_RA | 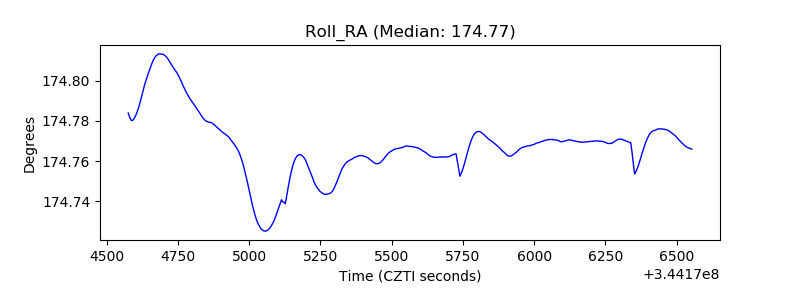 |
| Veto Counter | 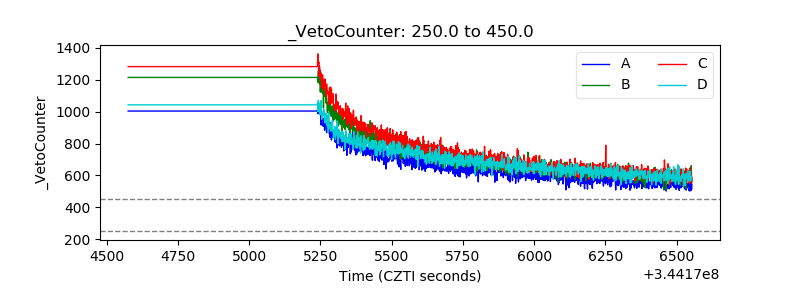 |