| Param | Original file | Final file |
|---|---|---|
| Filename | modeM0/AS1A10_016T01_9000004034_27937cztM0_level2.evt | modeM0/AS1A10_016T01_9000004034_27937cztM0_level2_quad_clean.evt |
| Size (bytes) | 598,360,320 | 80,124,480 |
| Size | 570.6 MB | 76.4 MB |
| Events in quadrant A | 3,466,246 | 515,839 |
| Events in quadrant B | 3,748,589 | 523,069 |
| Events in quadrant C | 4,011,479 | 491,815 |
| Events in quadrant D | 6,479,405 | 466,178 |
| Mode M0 | |||
|---|---|---|---|
| Quadrant | BADHDUFLAG | Total packets | Discarded packets |
| A | 0 | 14059 | 0 |
| B | 0 | 15161 | 0 |
| C | 0 | 16105 | 0 |
| D | 0 | 23844 | 0 |
| Mode M9 | |||
|---|---|---|---|
| Quadrant | BADHDUFLAG | Total packets | Discarded packets |
| A | 0 | 13 | 0 |
| B | 0 | 13 | 0 |
| C | 0 | 13 | 0 |
| D | 0 | 13 | 0 |
| Quadrant | Total seconds | Saturated seconds | Saturation percentage |
|---|---|---|---|
| A | 6143 | 112 | 1.823213% |
| B | 6144 | 107 | 1.741536% |
| C | 6144 | 316 | 5.143229% |
| D | 6144 | 783 | 12.744141% |
Noise dominated data is calculated using 1-second bins in cleaned event files. If a bin has >2000 counts, and if more than 50% of those come from <1% of pixels, then it is considered to be noise-dominated and hence unusable.
| Quadrant | # 1 sec bins | Bins with >0 counts | Bins with >2000 counts | High rate bins dominated by noise | Noise dominated (total time) | Noise dominated (detector-on time) | Marked lightcurve |
|---|---|---|---|---|---|---|---|
| A | 7433 | 6143 | 0 | 0 | 0.00% | 0.00% | 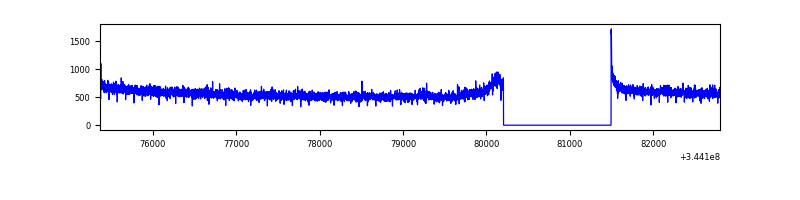 |
| B | 7434 | 6144 | 0 | 0 | 0.00% | 0.00% | 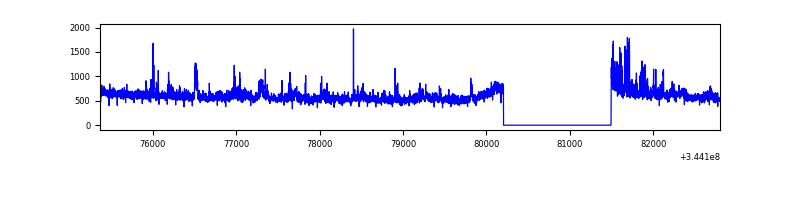 |
| C | 7434 | 6144 | 105 | 105 | 1.41% | 1.71% | 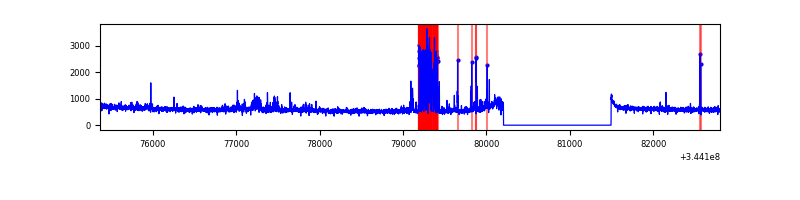 |
| D | 7434 | 6144 | 600 | 600 | 8.07% | 9.77% | 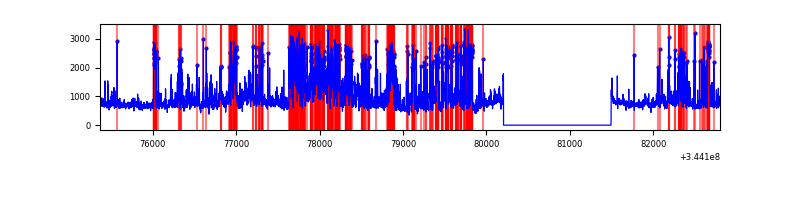 |
Top three noisy pixels from each quadrant. If the there are fewer than three noisy pixels in the level2.evt file, extra rows are filled as -1
| Pixel properties | Quadrant properties | ||||||
|---|---|---|---|---|---|---|---|
| Quadrant | DetID | PixID | Counts | Sigma | Mean | Median | Sigma |
| A | 15 | 174 | 23780 | 130.17 | 892 | 878 | 175.9 |
| A | 13 | 254 | 8999 | 46.16 | 892 | 878 | 175.9 |
| A | 0 | 226 | 7889 | 39.85 | 892 | 878 | 175.9 |
| B | 10 | 245 | 257873 | 1581.39 | 874 | 856 | 162.5 |
| B | 0 | 183 | 22542 | 133.43 | 874 | 856 | 162.5 |
| B | 0 | 230 | 20287 | 119.56 | 874 | 856 | 162.5 |
| C | 2 | 16 | 330969 | 1697.56 | 845 | 857 | 194.5 |
| C | 3 | 233 | 184455 | 944.13 | 845 | 857 | 194.5 |
| C | 14 | 238 | 147242 | 752.77 | 845 | 857 | 194.5 |
| D | 1 | 52 | 2363551 | 11942.78 | 835 | 816 | 197.8 |
| D | 8 | 195 | 474686 | 2395.24 | 835 | 816 | 197.8 |
| D | 2 | 250 | 172420 | 867.4 | 835 | 816 | 197.8 |
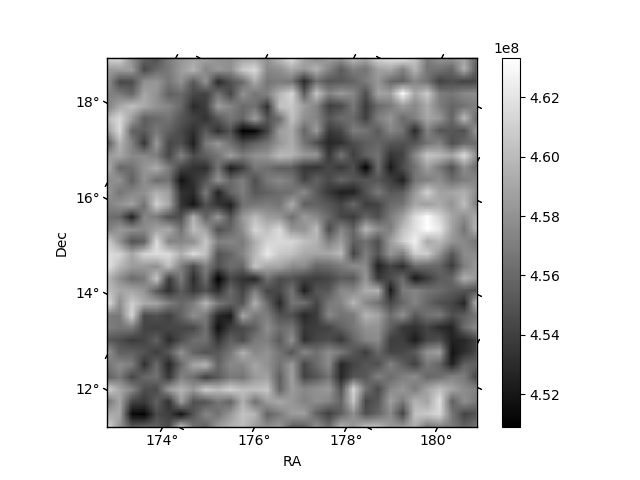
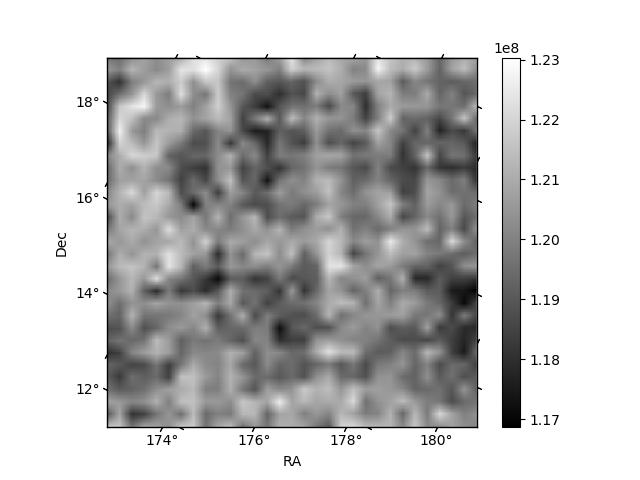
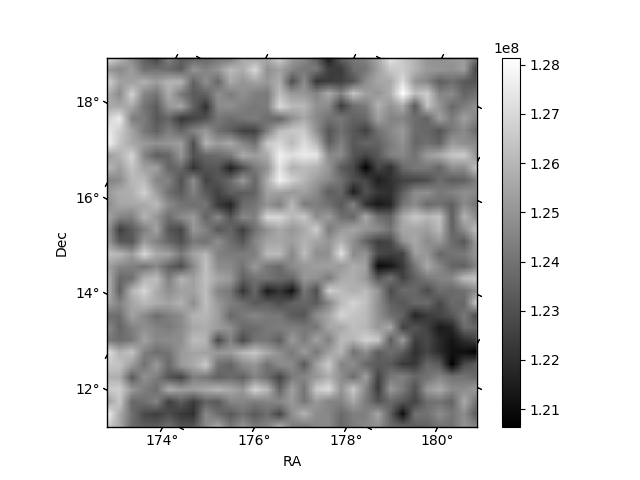
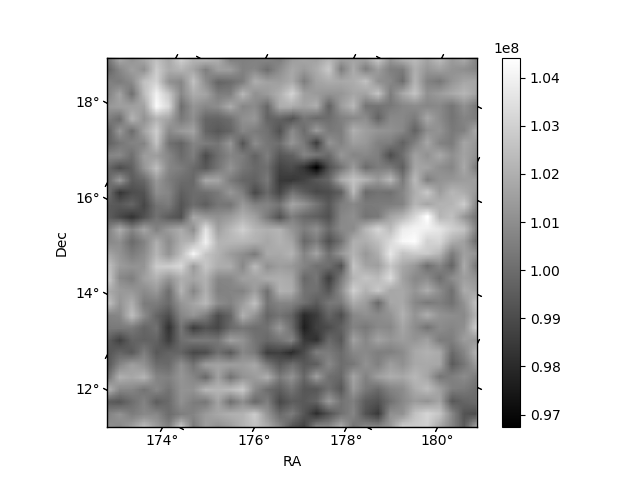
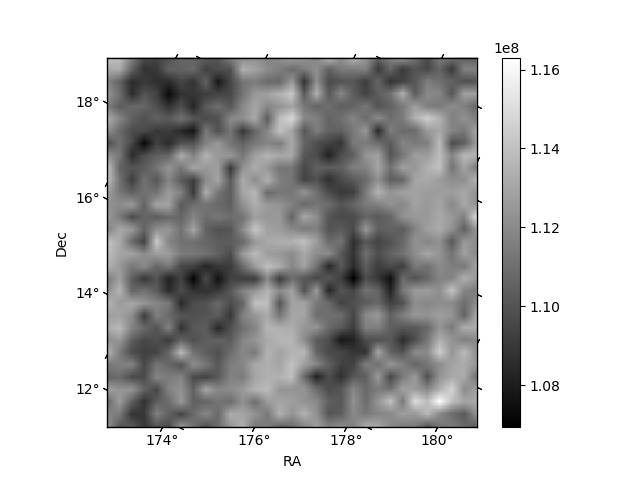
Histogram calculated using DETX and DETY for each event in the final _common_clean file
| Quadrant A | 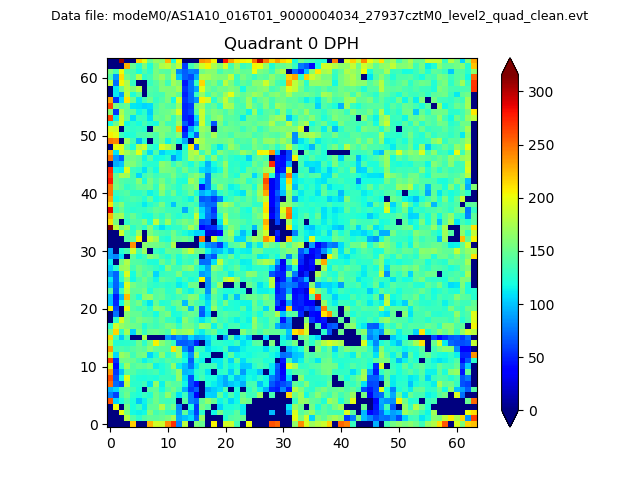 |
 |
Quadrant B |
|---|---|---|---|
| Quadrant D | 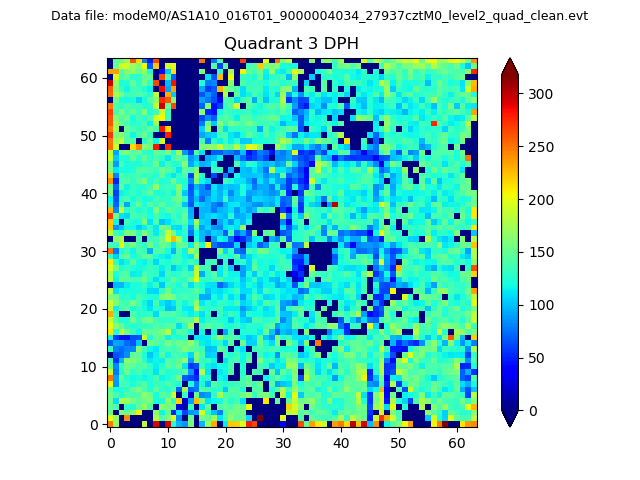 |
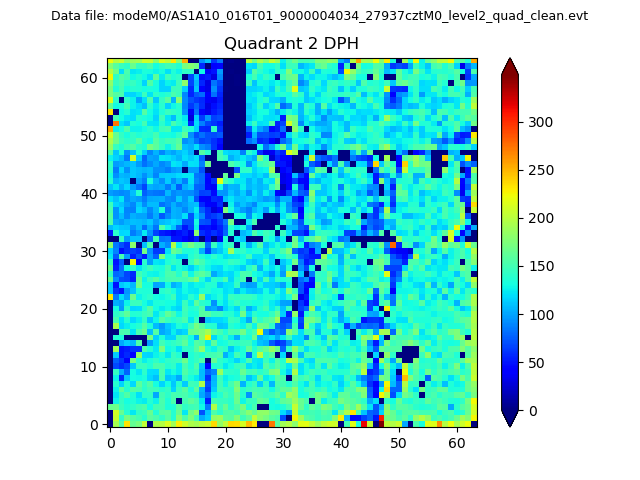 |
Quadrant C |
| Plot type | Count rate plots | Images |
|---|---|---|
| Comparison with Poisson distribution Blue bars denote a histogram of data divided into 1 sec bins. Red curve is a Poisson curve with rate = median count rate of data. |
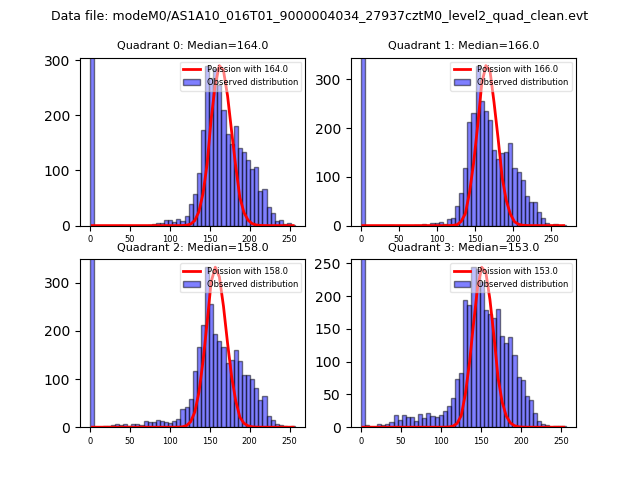 |
 |
| Quadrant-wise count rates Data is divided into 100 sec bins |
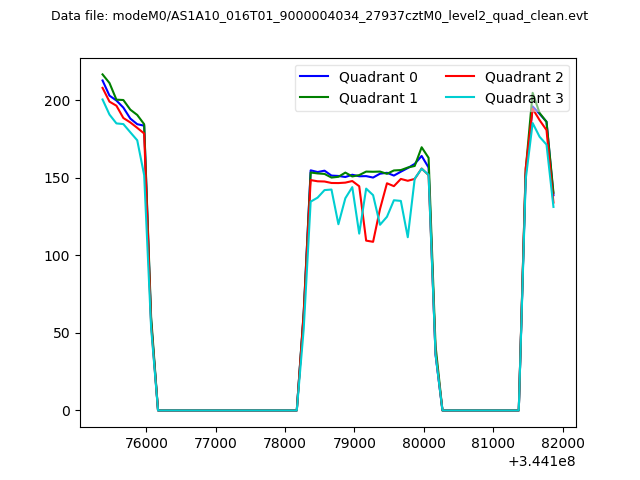 |
|
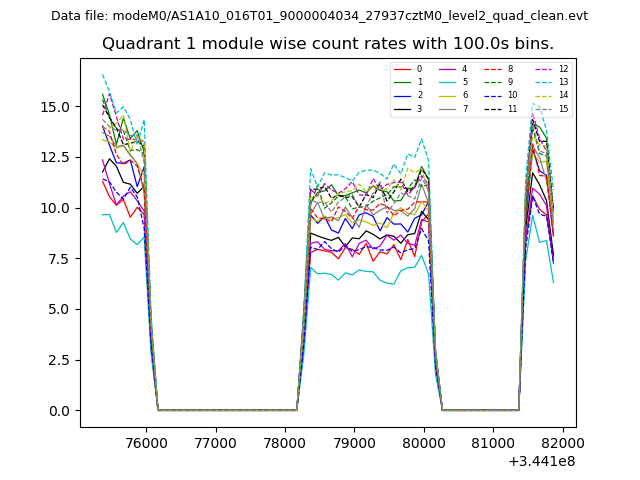
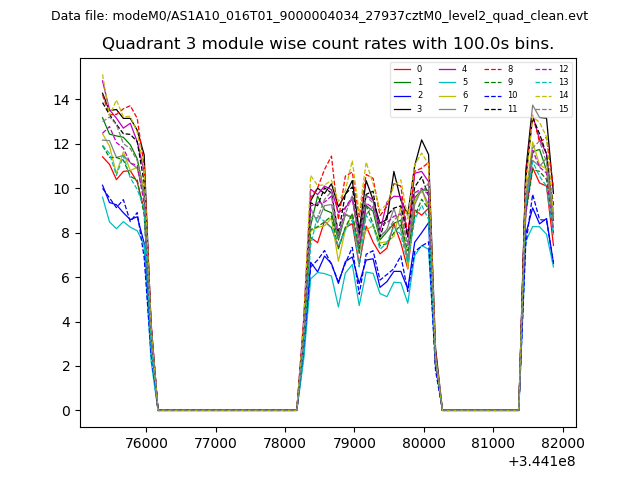
| Module-wise count rates for Quadrant A Data is divided into 100 sec bins |
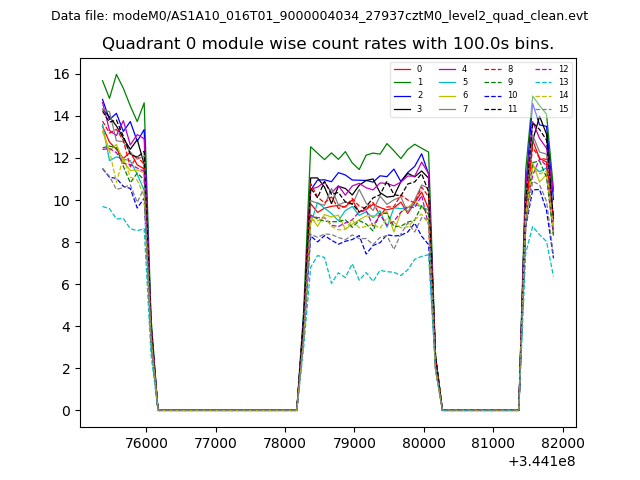 |
 |
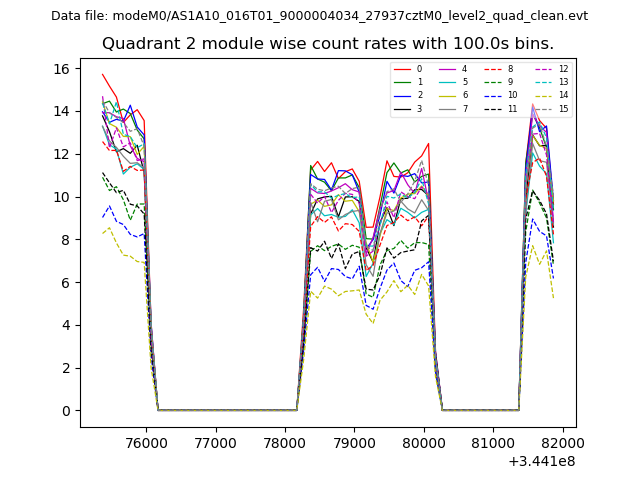
| Module-wise count rates for Quadrant B Data is divided into 100 sec bins |
 |
 |
| Module-wise count rates for Quadrant C Data is divided into 100 sec bins |
 |
 |
| Module-wise count rates for Quadrant D Data is divided into 100 sec bins |
 |
 |
| Parameter | Plot |
|---|---|
| CZT HV Monitor | 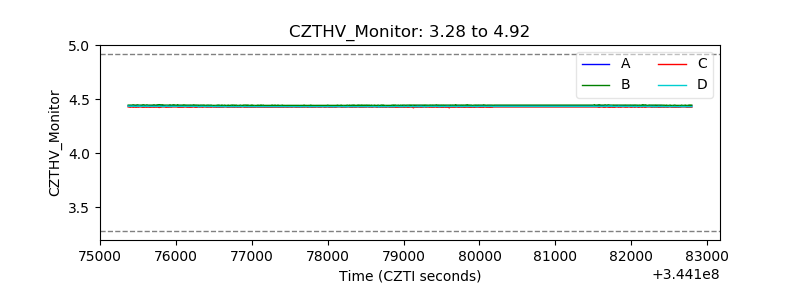 |
| D_VDD | 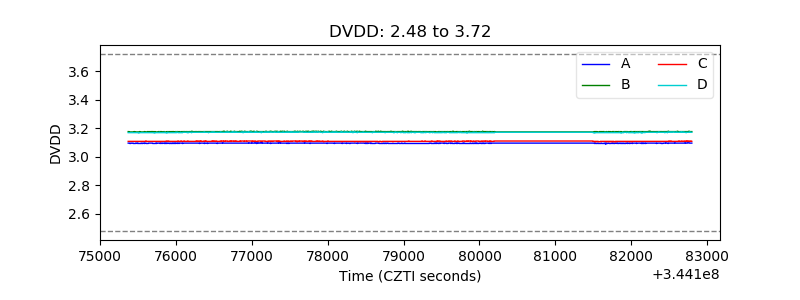 |
| Temperature 1 | 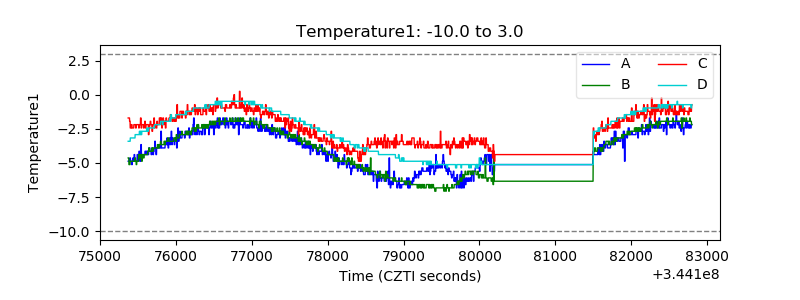 |
| Veto HV Monitor |  |
| Veto LLD | 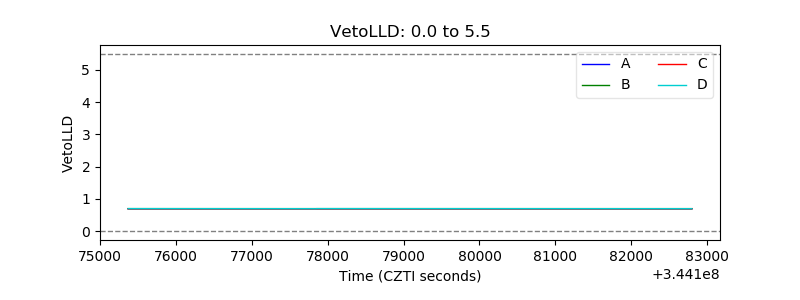 |
| Alpha Counter | 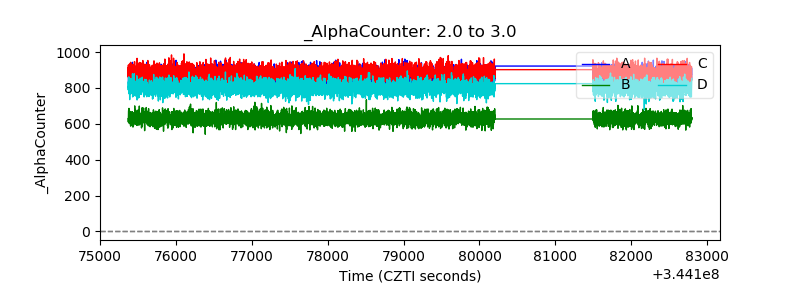 |
| _CPM_Rate | 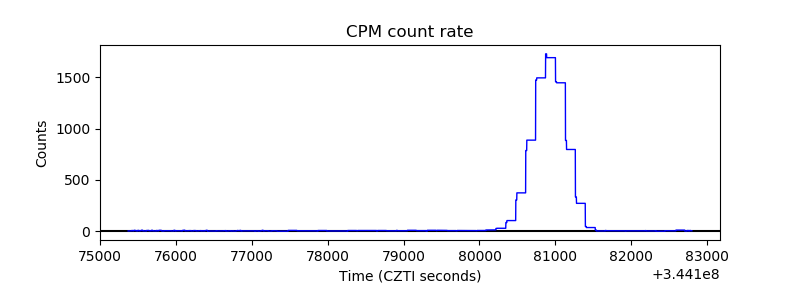 |
| CZT Counter | 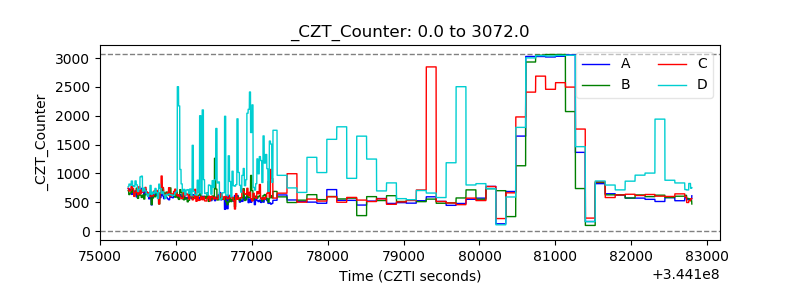 |
| +2.5 Volts monitor |  |
| +5 Volts monitor |  |
| _ROLL_ROT | 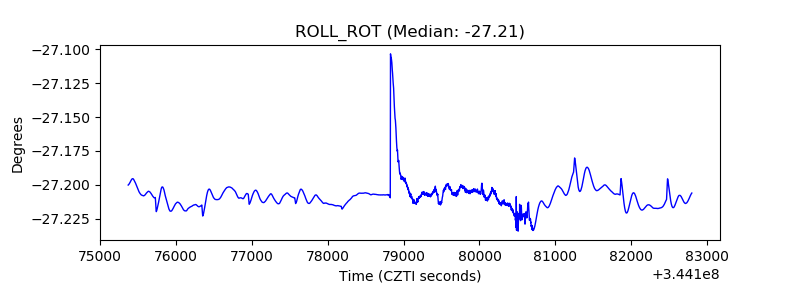 |
| _Roll_DEC | 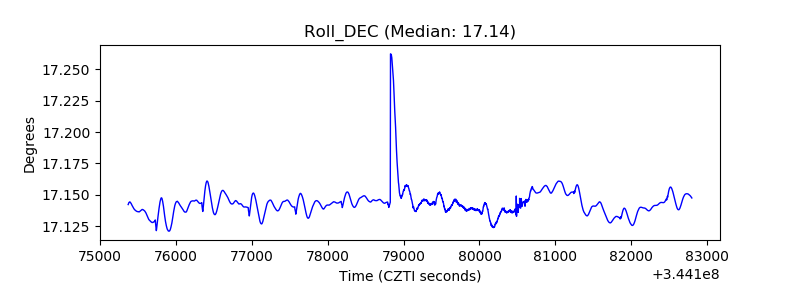 |
| _Roll_RA |  |
| Veto Counter | 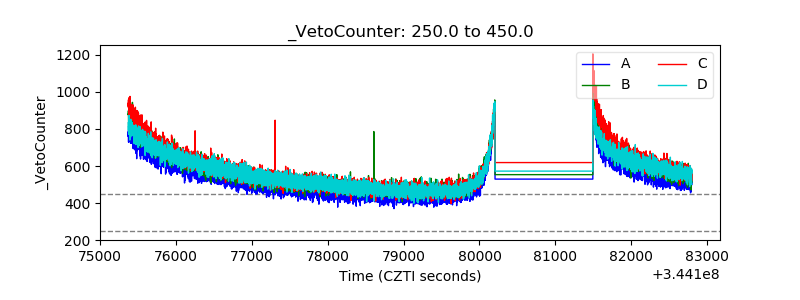 |