| Param | Original file | Final file |
|---|---|---|
| Filename | modeM0/AS1A10_016T01_9000004034_27938cztM0_level2.evt | modeM0/AS1A10_016T01_9000004034_27938cztM0_level2_quad_clean.evt |
| Size (bytes) | 567,328,320 | 74,733,120 |
| Size | 541.0 MB | 71.3 MB |
| Events in quadrant A | 3,651,362 | 458,127 |
| Events in quadrant B | 3,798,439 | 462,246 |
| Events in quadrant C | 3,871,704 | 441,380 |
| Events in quadrant D | 5,409,298 | 437,103 |
| Mode M0 | |||
|---|---|---|---|
| Quadrant | BADHDUFLAG | Total packets | Discarded packets |
| A | 0 | 14709 | 0 |
| B | 0 | 15216 | 0 |
| C | 0 | 15569 | 0 |
| D | 0 | 21078 | 0 |
| Mode M9 | |||
|---|---|---|---|
| Quadrant | BADHDUFLAG | Total packets | Discarded packets |
| A | 0 | 16 | 0 |
| B | 0 | 17 | 0 |
| C | 0 | 17 | 0 |
| D | 0 | 17 | 0 |
| Quadrant | Total seconds | Saturated seconds | Saturation percentage |
|---|---|---|---|
| A | 6658 | 146 | 2.192851% |
| B | 6658 | 143 | 2.147792% |
| C | 6658 | 219 | 3.289276% |
| D | 6657 | 351 | 5.272645% |
Noise dominated data is calculated using 1-second bins in cleaned event files. If a bin has >2000 counts, and if more than 50% of those come from <1% of pixels, then it is considered to be noise-dominated and hence unusable.
| Quadrant | # 1 sec bins | Bins with >0 counts | Bins with >2000 counts | High rate bins dominated by noise | Noise dominated (total time) | Noise dominated (detector-on time) | Marked lightcurve |
|---|---|---|---|---|---|---|---|
| A | 7798 | 6658 | 0 | 0 | 0.00% | 0.00% | 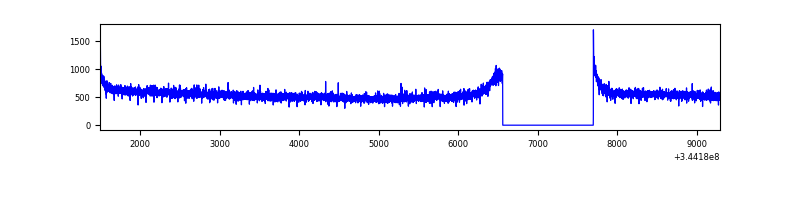 |
| B | 7798 | 6658 | 0 | 0 | 0.00% | 0.00% | 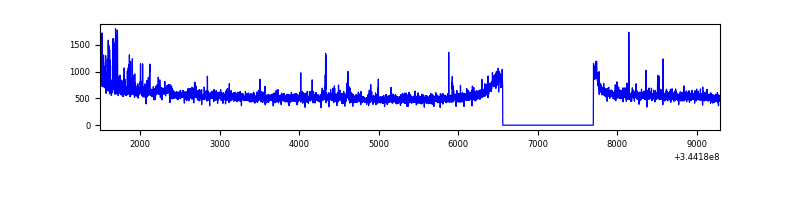 |
| C | 7798 | 6658 | 6 | 6 | 0.08% | 0.09% | 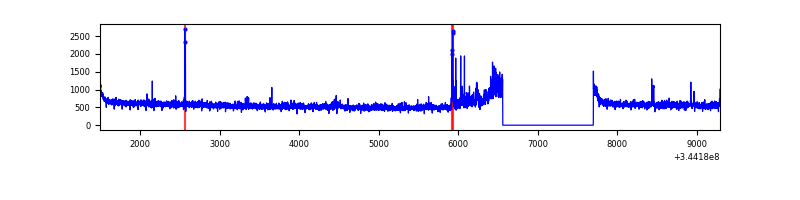 |
| D | 7797 | 6657 | 170 | 170 | 2.18% | 2.55% | 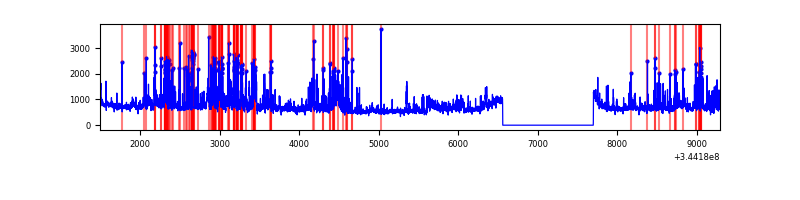 |
Top three noisy pixels from each quadrant. If the there are fewer than three noisy pixels in the level2.evt file, extra rows are filled as -1
| Pixel properties | Quadrant properties | ||||||
|---|---|---|---|---|---|---|---|
| Quadrant | DetID | PixID | Counts | Sigma | Mean | Median | Sigma |
| A | 15 | 174 | 12103 | 59.72 | 941 | 923 | 187.2 |
| A | 13 | 254 | 9727 | 47.03 | 941 | 923 | 187.2 |
| A | 3 | 137 | 8526 | 40.61 | 941 | 923 | 187.2 |
| B | 10 | 245 | 142584 | 814.3 | 925 | 903 | 174.0 |
| B | 12 | 111 | 20619 | 113.31 | 925 | 903 | 174.0 |
| B | 11 | 111 | 18925 | 103.58 | 925 | 903 | 174.0 |
| C | 14 | 238 | 146337 | 701.26 | 898 | 909 | 207.4 |
| C | 6 | 112 | 73989 | 352.39 | 898 | 909 | 207.4 |
| C | 3 | 233 | 61198 | 290.72 | 898 | 909 | 207.4 |
| D | 1 | 52 | 1128203 | 5228.12 | 908 | 886 | 215.6 |
| D | 8 | 195 | 571716 | 2647.32 | 908 | 886 | 215.6 |
| D | 2 | 250 | 134077 | 617.7 | 908 | 886 | 215.6 |
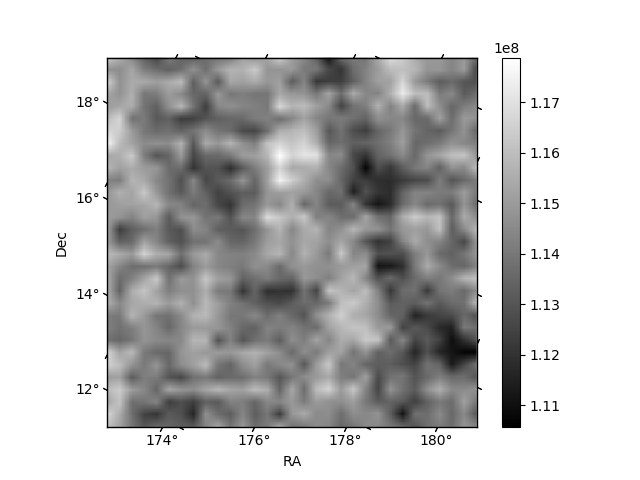
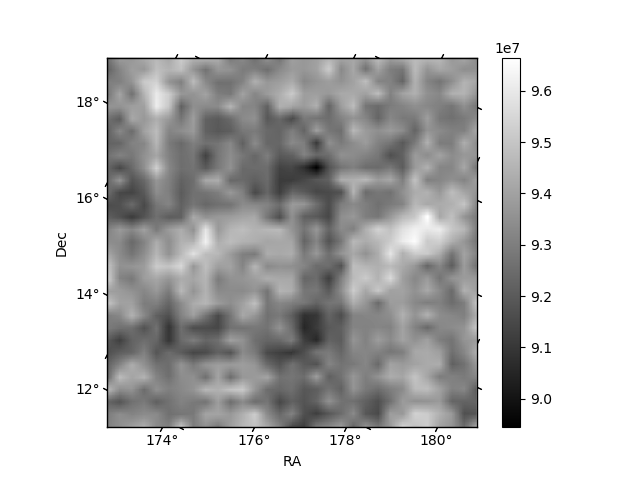
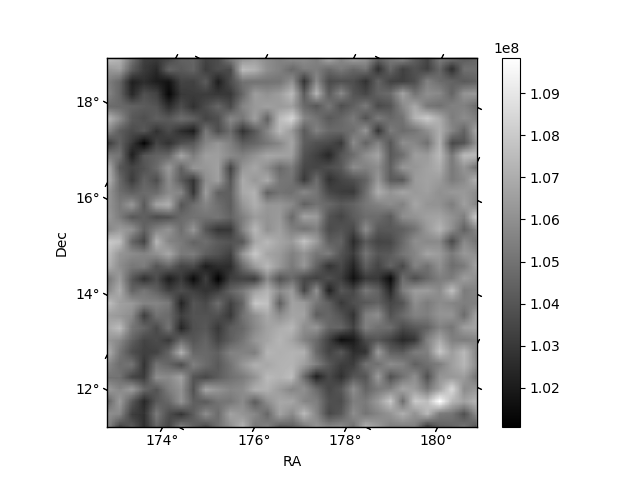
Histogram calculated using DETX and DETY for each event in the final _common_clean file
| Quadrant A | 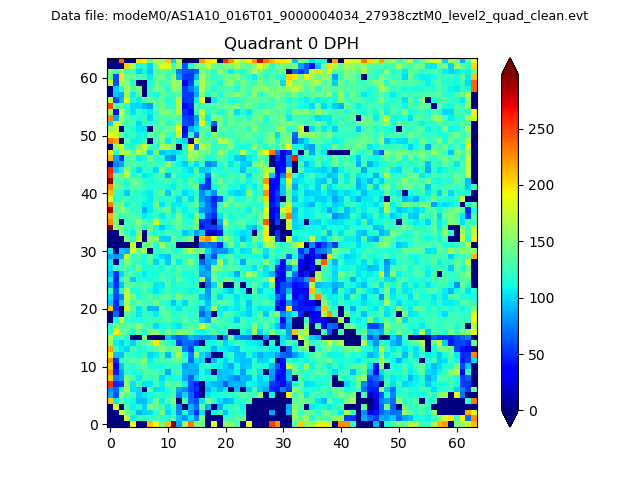 |
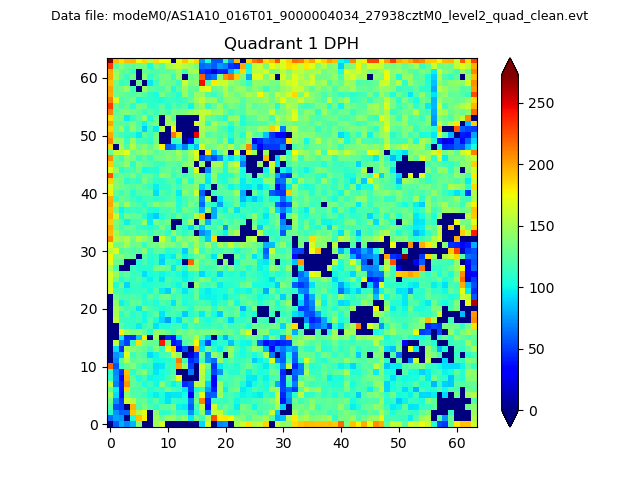 |
Quadrant B |
|---|---|---|---|
| Quadrant D | 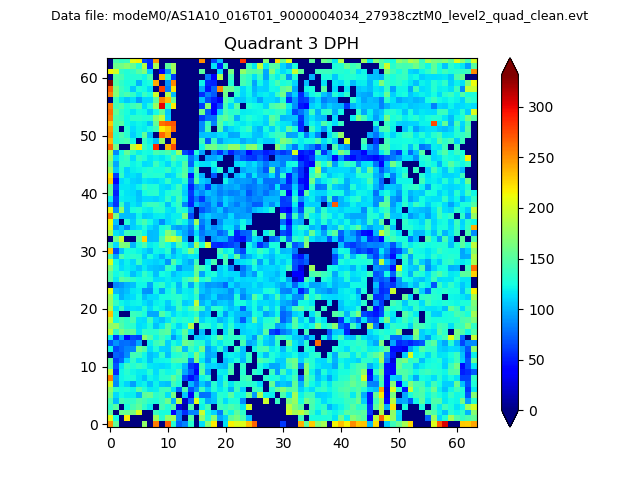 |
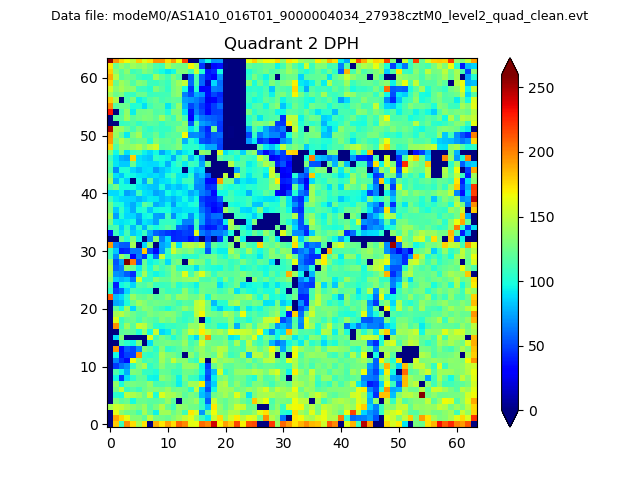 |
Quadrant C |
| Plot type | Count rate plots | Images |
|---|---|---|
| Comparison with Poisson distribution Blue bars denote a histogram of data divided into 1 sec bins. Red curve is a Poisson curve with rate = median count rate of data. |
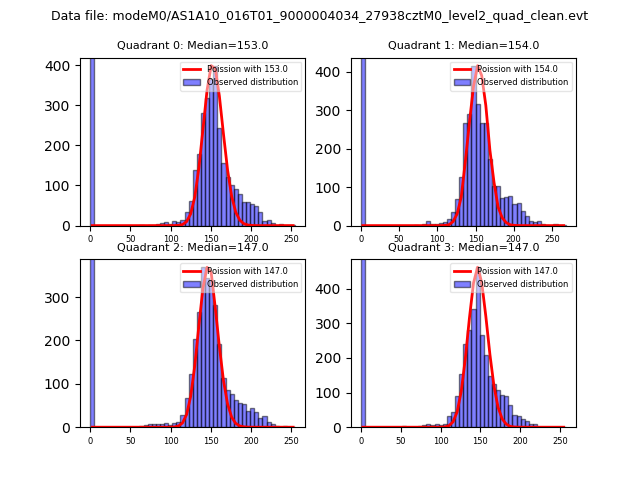 |
 |
| Quadrant-wise count rates Data is divided into 100 sec bins |
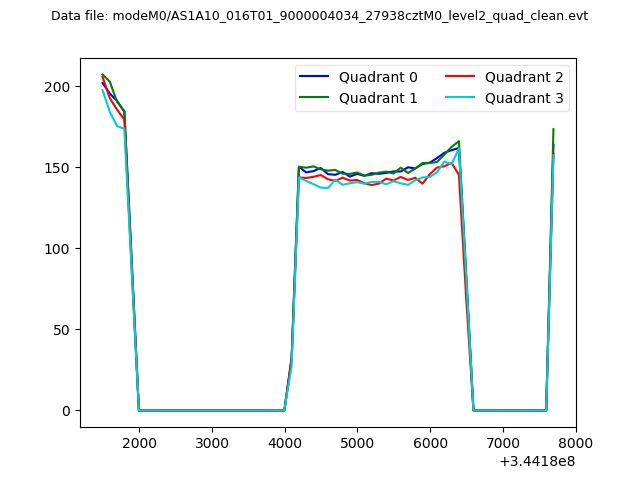 |
|
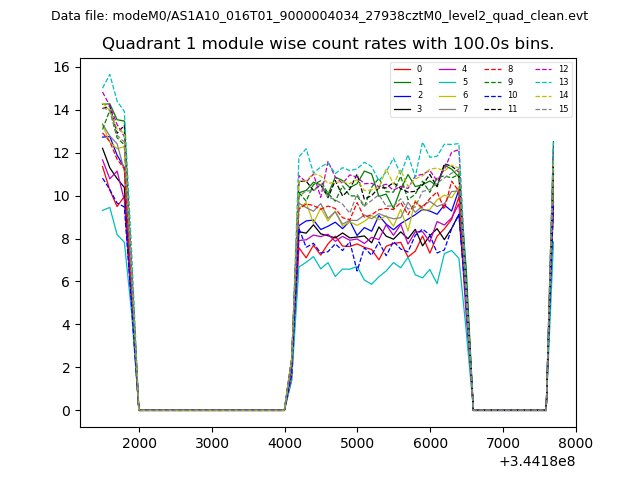
| Module-wise count rates for Quadrant A Data is divided into 100 sec bins |
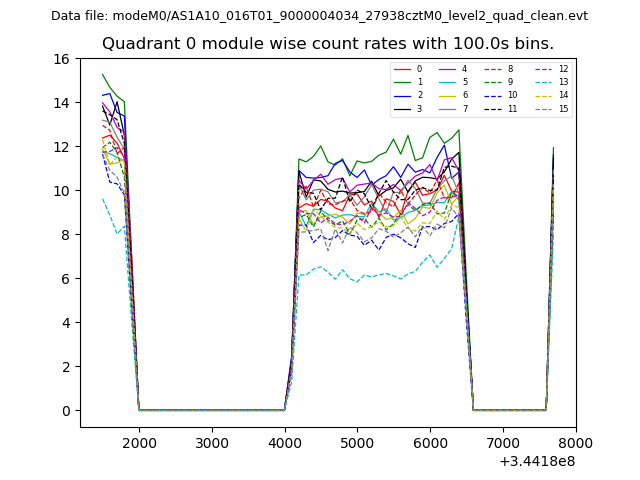 |
 |
| Module-wise count rates for Quadrant B Data is divided into 100 sec bins |
 |
 |
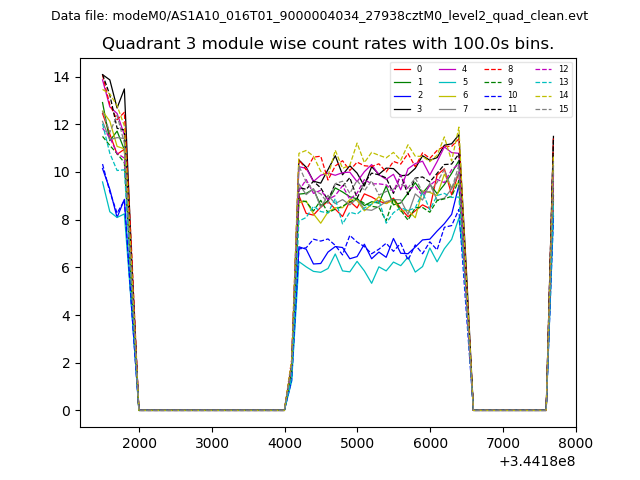
| Module-wise count rates for Quadrant C Data is divided into 100 sec bins |
 |
 |
| Module-wise count rates for Quadrant D Data is divided into 100 sec bins |
 |
 |
| Parameter | Plot |
|---|---|
| CZT HV Monitor | 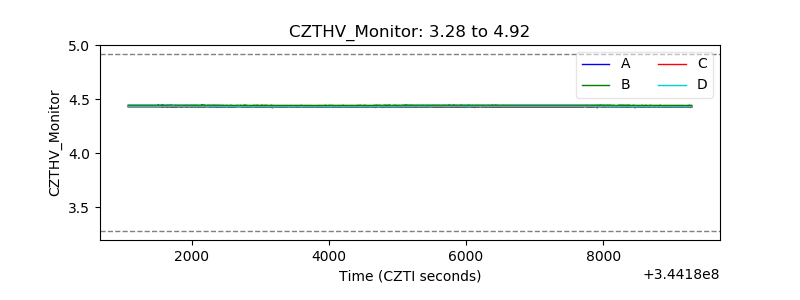 |
| D_VDD | 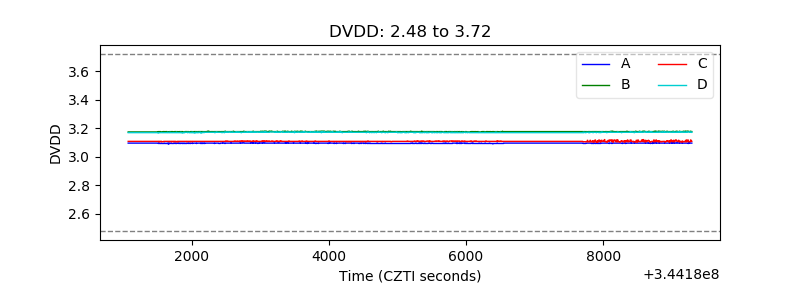 |
| Temperature 1 | 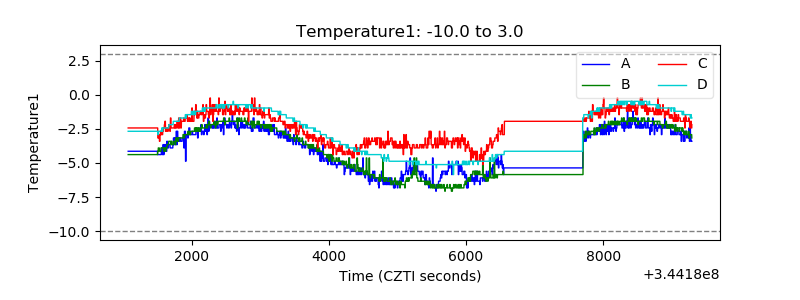 |
| Veto HV Monitor | 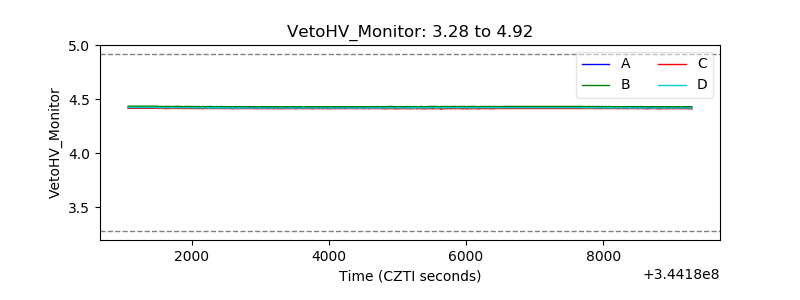 |
| Veto LLD | 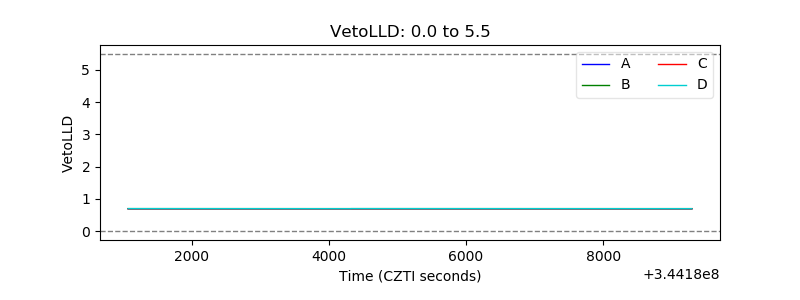 |
| Alpha Counter |  |
| _CPM_Rate | 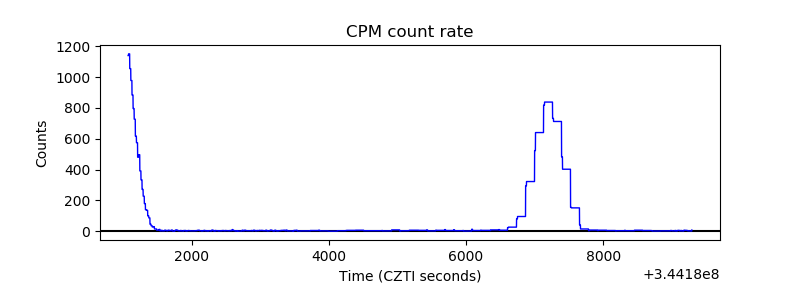 |
| CZT Counter | 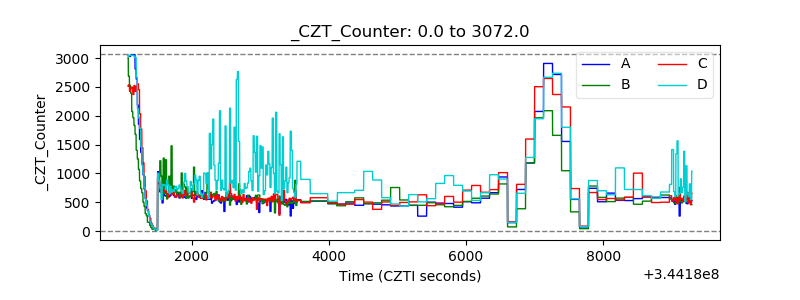 |
| +2.5 Volts monitor |  |
| +5 Volts monitor |  |
| _ROLL_ROT | 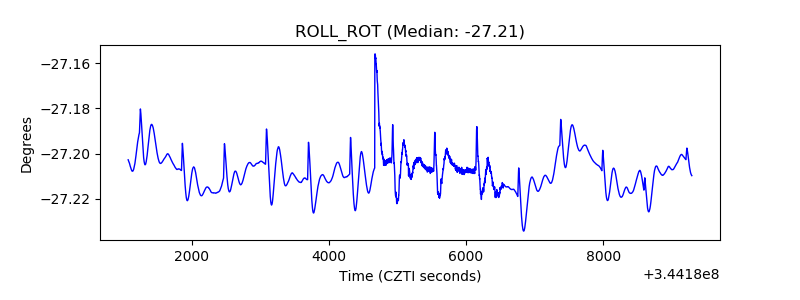 |
| _Roll_DEC | 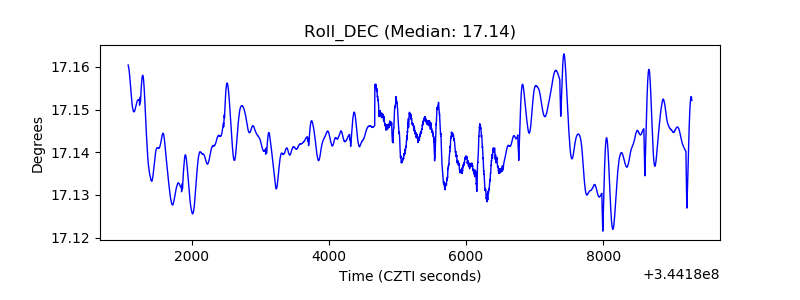 |
| _Roll_RA | 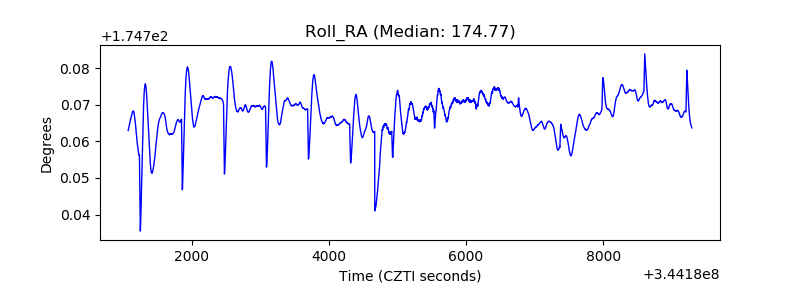 |
| Veto Counter | 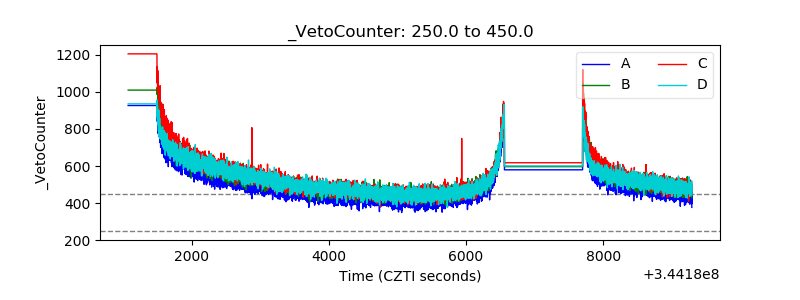 |