| Param | Original file | Final file |
|---|---|---|
| Filename | modeM0/AS1A10_016T01_9000004034_27939cztM0_level2.evt | modeM0/AS1A10_016T01_9000004034_27939cztM0_level2_quad_clean.evt |
| Size (bytes) | 523,100,160 | 71,236,800 |
| Size | 498.9 MB | 67.9 MB |
| Events in quadrant A | 3,386,406 | 432,094 |
| Events in quadrant B | 3,449,734 | 434,329 |
| Events in quadrant C | 3,775,087 | 416,562 |
| Events in quadrant D | 4,779,782 | 410,101 |
| Mode M0 | |||
|---|---|---|---|
| Quadrant | BADHDUFLAG | Total packets | Discarded packets |
| A | 0 | 13888 | 0 |
| B | 0 | 14075 | 0 |
| C | 0 | 15176 | 0 |
| D | 0 | 18911 | 0 |
| Mode M9 | |||
|---|---|---|---|
| Quadrant | BADHDUFLAG | Total packets | Discarded packets |
| A | 0 | 9 | 0 |
| B | 0 | 9 | 0 |
| C | 0 | 9 | 0 |
| D | 0 | 9 | 0 |
| Quadrant | Total seconds | Saturated seconds | Saturation percentage |
|---|---|---|---|
| A | 6648 | 69 | 1.037906% |
| B | 6648 | 78 | 1.173285% |
| C | 6649 | 169 | 2.541736% |
| D | 6649 | 193 | 2.902692% |
Noise dominated data is calculated using 1-second bins in cleaned event files. If a bin has >2000 counts, and if more than 50% of those come from <1% of pixels, then it is considered to be noise-dominated and hence unusable.
| Quadrant | # 1 sec bins | Bins with >0 counts | Bins with >2000 counts | High rate bins dominated by noise | Noise dominated (total time) | Noise dominated (detector-on time) | Marked lightcurve |
|---|---|---|---|---|---|---|---|
| A | 7543 | 6648 | 1 | 1 | 0.01% | 0.02% | 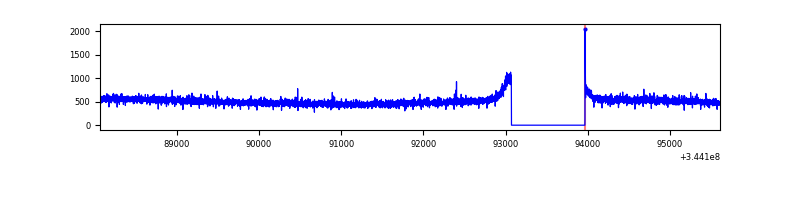 |
| B | 7543 | 6648 | 1 | 1 | 0.01% | 0.02% | 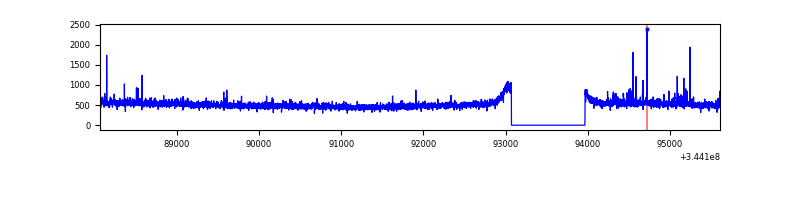 |
| C | 7544 | 6649 | 23 | 23 | 0.30% | 0.35% | 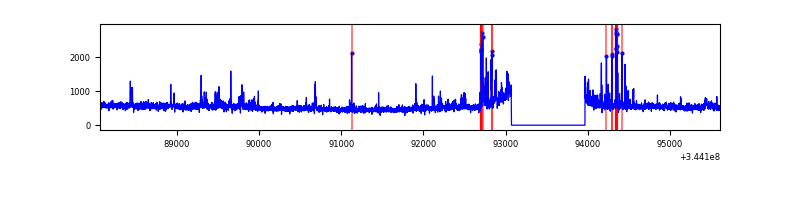 |
| D | 7544 | 6649 | 118 | 118 | 1.56% | 1.77% | 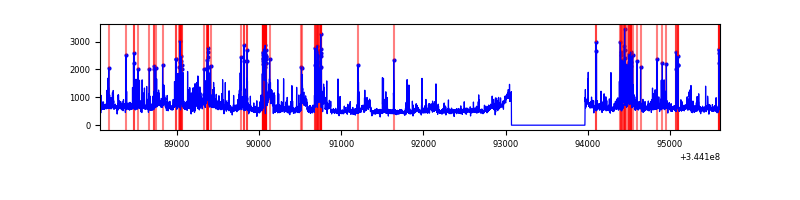 |
Top three noisy pixels from each quadrant. If the there are fewer than three noisy pixels in the level2.evt file, extra rows are filled as -1
| Pixel properties | Quadrant properties | ||||||
|---|---|---|---|---|---|---|---|
| Quadrant | DetID | PixID | Counts | Sigma | Mean | Median | Sigma |
| A | 13 | 254 | 10260 | 53.16 | 875 | 859 | 176.9 |
| A | 3 | 137 | 8170 | 41.34 | 875 | 859 | 176.9 |
| A | 0 | 226 | 7457 | 37.31 | 875 | 859 | 176.9 |
| B | 0 | 230 | 33476 | 199.05 | 862 | 842 | 163.9 |
| B | 12 | 111 | 19831 | 115.82 | 862 | 842 | 163.9 |
| B | 10 | 245 | 19242 | 112.23 | 862 | 842 | 163.9 |
| C | 2 | 16 | 228817 | 1160.13 | 836 | 845 | 196.5 |
| C | 14 | 238 | 133186 | 673.47 | 836 | 845 | 196.5 |
| C | 3 | 233 | 89427 | 450.79 | 836 | 845 | 196.5 |
| D | 8 | 195 | 492759 | 2440.16 | 845 | 821 | 201.6 |
| D | 1 | 52 | 406362 | 2011.6 | 845 | 821 | 201.6 |
| D | 2 | 250 | 296153 | 1464.93 | 845 | 821 | 201.6 |
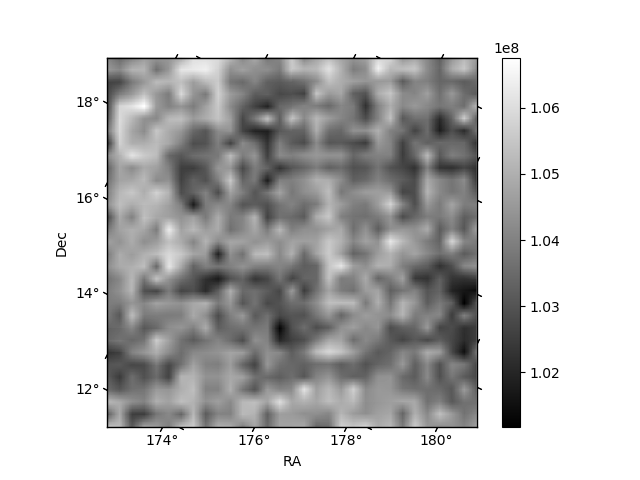
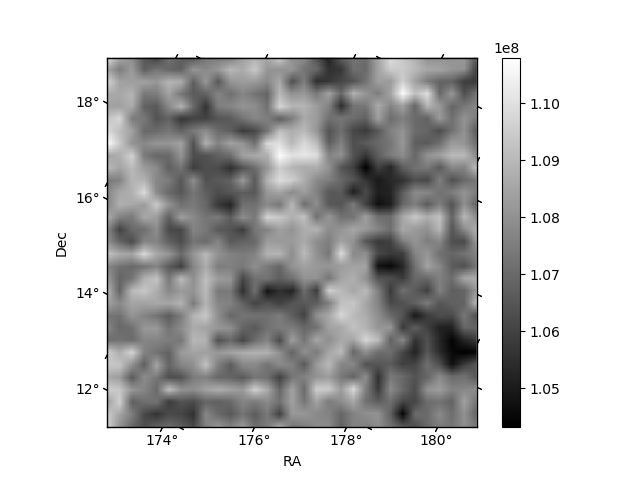
Histogram calculated using DETX and DETY for each event in the final _common_clean file
| Quadrant A | 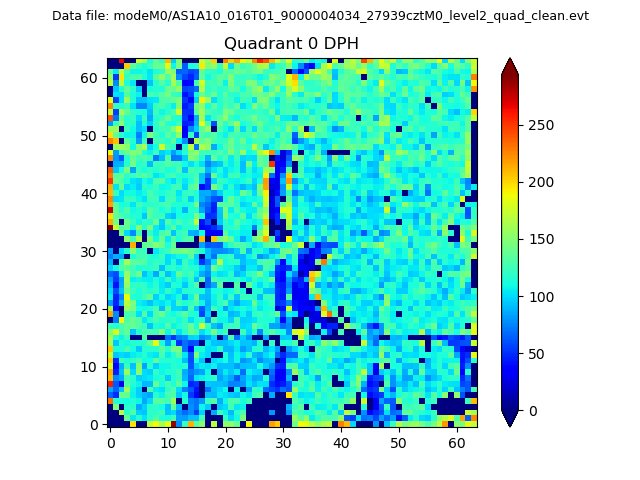 |
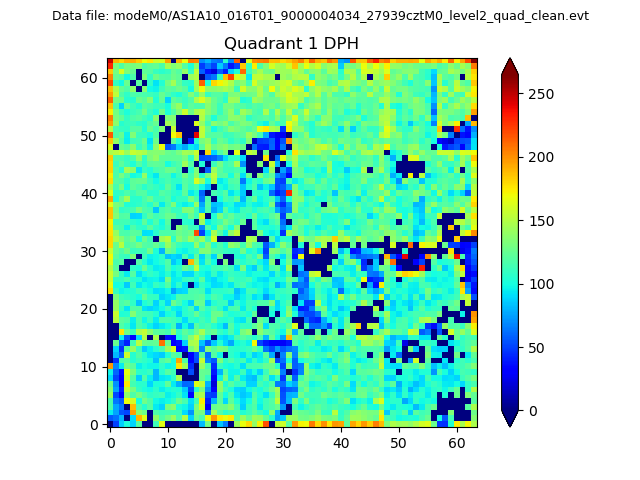 |
Quadrant B |
|---|---|---|---|
| Quadrant D | 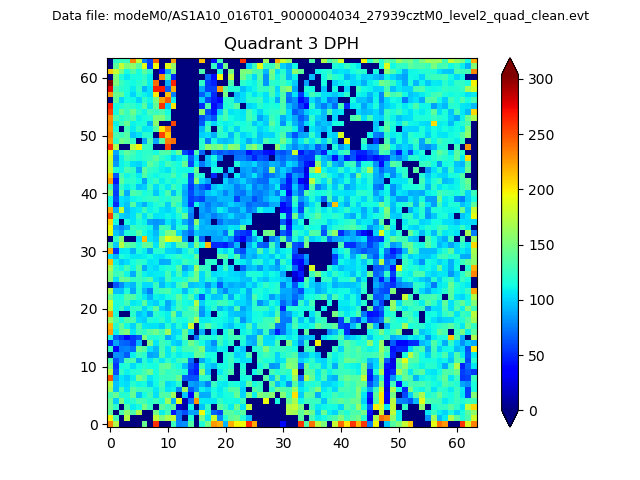 |
 |
Quadrant C |
| Plot type | Count rate plots | Images |
|---|---|---|
| Comparison with Poisson distribution Blue bars denote a histogram of data divided into 1 sec bins. Red curve is a Poisson curve with rate = median count rate of data. |
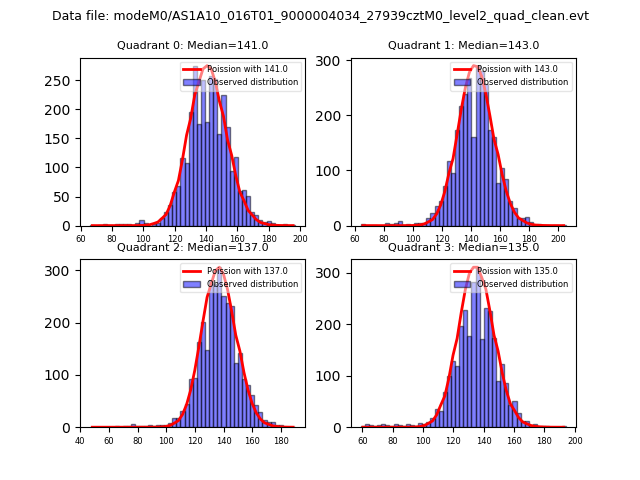 |
 |
| Quadrant-wise count rates Data is divided into 100 sec bins |
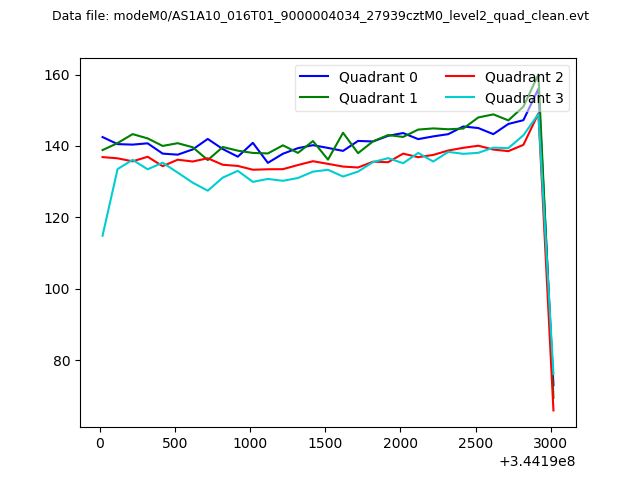 |
|
| Module-wise count rates for Quadrant A Data is divided into 100 sec bins |
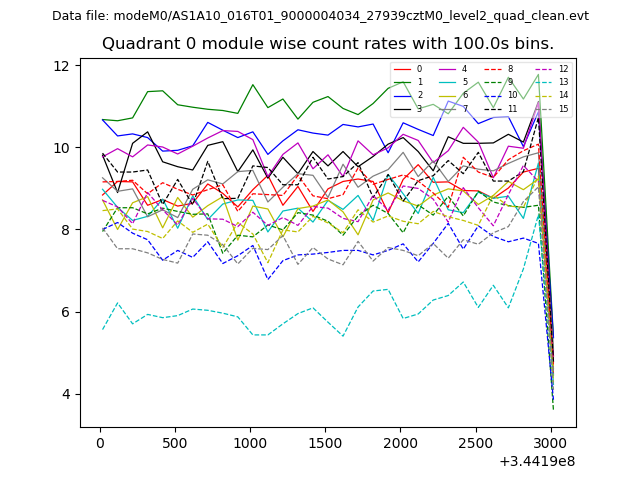 |
 |
| Module-wise count rates for Quadrant B Data is divided into 100 sec bins |
 |
 |
| Module-wise count rates for Quadrant C Data is divided into 100 sec bins |
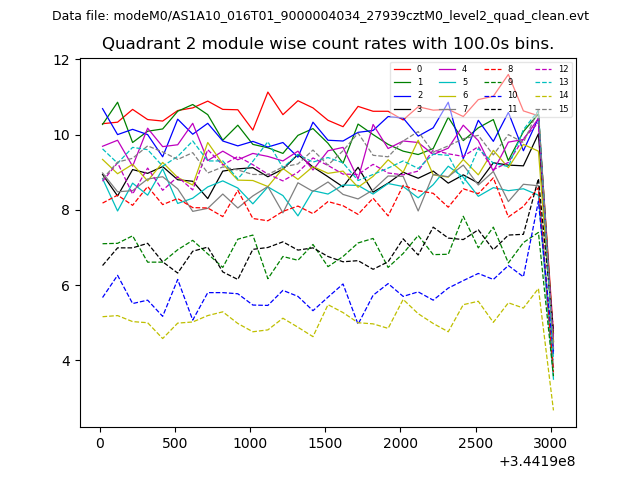 |
 |
| Module-wise count rates for Quadrant D Data is divided into 100 sec bins |
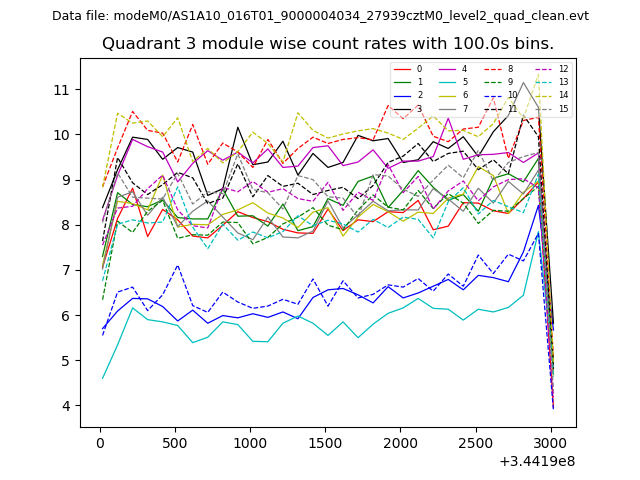 |
 |
| Parameter | Plot |
|---|---|
| CZT HV Monitor | 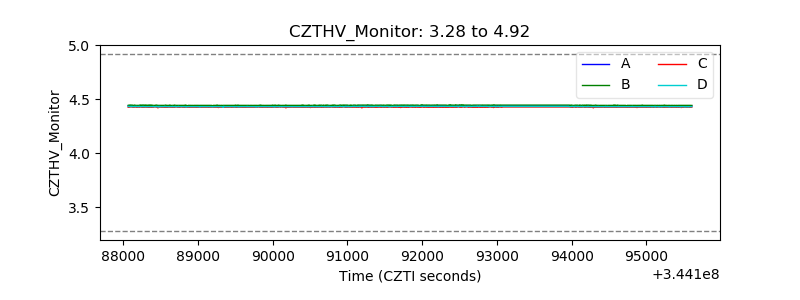 |
| D_VDD | 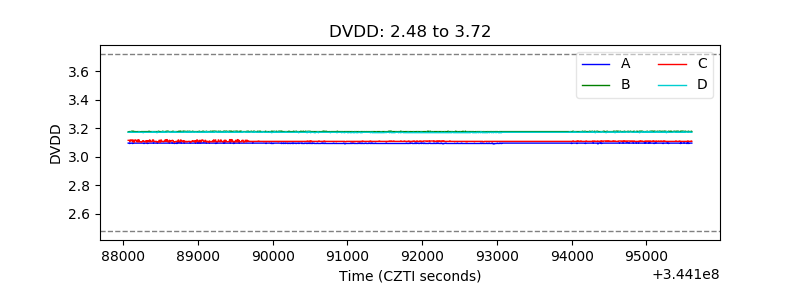 |
| Temperature 1 | 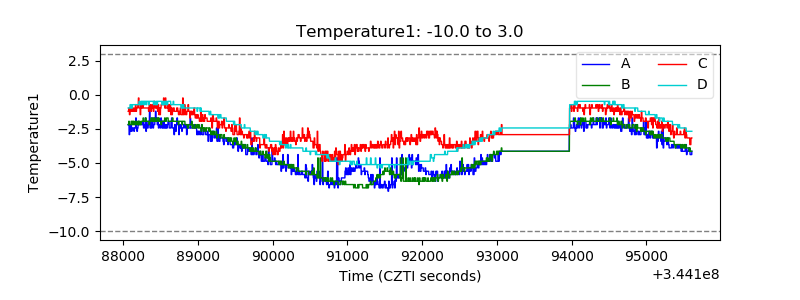 |
| Veto HV Monitor | 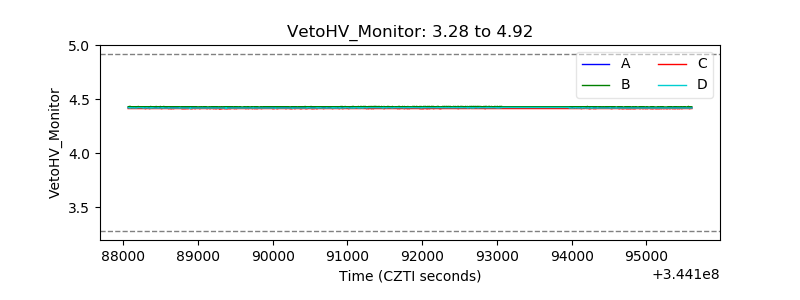 |
| Veto LLD | 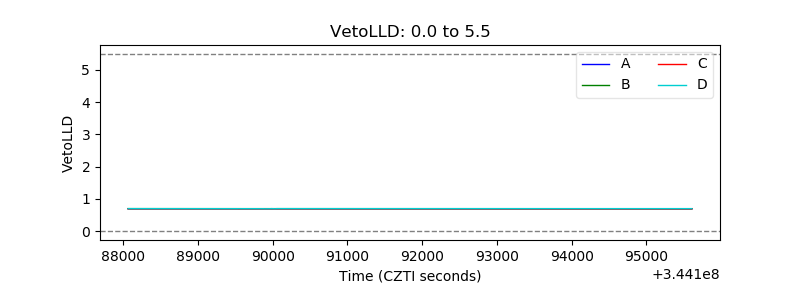 |
| Alpha Counter |  |
| _CPM_Rate | 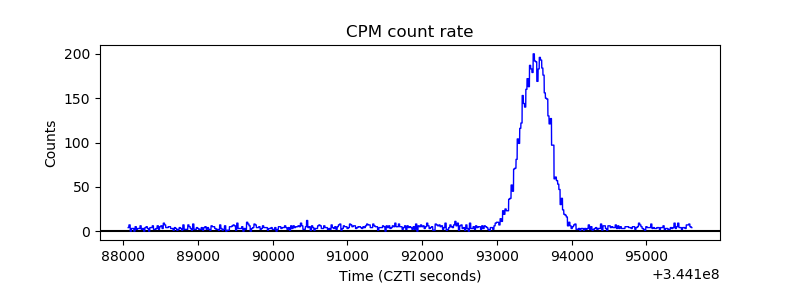 |
| CZT Counter |  |
| +2.5 Volts monitor | 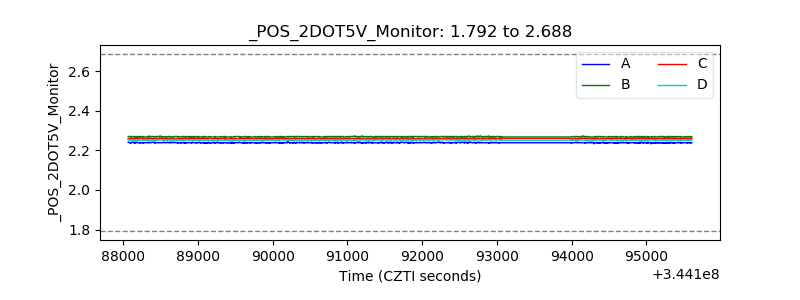 |
| +5 Volts monitor |  |
| _ROLL_ROT | 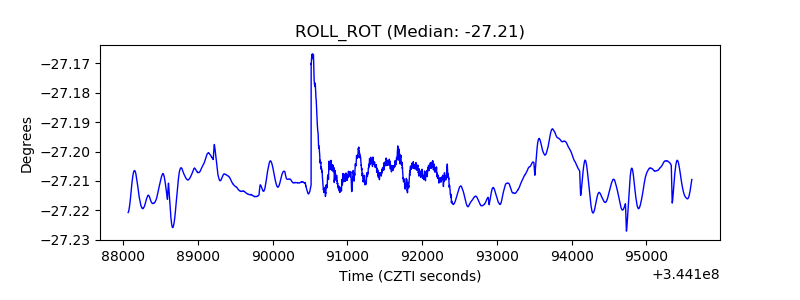 |
| _Roll_DEC | 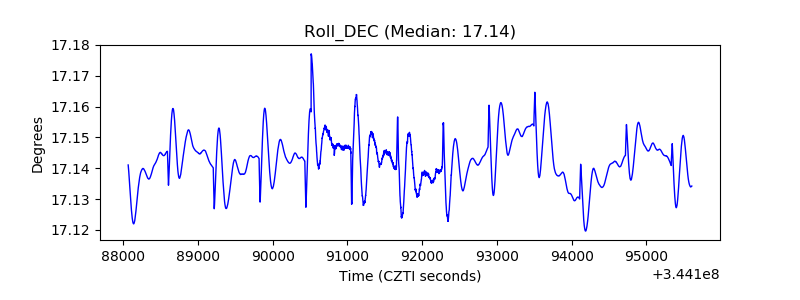 |
| _Roll_RA | 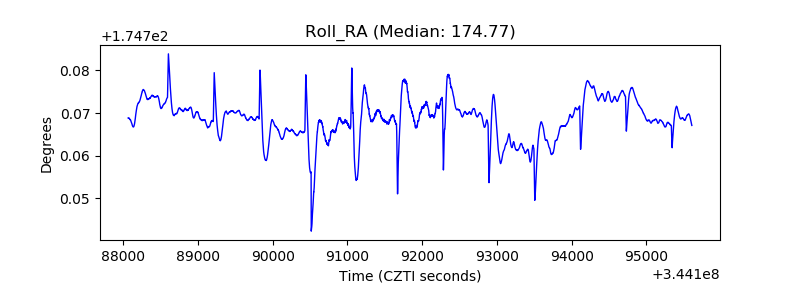 |
| Veto Counter | 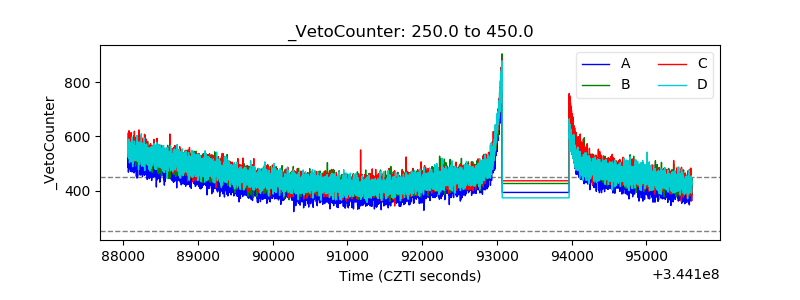 |