| Param | Original file | Final file |
|---|---|---|
| Filename | modeM0/AS1A10_016T01_9000004034_27940cztM0_level2.evt | modeM0/AS1A10_016T01_9000004034_27940cztM0_level2_quad_clean.evt |
| Size (bytes) | 543,349,440 | 78,788,160 |
| Size | 518.2 MB | 75.1 MB |
| Events in quadrant A | 3,435,829 | 485,788 |
| Events in quadrant B | 3,629,035 | 489,482 |
| Events in quadrant C | 4,228,072 | 462,857 |
| Events in quadrant D | 4,692,897 | 465,132 |
| Mode M0 | |||
|---|---|---|---|
| Quadrant | BADHDUFLAG | Total packets | Discarded packets |
| A | 0 | 14411 | 0 |
| B | 0 | 15008 | 0 |
| C | 0 | 16684 | 0 |
| D | 0 | 18840 | 0 |
| Mode M9 | |||
|---|---|---|---|
| Quadrant | BADHDUFLAG | Total packets | Discarded packets |
| A | 0 | 4 | 0 |
| B | 0 | 4 | 0 |
| C | 0 | 4 | 0 |
| D | 0 | 4 | 0 |
| Quadrant | Total seconds | Saturated seconds | Saturation percentage |
|---|---|---|---|
| A | 6925 | 92 | 1.328520% |
| B | 6926 | 152 | 2.194629% |
| C | 6926 | 336 | 4.851285% |
| D | 6926 | 250 | 3.609587% |
Noise dominated data is calculated using 1-second bins in cleaned event files. If a bin has >2000 counts, and if more than 50% of those come from <1% of pixels, then it is considered to be noise-dominated and hence unusable.
| Quadrant | # 1 sec bins | Bins with >0 counts | Bins with >2000 counts | High rate bins dominated by noise | Noise dominated (total time) | Noise dominated (detector-on time) | Marked lightcurve |
|---|---|---|---|---|---|---|---|
| A | 7330 | 6926 | 0 | 0 | 0.00% | 0.00% | 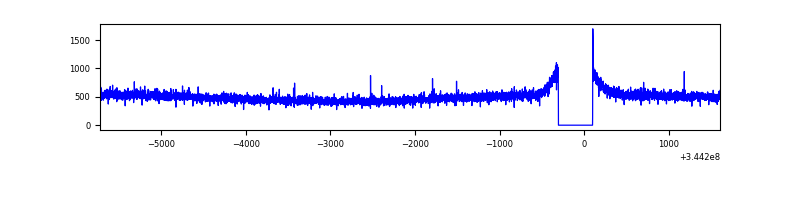 |
| B | 7331 | 6926 | 8 | 8 | 0.11% | 0.12% | 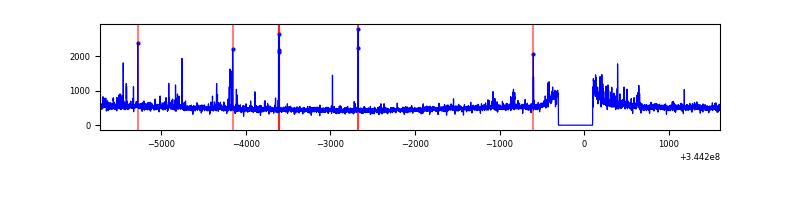 |
| C | 7331 | 6927 | 172 | 172 | 2.35% | 2.48% | 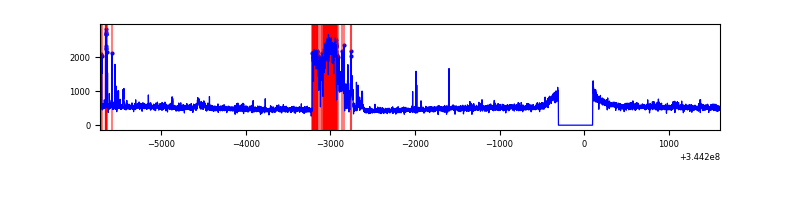 |
| D | 7331 | 6927 | 126 | 126 | 1.72% | 1.82% | 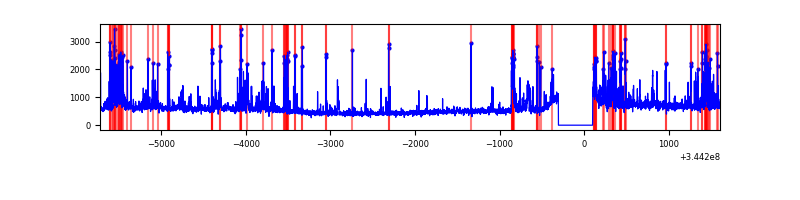 |
Top three noisy pixels from each quadrant. If the there are fewer than three noisy pixels in the level2.evt file, extra rows are filled as -1
| Pixel properties | Quadrant properties | ||||||
|---|---|---|---|---|---|---|---|
| Quadrant | DetID | PixID | Counts | Sigma | Mean | Median | Sigma |
| A | 13 | 254 | 11538 | 59.49 | 889 | 872 | 179.3 |
| A | 3 | 137 | 8570 | 42.93 | 889 | 872 | 179.3 |
| A | 0 | 226 | 7515 | 37.05 | 889 | 872 | 179.3 |
| B | 0 | 230 | 66164 | 386.53 | 878 | 857 | 169.0 |
| B | 10 | 245 | 39217 | 227.04 | 878 | 857 | 169.0 |
| B | 0 | 229 | 23217 | 132.34 | 878 | 857 | 169.0 |
| C | 2 | 16 | 707622 | 3586.8 | 844 | 850 | 197.0 |
| C | 14 | 238 | 134949 | 680.54 | 844 | 850 | 197.0 |
| C | 3 | 233 | 85677 | 430.49 | 844 | 850 | 197.0 |
| D | 8 | 195 | 506248 | 2441.46 | 856 | 832 | 207.0 |
| D | 2 | 250 | 367584 | 1771.63 | 856 | 832 | 207.0 |
| D | 7 | 80 | 290741 | 1400.43 | 856 | 832 | 207.0 |
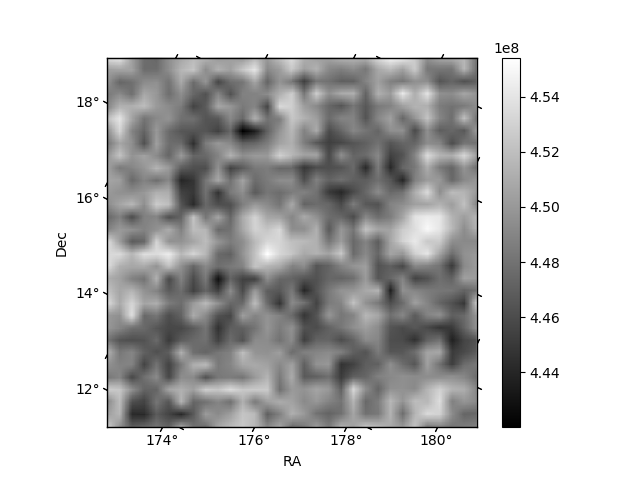
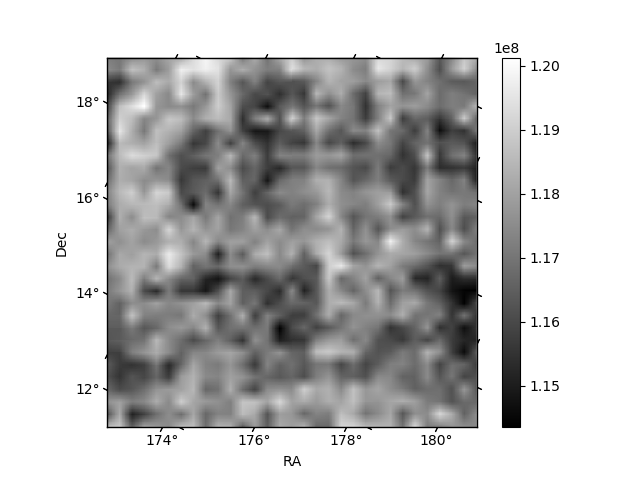
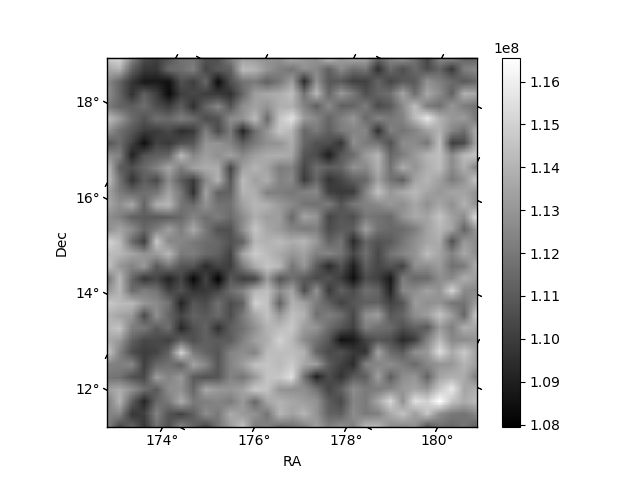
Histogram calculated using DETX and DETY for each event in the final _common_clean file
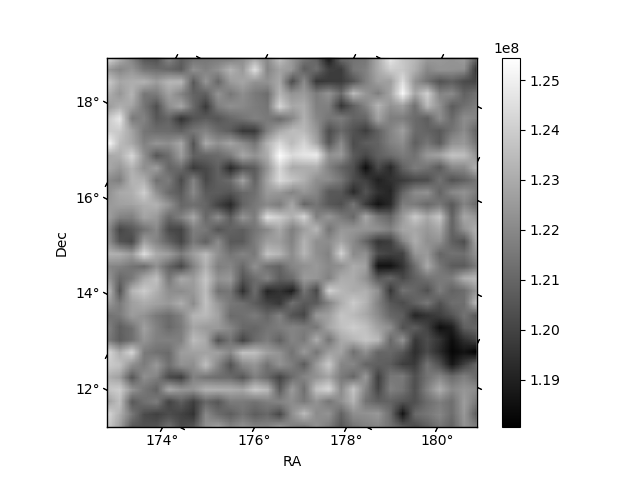
| Quadrant A | 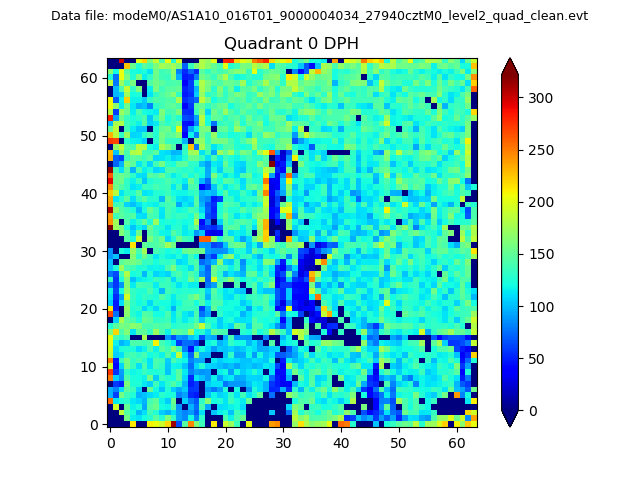 |
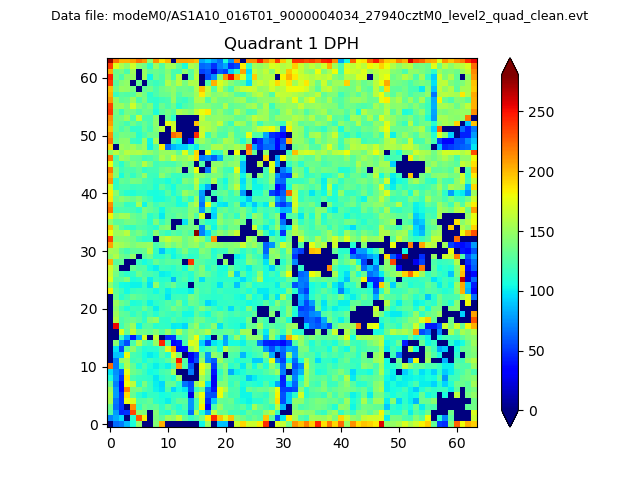 |
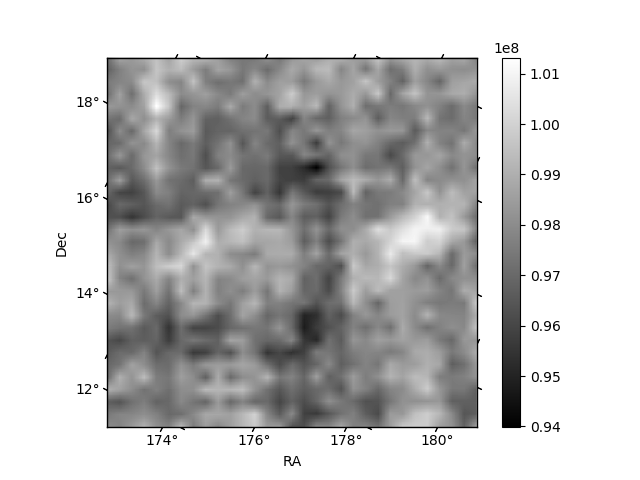
Quadrant B |
|---|---|---|---|
| Quadrant D | 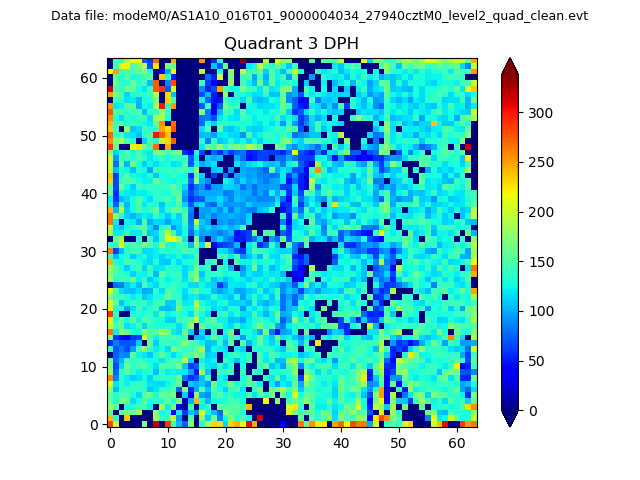 |
 |
Quadrant C |
| Plot type | Count rate plots | Images |
|---|---|---|
| Comparison with Poisson distribution Blue bars denote a histogram of data divided into 1 sec bins. Red curve is a Poisson curve with rate = median count rate of data. |
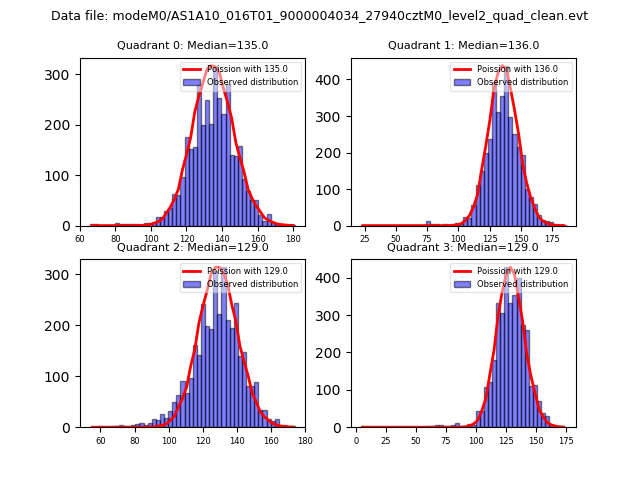 |
 |
| Quadrant-wise count rates Data is divided into 100 sec bins |
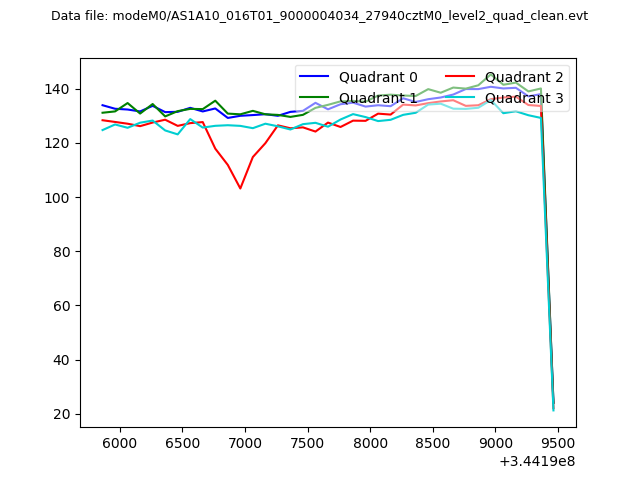 |
|
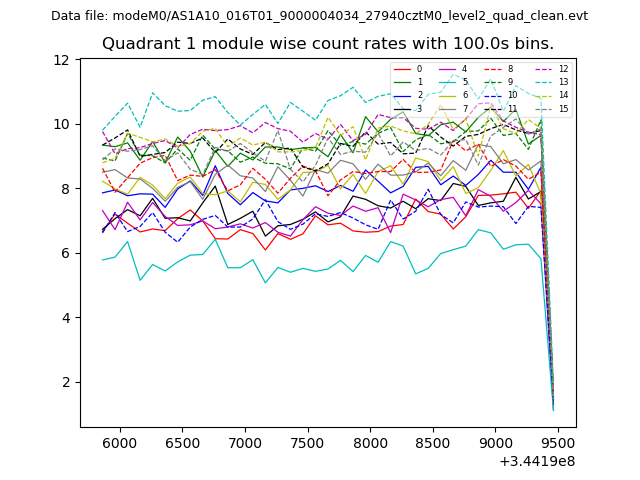
| Module-wise count rates for Quadrant A Data is divided into 100 sec bins |
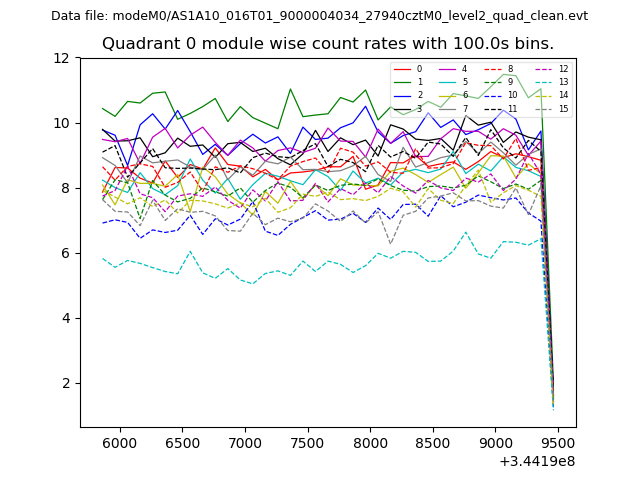 |
 |
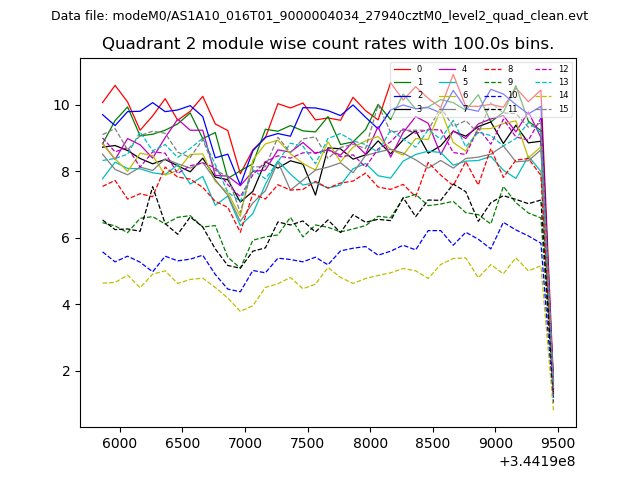
| Module-wise count rates for Quadrant B Data is divided into 100 sec bins |
 |
 |
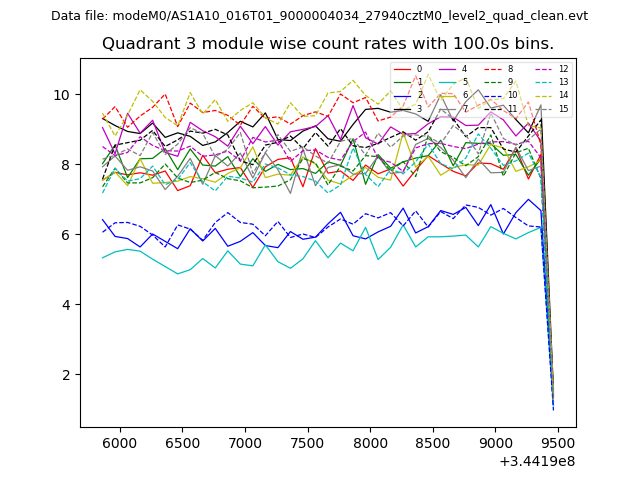
| Module-wise count rates for Quadrant C Data is divided into 100 sec bins |
 |
 |
| Module-wise count rates for Quadrant D Data is divided into 100 sec bins |
 |
 |
| Parameter | Plot |
|---|---|
| CZT HV Monitor | 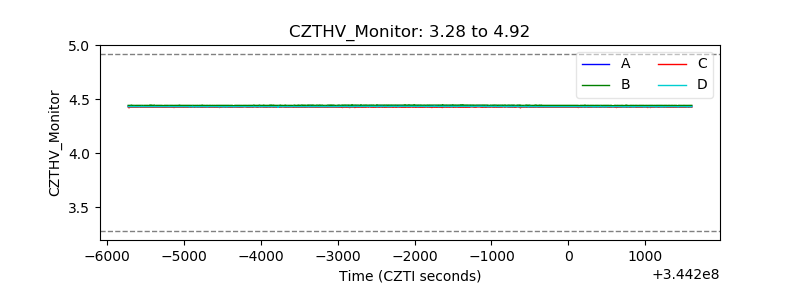 |
| D_VDD | 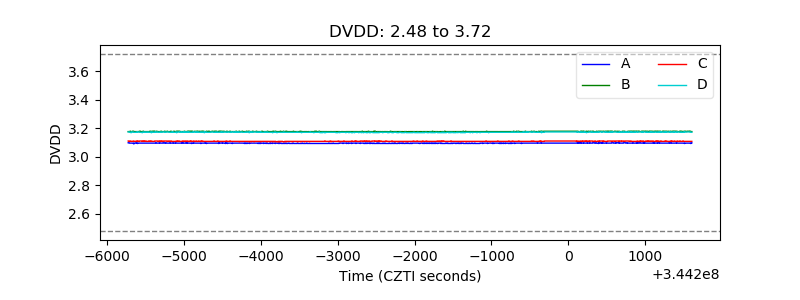 |
| Temperature 1 | 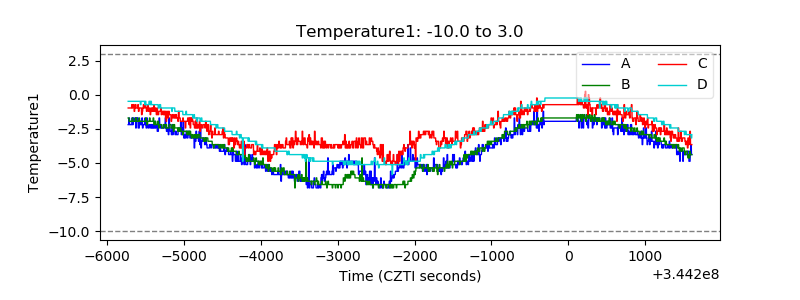 |
| Veto HV Monitor |  |
| Veto LLD | 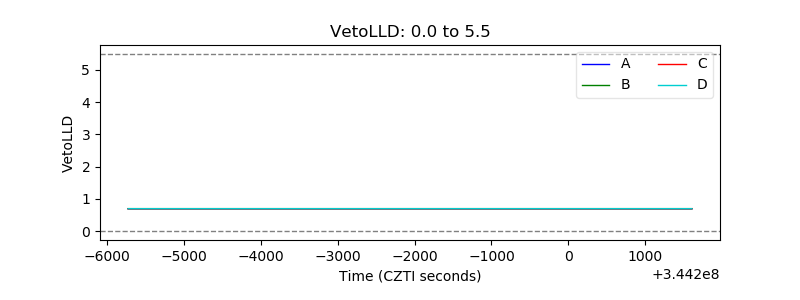 |
| Alpha Counter |  |
| _CPM_Rate | 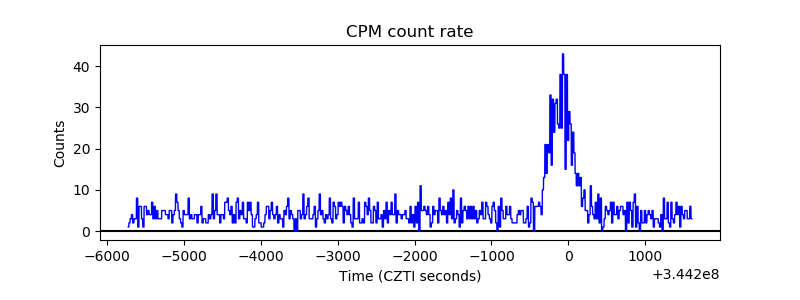 |
| CZT Counter |  |
| +2.5 Volts monitor | 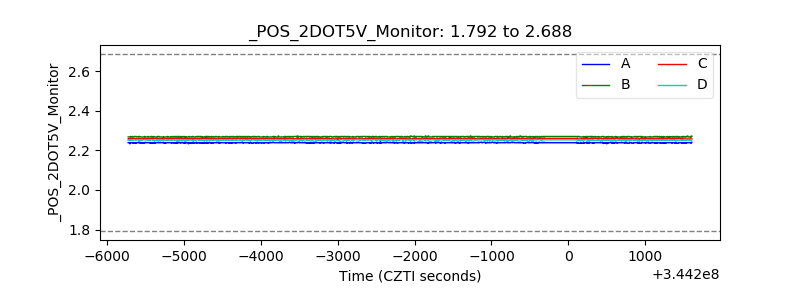 |
| +5 Volts monitor |  |
| _ROLL_ROT | 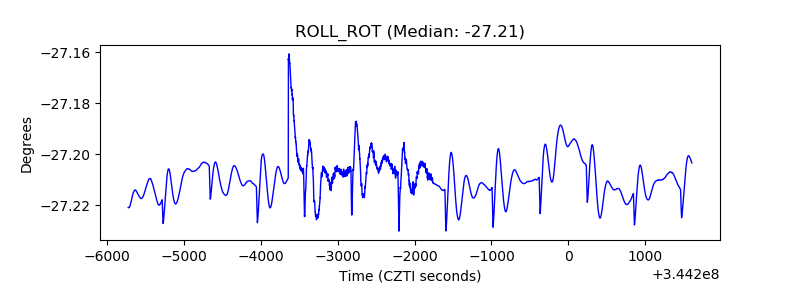 |
| _Roll_DEC | 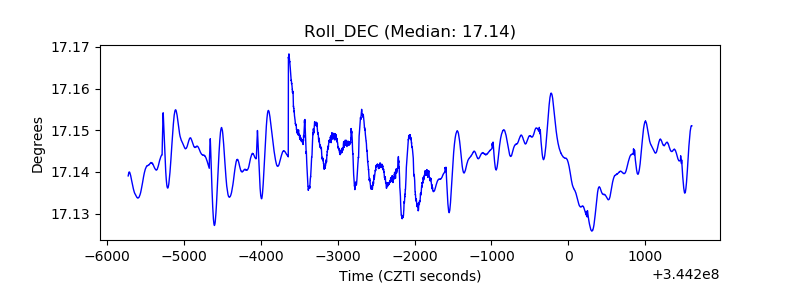 |
| _Roll_RA |  |
| Veto Counter | 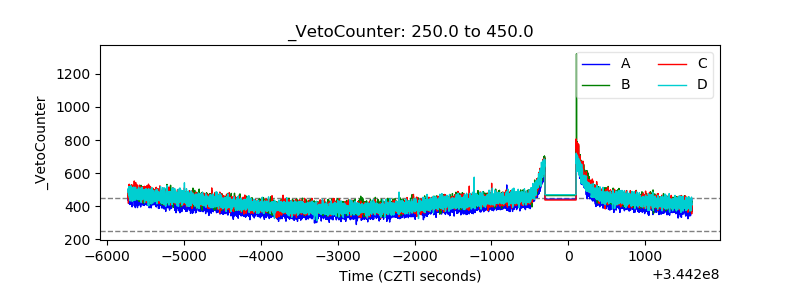 |