| Param | Original file | Final file |
|---|---|---|
| Filename | modeM0/AS1A10_016T01_9000004034_27941cztM0_level2.evt | modeM0/AS1A10_016T01_9000004034_27941cztM0_level2_quad_clean.evt |
| Size (bytes) | 649,823,040 | 86,120,640 |
| Size | 619.7 MB | 82.1 MB |
| Events in quadrant A | 3,947,497 | 529,979 |
| Events in quadrant B | 4,178,036 | 529,818 |
| Events in quadrant C | 4,090,745 | 511,387 |
| Events in quadrant D | 6,929,990 | 489,114 |
| Mode M0 | |||
|---|---|---|---|
| Quadrant | BADHDUFLAG | Total packets | Discarded packets |
| A | 0 | 16655 | 0 |
| B | 0 | 17383 | 0 |
| C | 0 | 16988 | 0 |
| D | 0 | 26109 | 0 |
| Mode M9 | |||
|---|---|---|---|
| Quadrant | BADHDUFLAG | Total packets | Discarded packets |
| A | 0 | 5 | 0 |
| B | 0 | 5 | 0 |
| C | 0 | 5 | 0 |
| D | 0 | 5 | 0 |
| Quadrant | Total seconds | Saturated seconds | Saturation percentage |
|---|---|---|---|
| A | 7881 | 189 | 2.398173% |
| B | 7880 | 276 | 3.502538% |
| C | 7881 | 304 | 3.857379% |
| D | 7880 | 944 | 11.979695% |
Noise dominated data is calculated using 1-second bins in cleaned event files. If a bin has >2000 counts, and if more than 50% of those come from <1% of pixels, then it is considered to be noise-dominated and hence unusable.
| Quadrant | # 1 sec bins | Bins with >0 counts | Bins with >2000 counts | High rate bins dominated by noise | Noise dominated (total time) | Noise dominated (detector-on time) | Marked lightcurve |
|---|---|---|---|---|---|---|---|
| A | 8316 | 7883 | 0 | 0 | 0.00% | 0.00% | 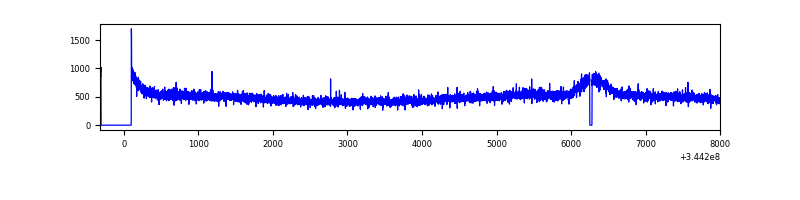 |
| B | 8316 | 7882 | 14 | 14 | 0.17% | 0.18% | 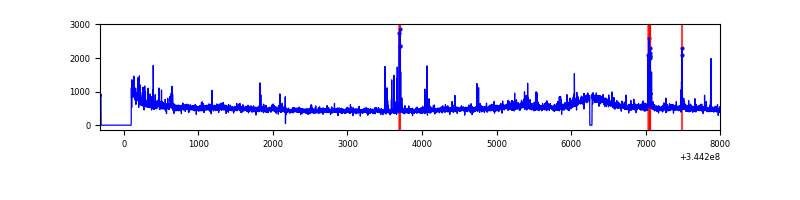 |
| C | 8316 | 7883 | 1 | 1 | 0.01% | 0.01% | 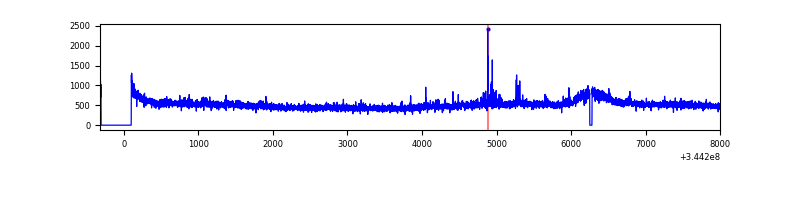 |
| D | 8316 | 7883 | 547 | 547 | 6.58% | 6.94% | 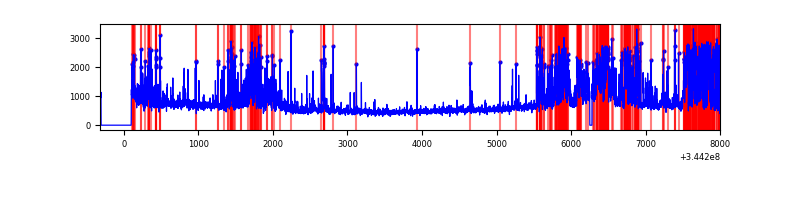 |
Top three noisy pixels from each quadrant. If the there are fewer than three noisy pixels in the level2.evt file, extra rows are filled as -1
| Pixel properties | Quadrant properties | ||||||
|---|---|---|---|---|---|---|---|
| Quadrant | DetID | PixID | Counts | Sigma | Mean | Median | Sigma |
| A | 13 | 254 | 12913 | 57.32 | 1021 | 999 | 207.9 |
| A | 3 | 137 | 10111 | 43.84 | 1021 | 999 | 207.9 |
| A | 0 | 226 | 8948 | 38.24 | 1021 | 999 | 207.9 |
| B | 10 | 245 | 67059 | 342.99 | 1006 | 982 | 192.6 |
| B | 0 | 230 | 53341 | 271.78 | 1006 | 982 | 192.6 |
| B | 15 | 32 | 39681 | 200.88 | 1006 | 982 | 192.6 |
| C | 14 | 238 | 155261 | 672.33 | 973 | 976 | 229.5 |
| C | 3 | 233 | 79205 | 340.9 | 973 | 976 | 229.5 |
| C | 2 | 16 | 60230 | 258.21 | 973 | 976 | 229.5 |
| D | 1 | 52 | 1907448 | 8354.31 | 947 | 919 | 228.2 |
| D | 8 | 195 | 777097 | 3401.17 | 947 | 919 | 228.2 |
| D | 2 | 250 | 457182 | 1999.32 | 947 | 919 | 228.2 |
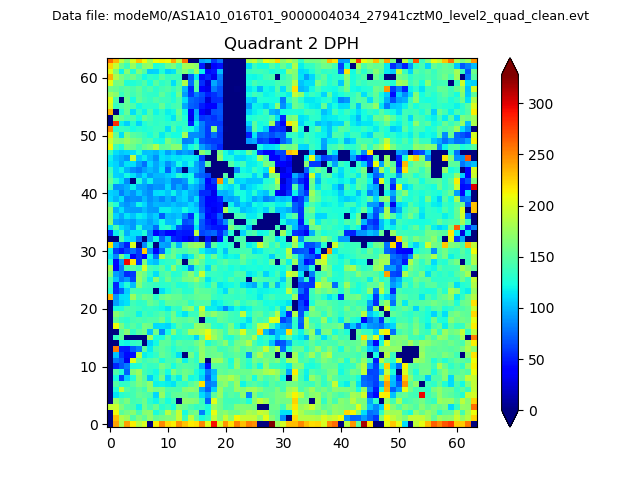
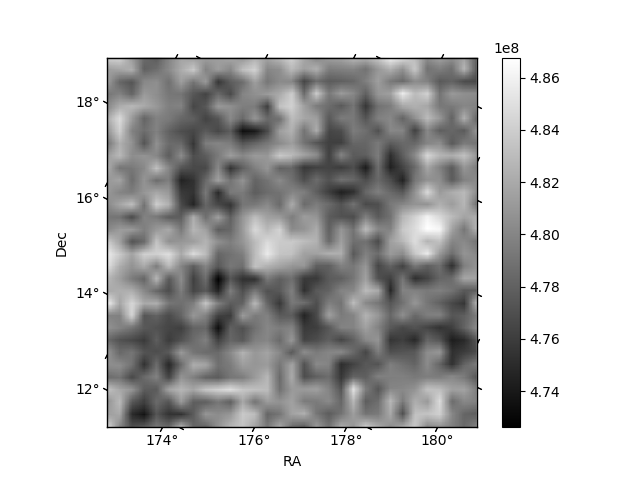
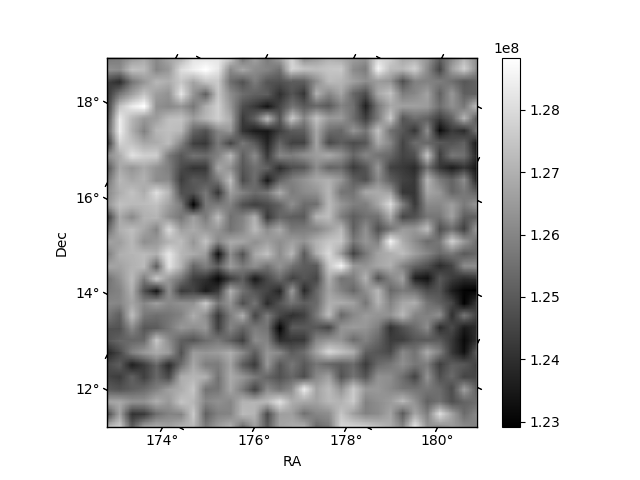
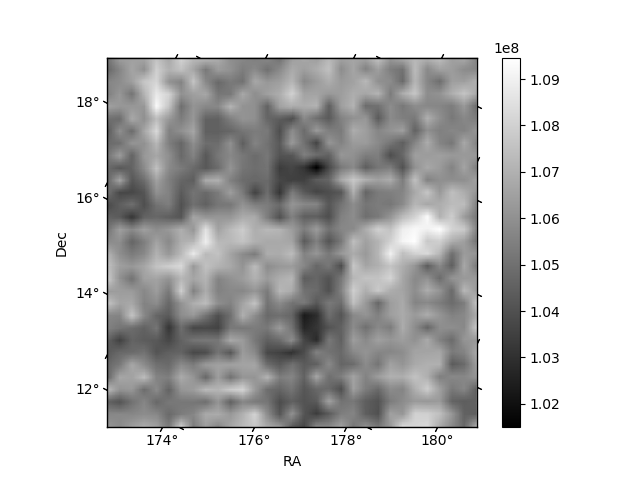
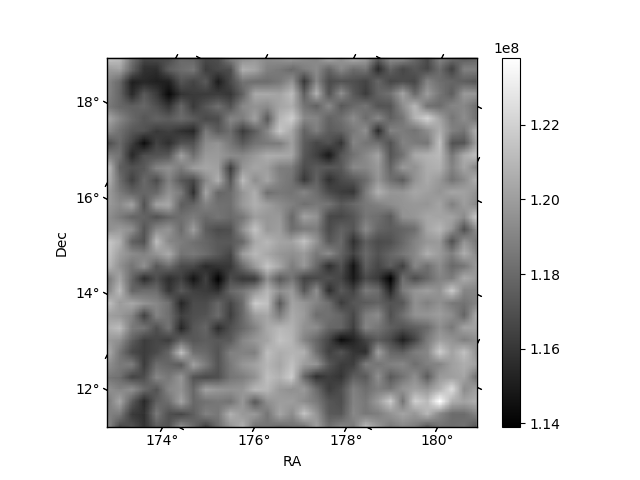
Histogram calculated using DETX and DETY for each event in the final _common_clean file
| Quadrant A | 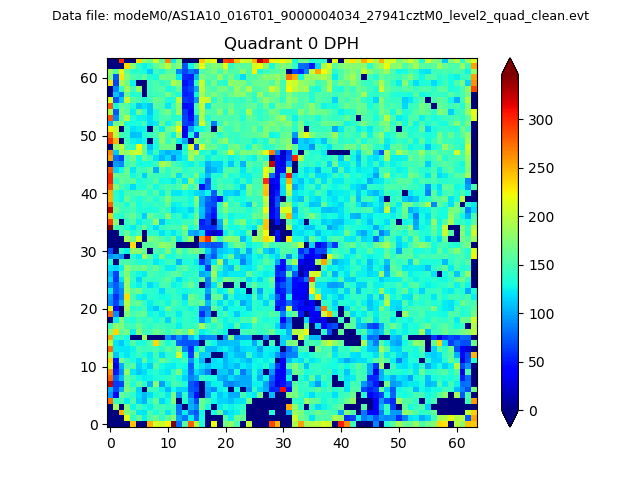 |
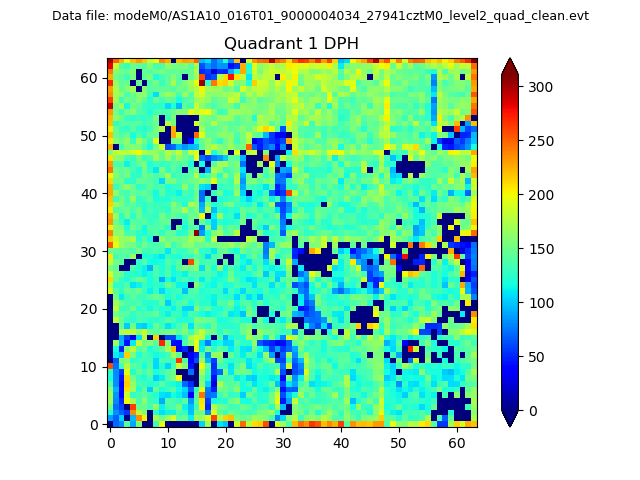 |
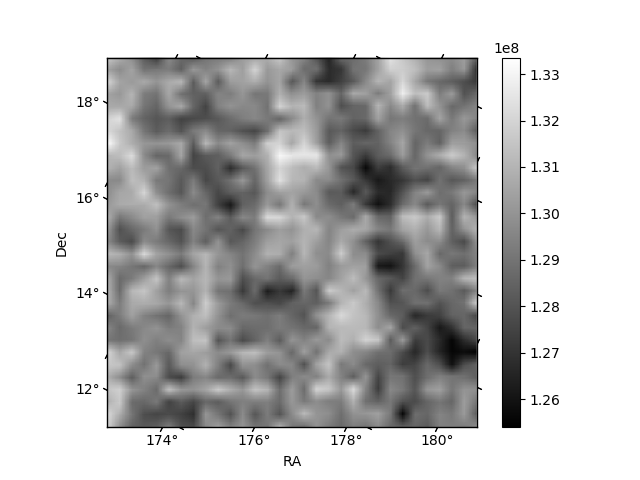
Quadrant B |
|---|---|---|---|
| Quadrant D | 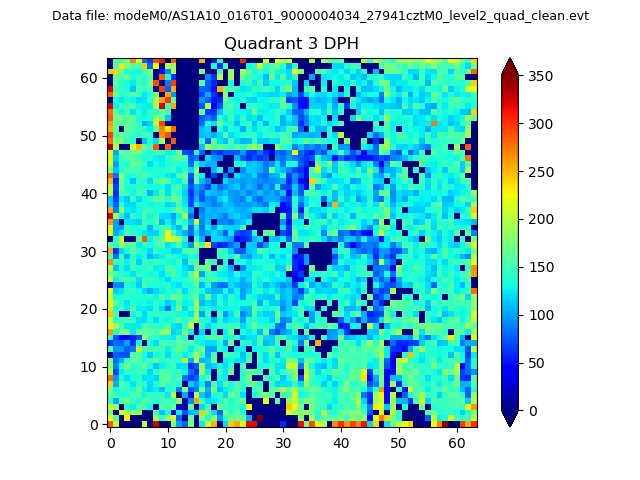 |
 |
Quadrant C |
| Plot type | Count rate plots | Images |
|---|---|---|
| Comparison with Poisson distribution Blue bars denote a histogram of data divided into 1 sec bins. Red curve is a Poisson curve with rate = median count rate of data. |
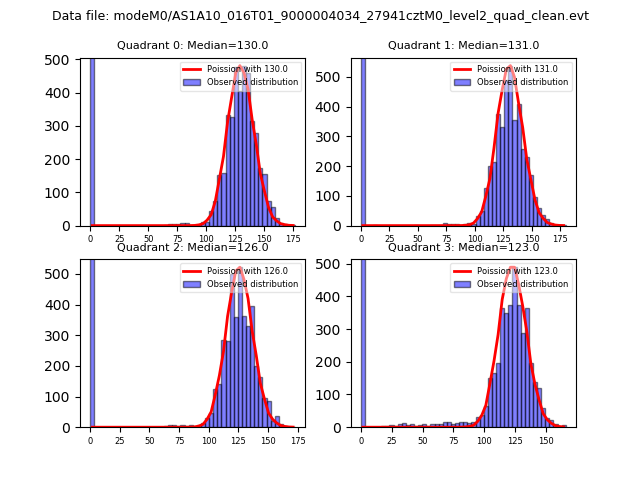 |
 |
| Quadrant-wise count rates Data is divided into 100 sec bins |
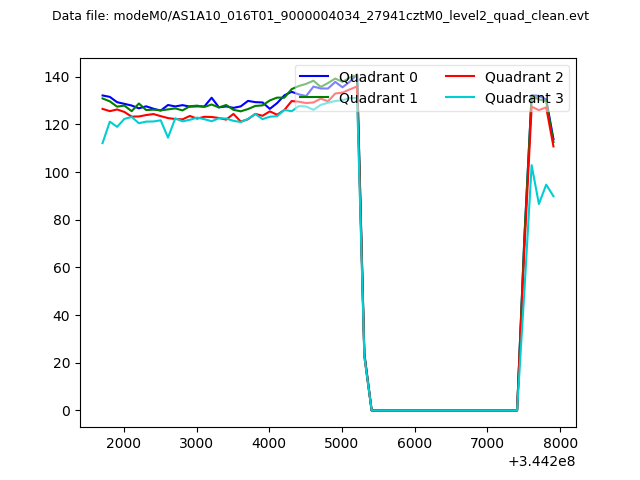 |
|
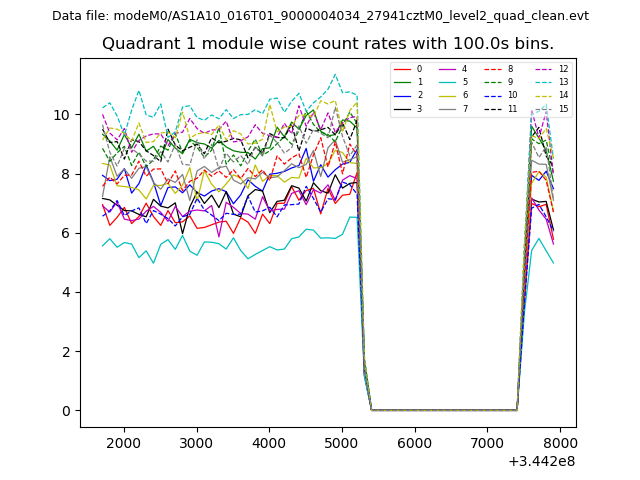
| Module-wise count rates for Quadrant A Data is divided into 100 sec bins |
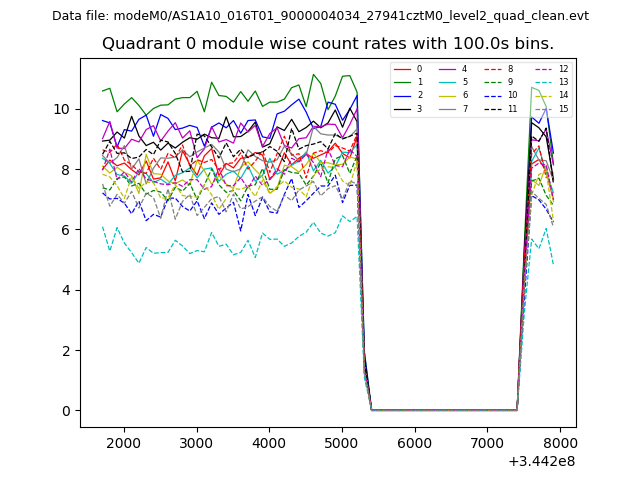 |
 |
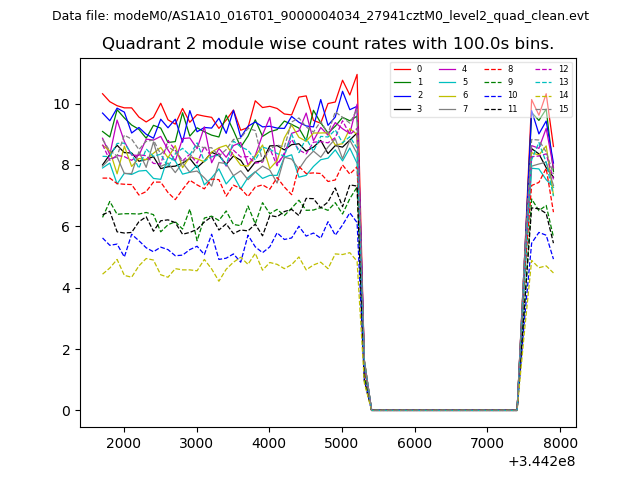
| Module-wise count rates for Quadrant B Data is divided into 100 sec bins |
 |
 |
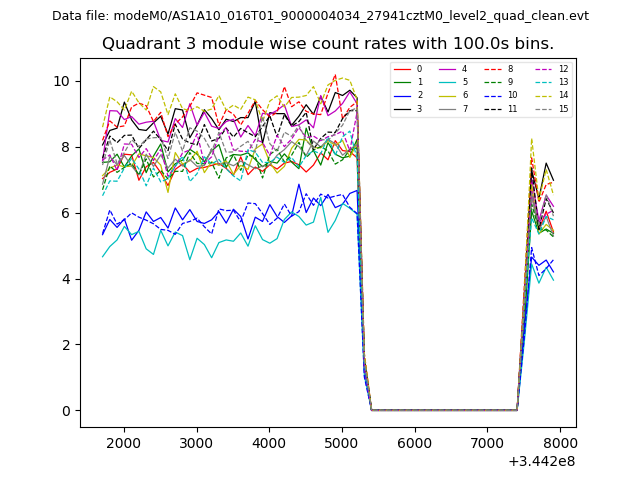
| Module-wise count rates for Quadrant C Data is divided into 100 sec bins |
 |
 |
| Module-wise count rates for Quadrant D Data is divided into 100 sec bins |
 |
 |
| Parameter | Plot |
|---|---|
| CZT HV Monitor | 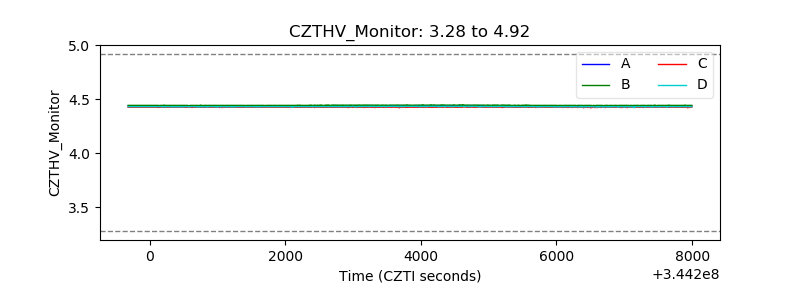 |
| D_VDD | 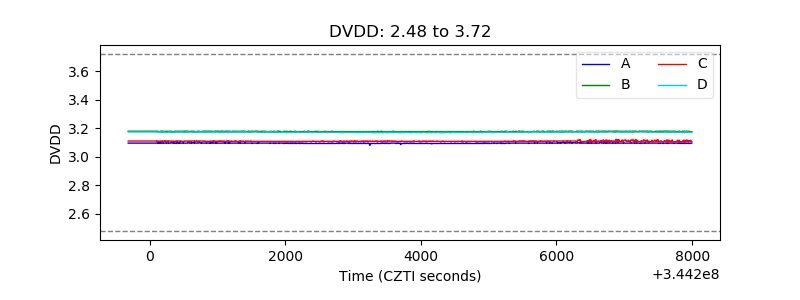 |
| Temperature 1 | 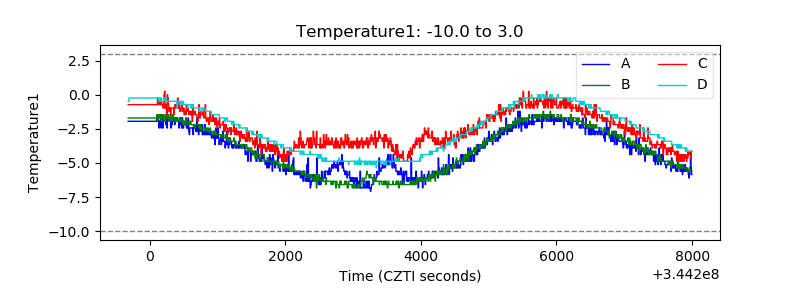 |
| Veto HV Monitor |  |
| Veto LLD | 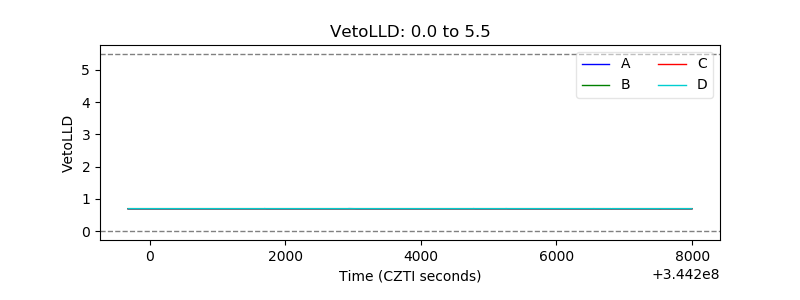 |
| Alpha Counter | 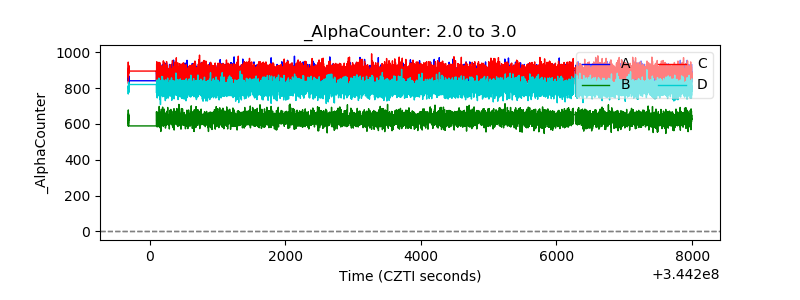 |
| _CPM_Rate |  |
| CZT Counter | 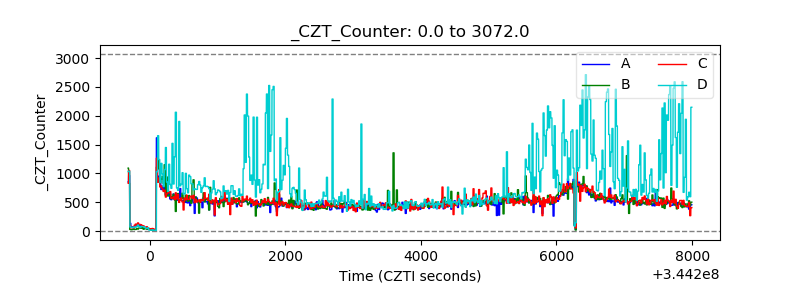 |
| +2.5 Volts monitor |  |
| +5 Volts monitor |  |
| _ROLL_ROT | 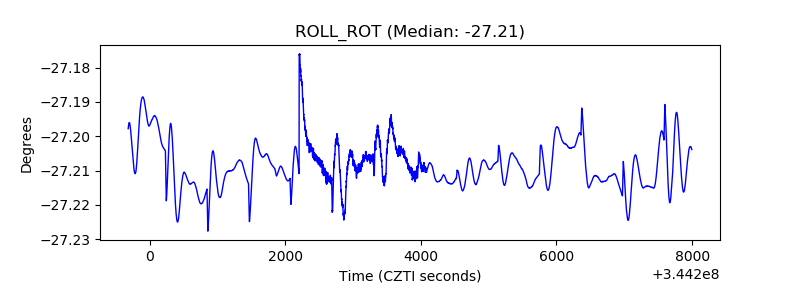 |
| _Roll_DEC | 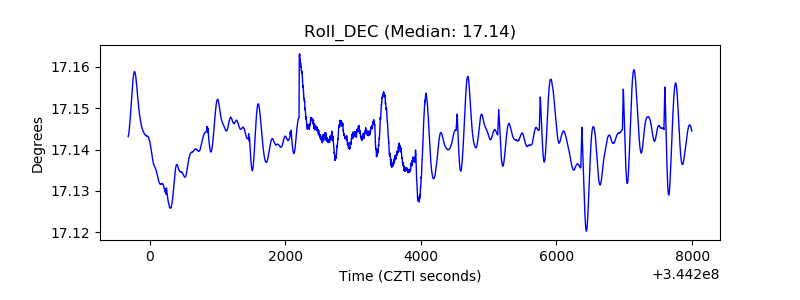 |
| _Roll_RA | 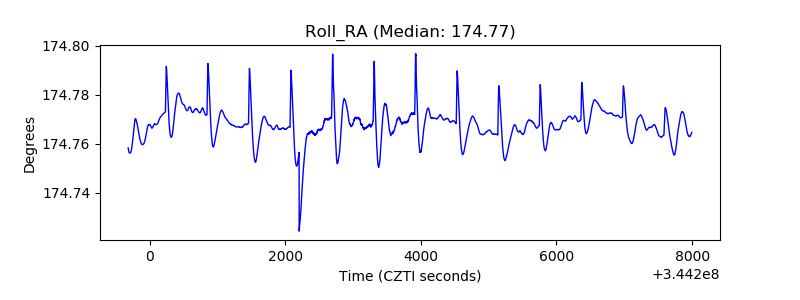 |
| Veto Counter | 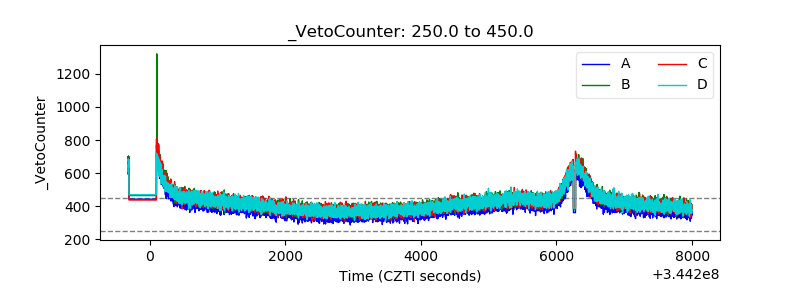 |