| Param | Original file | Final file |
|---|---|---|
| Filename | modeM0/AS1A10_016T01_9000004034_27945cztM0_level2.evt | modeM0/AS1A10_016T01_9000004034_27945cztM0_level2_quad_clean.evt |
| Size (bytes) | 1,520,087,040 | 238,703,040 |
| Size | 1.4 GB | 227.6 MB |
| Events in quadrant A | 8,802,913 | 1,539,828 |
| Events in quadrant B | 9,299,716 | 1,552,927 |
| Events in quadrant C | 9,158,112 | 1,481,056 |
| Events in quadrant D | 17,520,338 | 1,373,951 |
| Mode M0 | |||
|---|---|---|---|
| Quadrant | BADHDUFLAG | Total packets | Discarded packets |
| A | 0 | 38341 | 0 |
| B | 0 | 39729 | 0 |
| C | 0 | 39216 | 0 |
| D | 0 | 65038 | 0 |
| Mode M9 | |||
|---|---|---|---|
| Quadrant | BADHDUFLAG | Total packets | Discarded packets |
| A | 0 | 21 | 0 |
| B | 0 | 22 | 0 |
| C | 0 | 22 | 0 |
| D | 0 | 22 | 0 |
| Quadrant | Total seconds | Saturated seconds | Saturation percentage |
|---|---|---|---|
| A | 18608 | 120 | 0.644884% |
| B | 18608 | 222 | 1.193035% |
| C | 18608 | 318 | 1.708942% |
| D | 18607 | 2001 | 10.754017% |
Noise dominated data is calculated using 1-second bins in cleaned event files. If a bin has >2000 counts, and if more than 50% of those come from <1% of pixels, then it is considered to be noise-dominated and hence unusable.
| Quadrant | # 1 sec bins | Bins with >0 counts | Bins with >2000 counts | High rate bins dominated by noise | Noise dominated (total time) | Noise dominated (detector-on time) | Marked lightcurve |
|---|---|---|---|---|---|---|---|
| A | 20573 | 18609 | 2 | 2 | 0.01% | 0.01% | 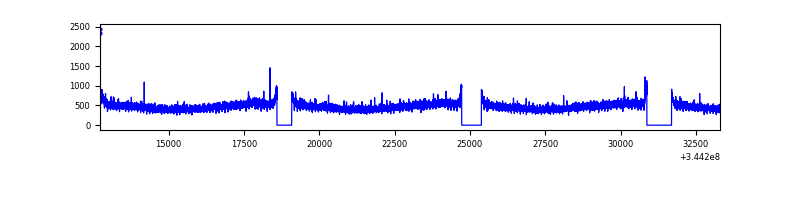 |
| B | 20573 | 18608 | 18 | 18 | 0.09% | 0.10% | 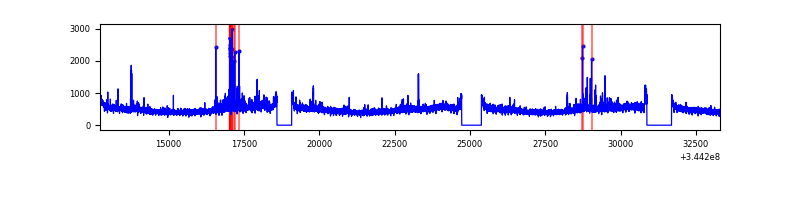 |
| C | 20573 | 18608 | 1 | 1 | 0.00% | 0.01% | 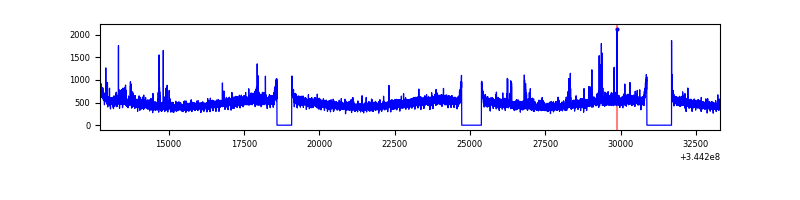 |
| D | 20571 | 18606 | 1748 | 1748 | 8.50% | 9.39% | 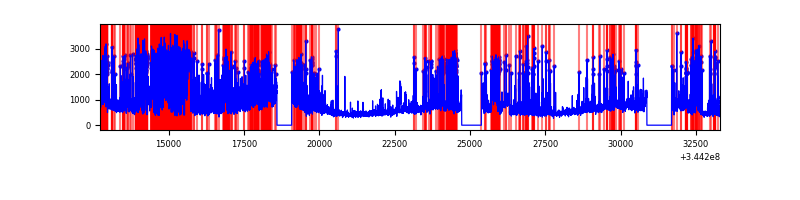 |
Top three noisy pixels from each quadrant. If the there are fewer than three noisy pixels in the level2.evt file, extra rows are filled as -1
| Pixel properties | Quadrant properties | ||||||
|---|---|---|---|---|---|---|---|
| Quadrant | DetID | PixID | Counts | Sigma | Mean | Median | Sigma |
| A | 13 | 254 | 29810 | 60.5 | 2278 | 2232 | 455.8 |
| A | 3 | 137 | 22449 | 44.35 | 2278 | 2232 | 455.8 |
| A | 0 | 226 | 19386 | 37.63 | 2278 | 2232 | 455.8 |
| B | 0 | 230 | 187786 | 431.59 | 2256 | 2200 | 430.0 |
| B | 10 | 245 | 154373 | 353.88 | 2256 | 2200 | 430.0 |
| B | 12 | 111 | 53974 | 120.4 | 2256 | 2200 | 430.0 |
| C | 14 | 238 | 362076 | 702.65 | 2172 | 2180 | 512.2 |
| C | 3 | 233 | 289196 | 560.36 | 2172 | 2180 | 512.2 |
| C | 14 | 94 | 22225 | 39.14 | 2172 | 2180 | 512.2 |
| D | 1 | 52 | 6385012 | 12717.28 | 2098 | 2043 | 501.9 |
| D | 8 | 195 | 1740482 | 3463.63 | 2098 | 2043 | 501.9 |
| D | 2 | 250 | 1047429 | 2082.8 | 2098 | 2043 | 501.9 |
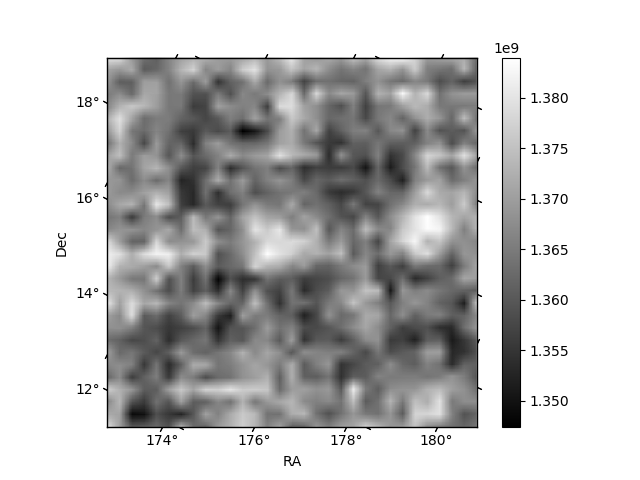
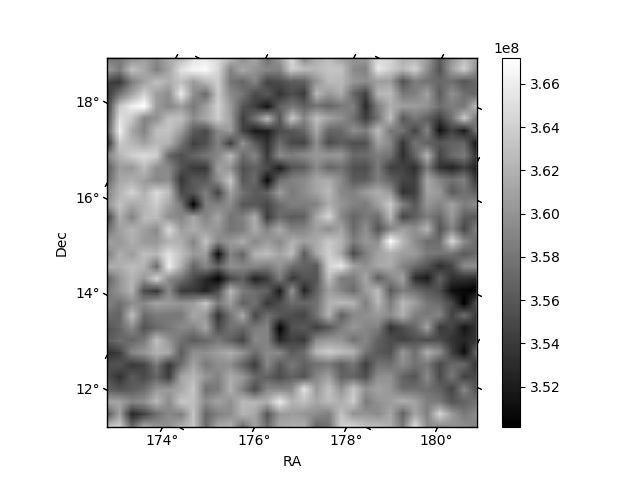
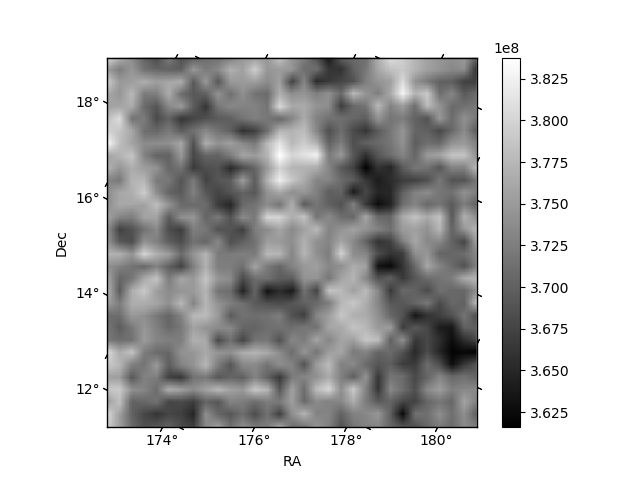
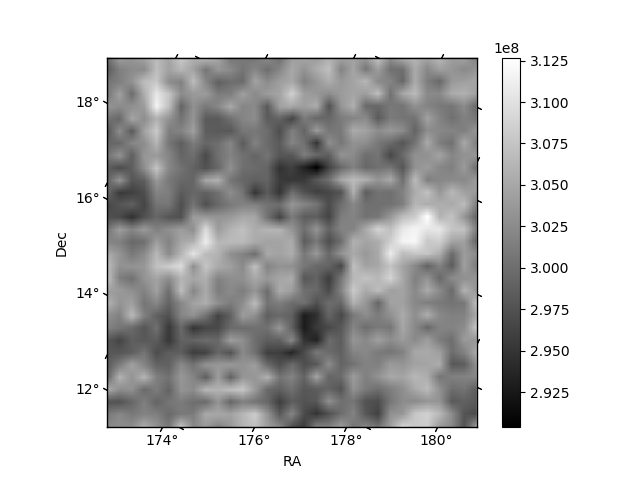
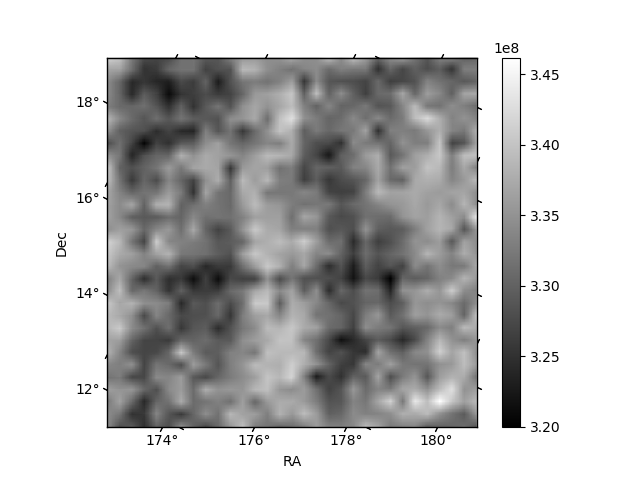
Histogram calculated using DETX and DETY for each event in the final _common_clean file
| Quadrant A | 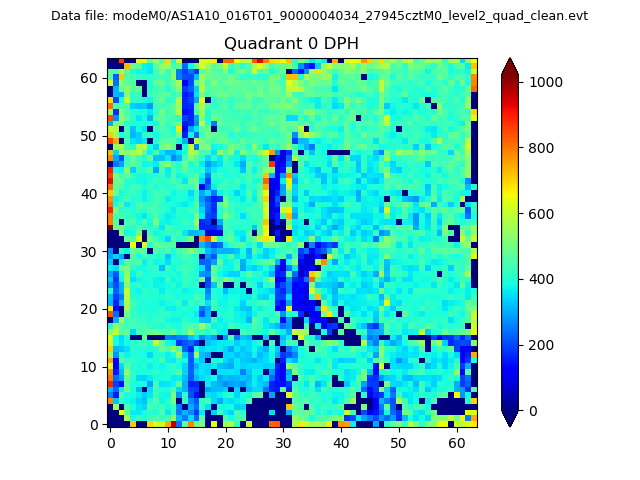 |
 |
Quadrant B |
|---|---|---|---|
| Quadrant D | 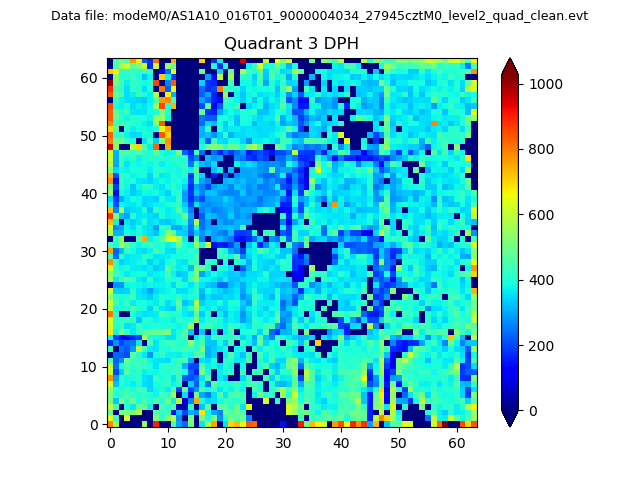 |
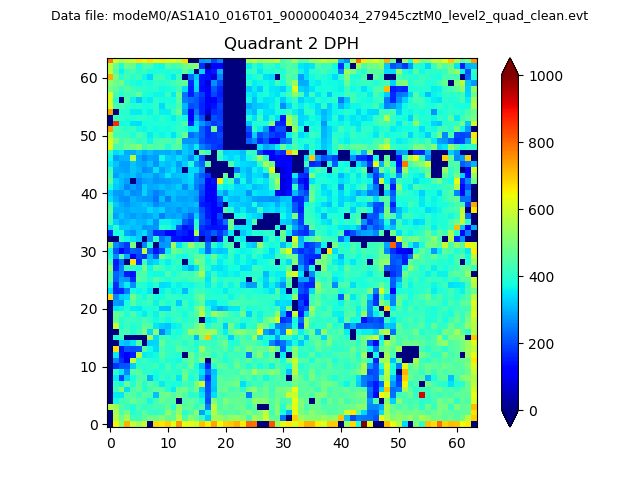 |
Quadrant C |
| Plot type | Count rate plots | Images |
|---|---|---|
| Comparison with Poisson distribution Blue bars denote a histogram of data divided into 1 sec bins. Red curve is a Poisson curve with rate = median count rate of data. |
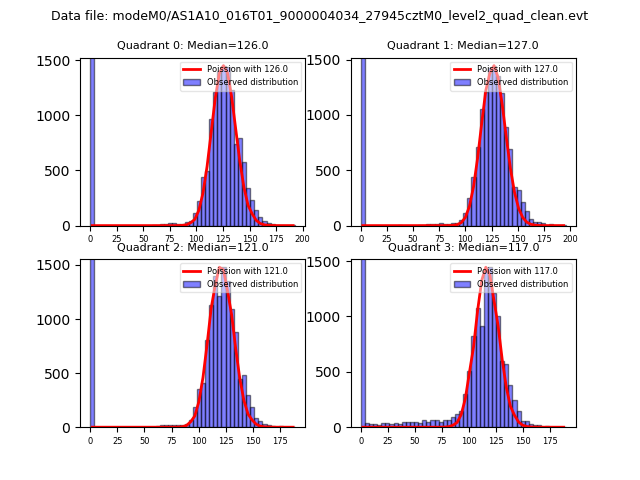 |
 |
| Quadrant-wise count rates Data is divided into 100 sec bins |
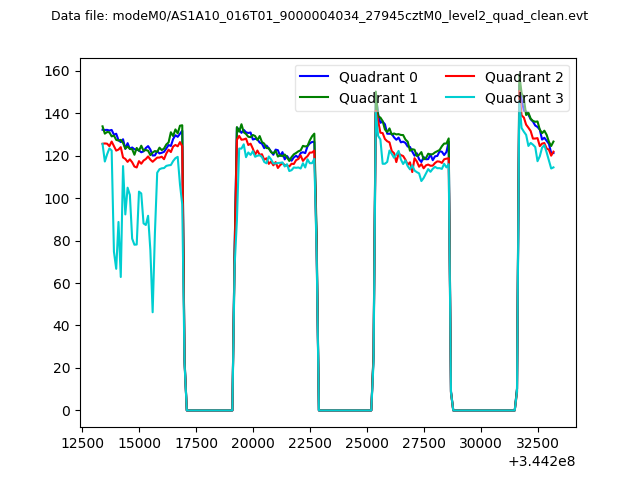 |
|
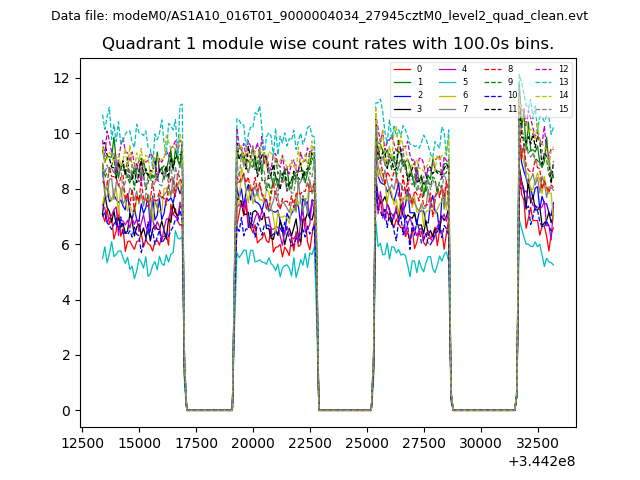
| Module-wise count rates for Quadrant A Data is divided into 100 sec bins |
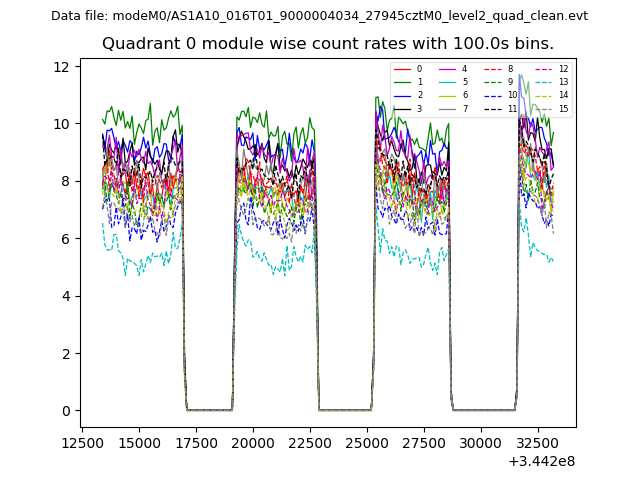 |
 |
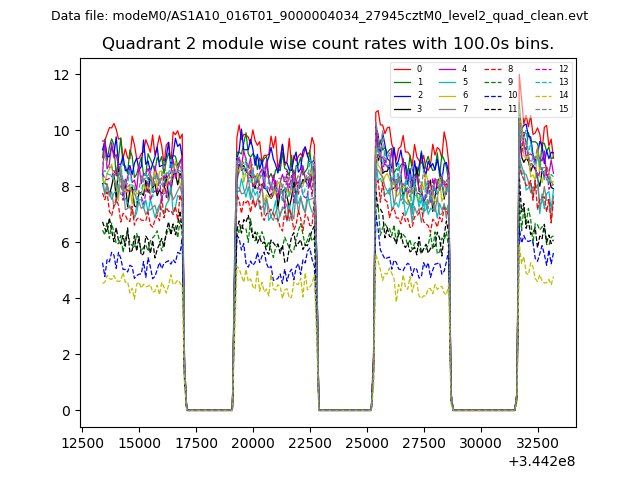
| Module-wise count rates for Quadrant B Data is divided into 100 sec bins |
 |
 |
| Module-wise count rates for Quadrant C Data is divided into 100 sec bins |
 |
 |
| Module-wise count rates for Quadrant D Data is divided into 100 sec bins |
 |
 |
| Parameter | Plot |
|---|---|
| CZT HV Monitor | 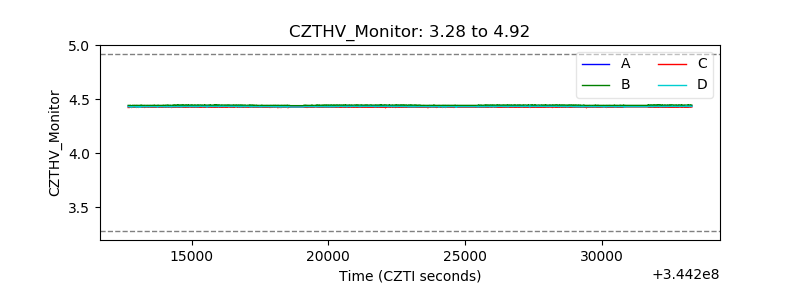 |
| D_VDD | 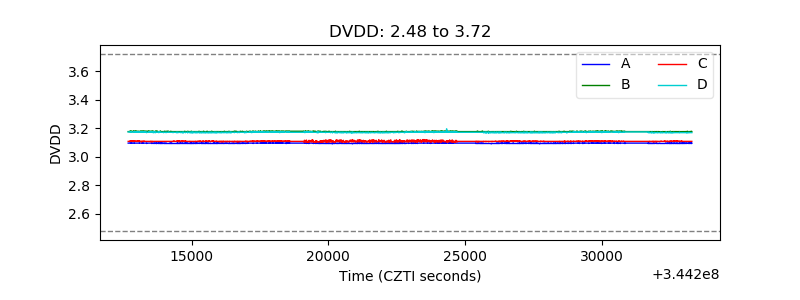 |
| Temperature 1 | 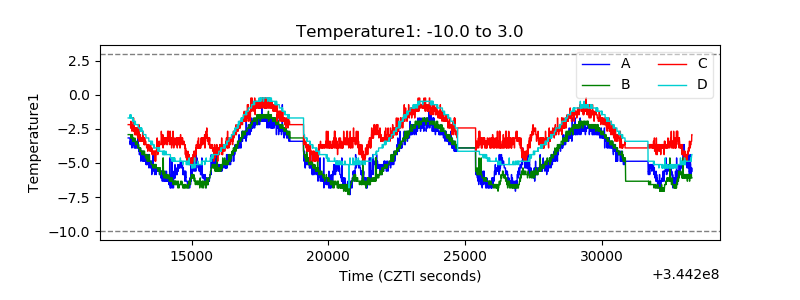 |
| Veto HV Monitor | 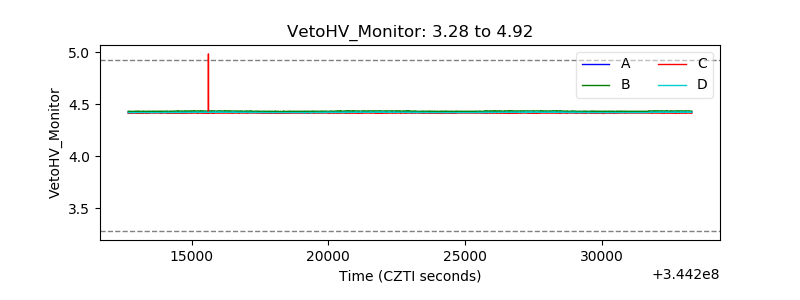 |
| Veto LLD | 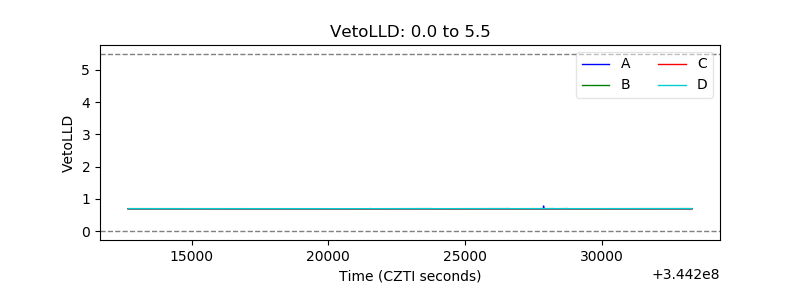 |
| Alpha Counter | 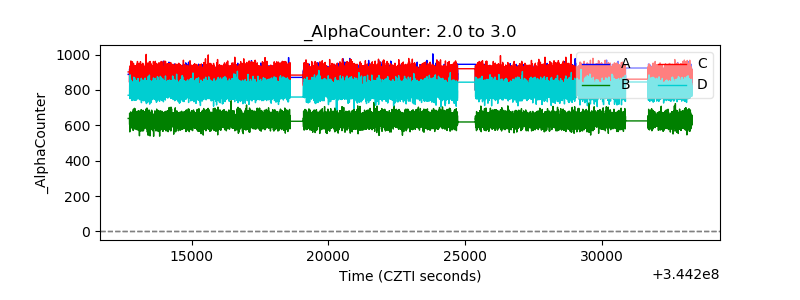 |
| _CPM_Rate | 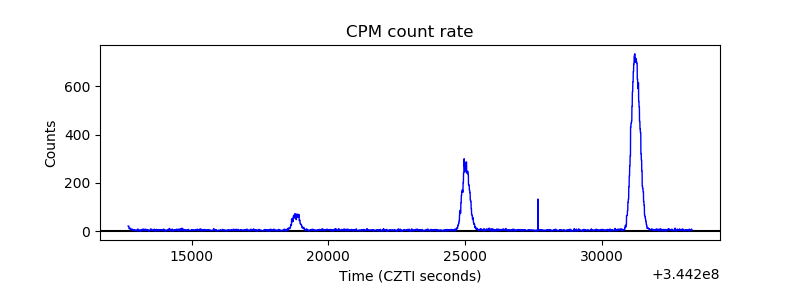 |
| CZT Counter | 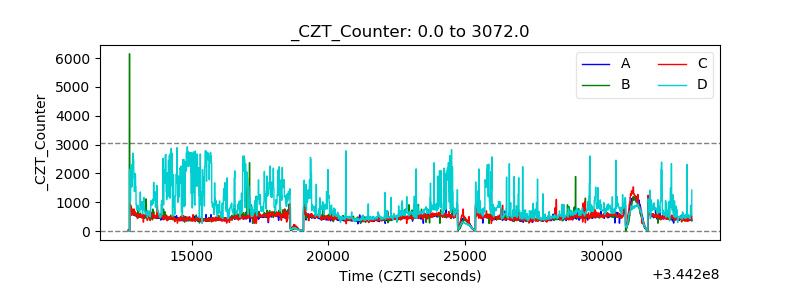 |
| +2.5 Volts monitor |  |
| +5 Volts monitor |  |
| _ROLL_ROT |  |
| _Roll_DEC | 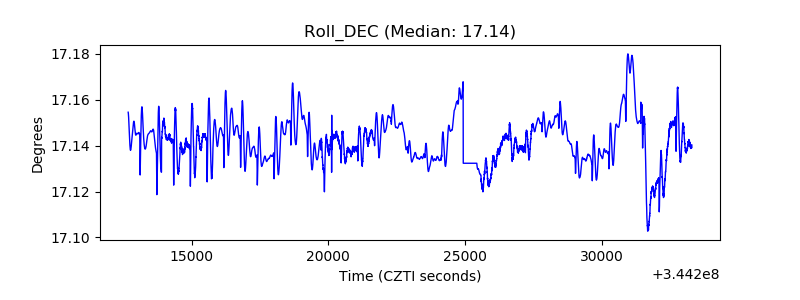 |
| _Roll_RA | 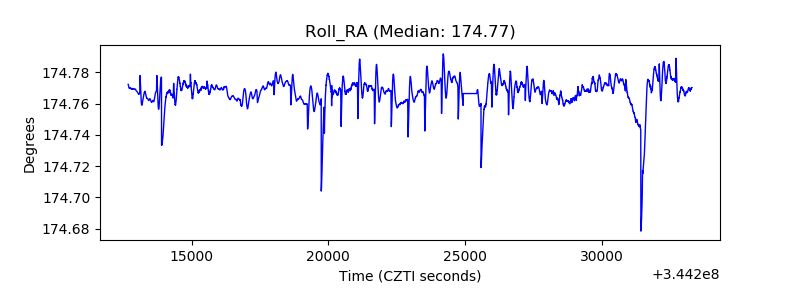 |
| Veto Counter | 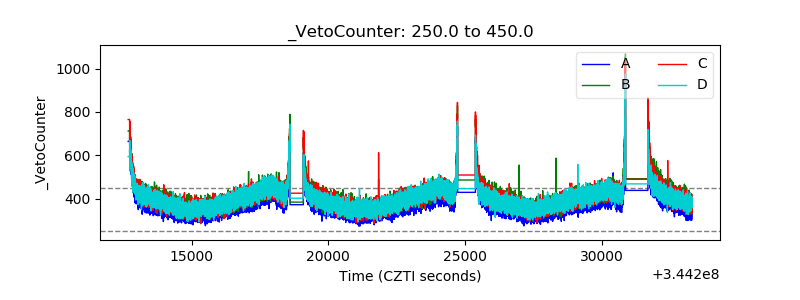 |