| Param | Original file | Final file |
|---|---|---|
| Filename | modeM0/AS1A10_016T01_9000004034_27946cztM0_level2.evt | modeM0/AS1A10_016T01_9000004034_27946cztM0_level2_quad_clean.evt |
| Size (bytes) | 2,476,918,080 | 371,471,040 |
| Size | 2.3 GB | 354.3 MB |
| Events in quadrant A | 13,693,658 | 2,408,050 |
| Events in quadrant B | 14,520,125 | 2,434,056 |
| Events in quadrant C | 14,278,872 | 2,322,424 |
| Events in quadrant D | 30,574,216 | 2,099,562 |
| Mode M0 | |||
|---|---|---|---|
| Quadrant | BADHDUFLAG | Total packets | Discarded packets |
| A | 0 | 59525 | 0 |
| B | 0 | 61815 | 0 |
| C | 0 | 60912 | 0 |
| D | 0 | 110962 | 0 |
| Mode M9 | |||
|---|---|---|---|
| Quadrant | BADHDUFLAG | Total packets | Discarded packets |
| A | 0 | 33 | 0 |
| B | 0 | 33 | 0 |
| C | 0 | 33 | 0 |
| D | 0 | 33 | 0 |
| Quadrant | Total seconds | Saturated seconds | Saturation percentage |
|---|---|---|---|
| A | 28900 | 190 | 0.657439% |
| B | 28901 | 323 | 1.117608% |
| C | 28901 | 479 | 1.657382% |
| D | 28900 | 4614 | 15.965398% |
Noise dominated data is calculated using 1-second bins in cleaned event files. If a bin has >2000 counts, and if more than 50% of those come from <1% of pixels, then it is considered to be noise-dominated and hence unusable.
| Quadrant | # 1 sec bins | Bins with >0 counts | Bins with >2000 counts | High rate bins dominated by noise | Noise dominated (total time) | Noise dominated (detector-on time) | Marked lightcurve |
|---|---|---|---|---|---|---|---|
| A | 32115 | 28902 | 5 | 5 | 0.02% | 0.02% |  |
| B | 32116 | 28902 | 20 | 20 | 0.06% | 0.07% | 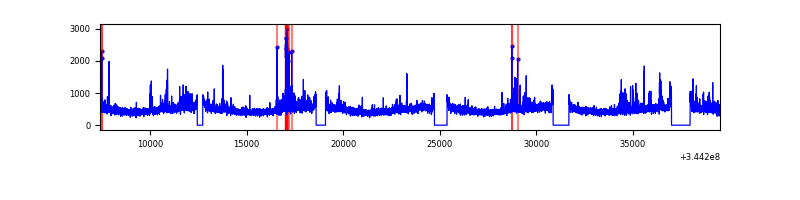 |
| C | 32116 | 28901 | 5 | 5 | 0.02% | 0.02% | 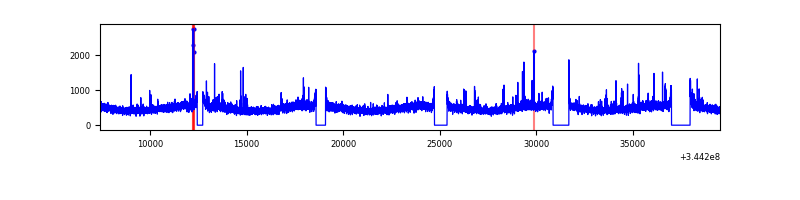 |
| D | 32115 | 28900 | 4036 | 4036 | 12.57% | 13.97% | 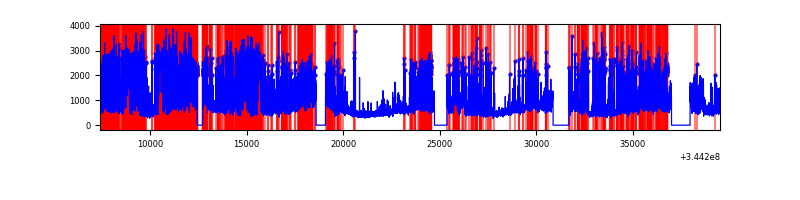 |
Top three noisy pixels from each quadrant. If the there are fewer than three noisy pixels in the level2.evt file, extra rows are filled as -1
| Pixel properties | Quadrant properties | ||||||
|---|---|---|---|---|---|---|---|
| Quadrant | DetID | PixID | Counts | Sigma | Mean | Median | Sigma |
| A | 13 | 254 | 46902 | 61.37 | 3542 | 3471 | 707.7 |
| A | 3 | 137 | 34796 | 44.26 | 3542 | 3471 | 707.7 |
| A | 0 | 226 | 30310 | 37.92 | 3542 | 3471 | 707.7 |
| B | 0 | 230 | 314551 | 470.01 | 3504 | 3420 | 662.0 |
| B | 10 | 245 | 230956 | 343.73 | 3504 | 3420 | 662.0 |
| B | 0 | 229 | 125408 | 184.28 | 3504 | 3420 | 662.0 |
| C | 14 | 238 | 555596 | 695.9 | 3377 | 3395 | 793.5 |
| C | 3 | 233 | 476991 | 596.84 | 3377 | 3395 | 793.5 |
| C | 2 | 16 | 39855 | 45.95 | 3377 | 3395 | 793.5 |
| D | 1 | 52 | 13843358 | 18289.41 | 3176 | 3091 | 756.7 |
| D | 8 | 195 | 2557574 | 3375.66 | 3176 | 3091 | 756.7 |
| D | 2 | 250 | 1601959 | 2112.85 | 3176 | 3091 | 756.7 |
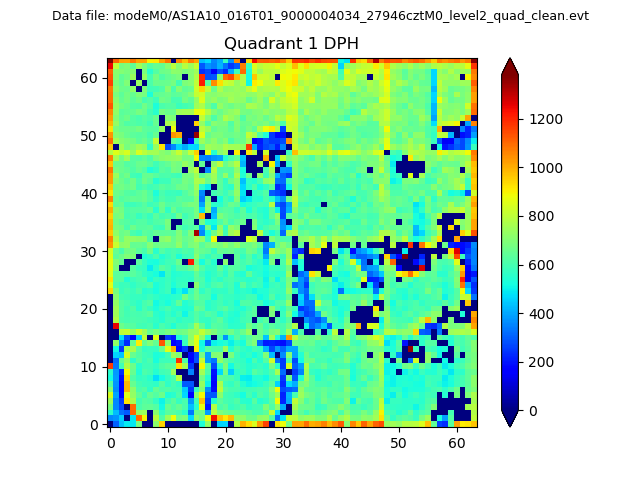
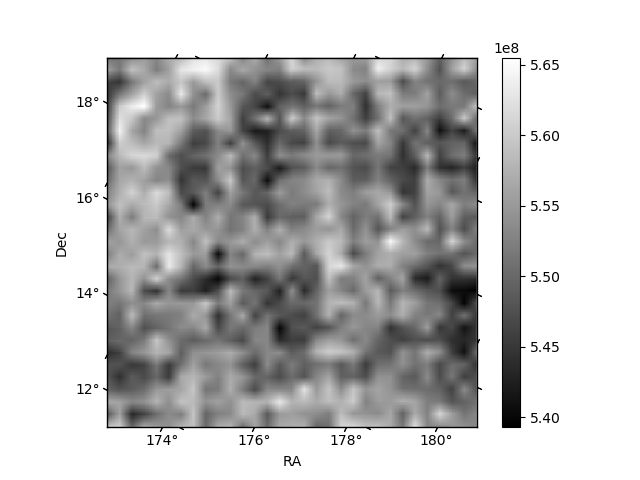
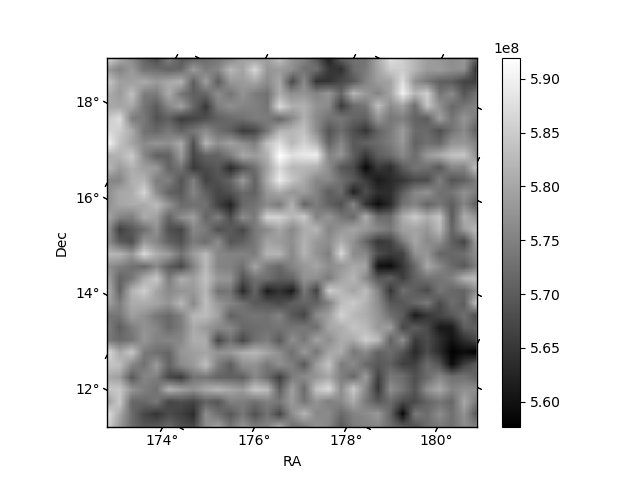
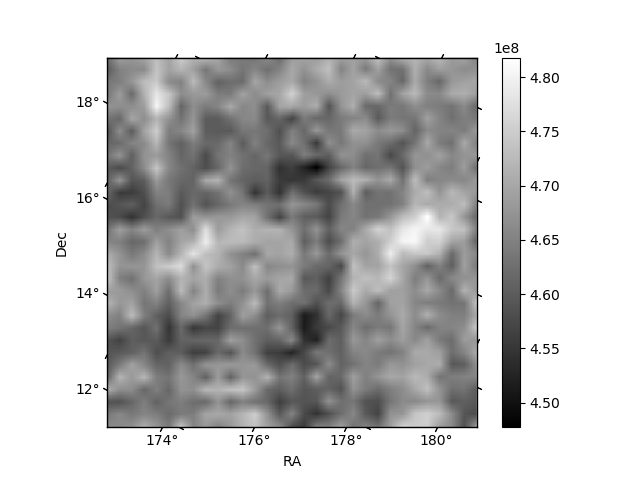
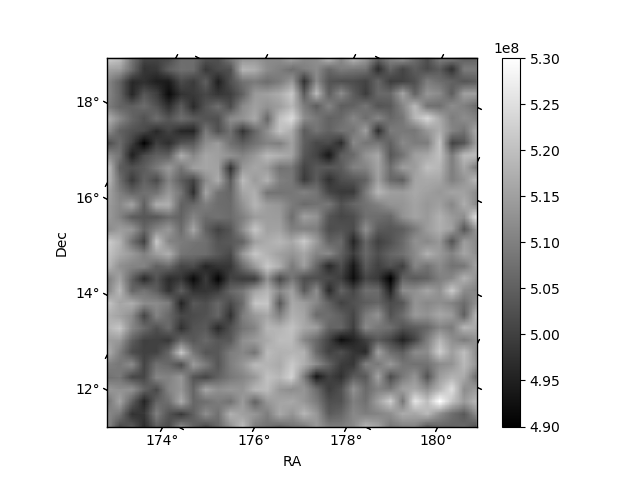
Histogram calculated using DETX and DETY for each event in the final _common_clean file
| Quadrant A | 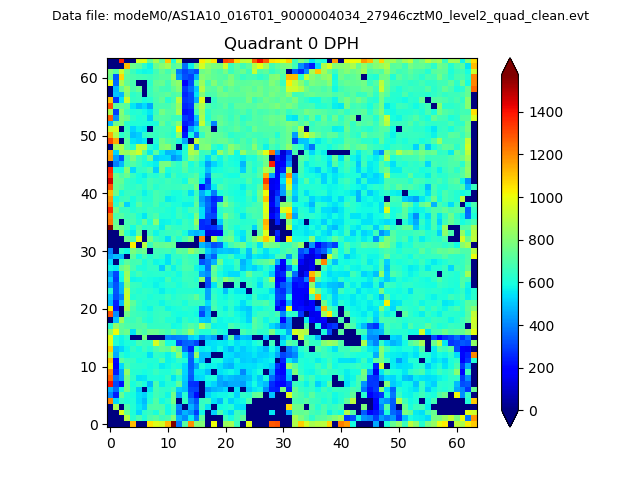 |
 |
Quadrant B |
|---|---|---|---|
| Quadrant D | 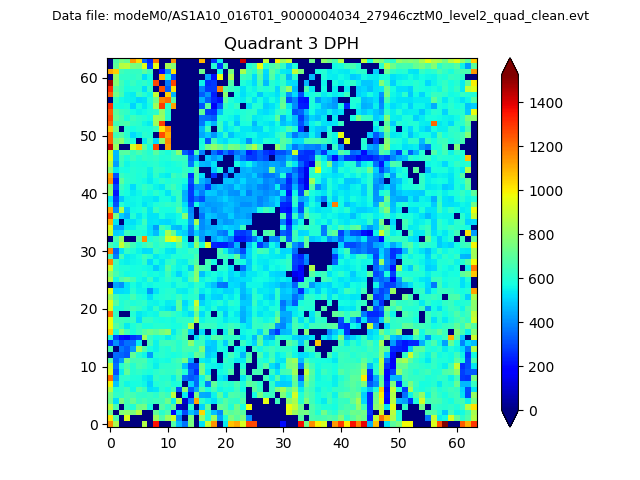 |
 |
Quadrant C |
| Plot type | Count rate plots | Images |
|---|---|---|
| Comparison with Poisson distribution Blue bars denote a histogram of data divided into 1 sec bins. Red curve is a Poisson curve with rate = median count rate of data. |
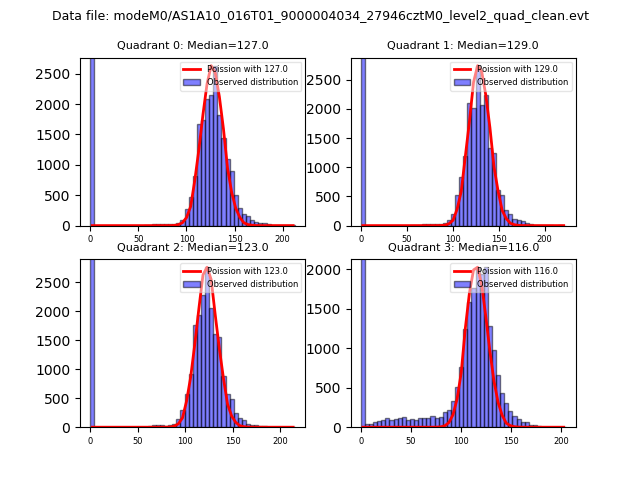 |
 |
| Quadrant-wise count rates Data is divided into 100 sec bins |
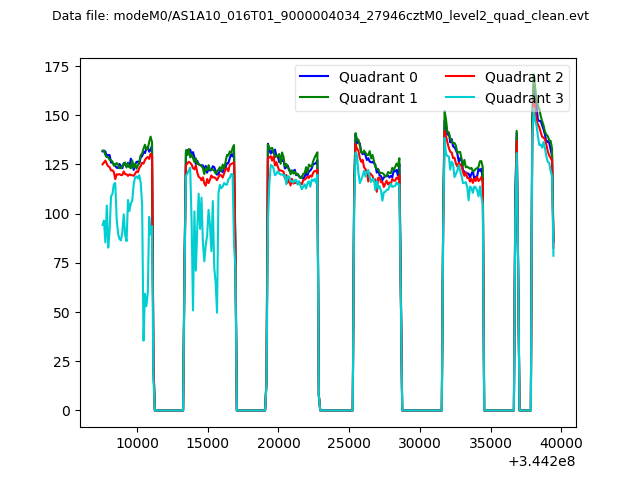 |
|
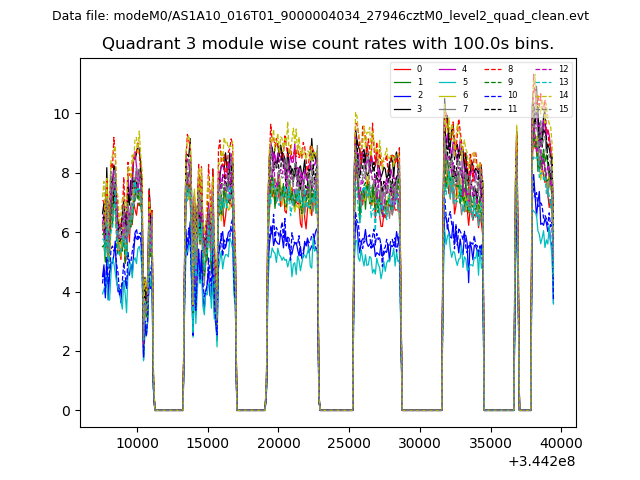
| Module-wise count rates for Quadrant A Data is divided into 100 sec bins |
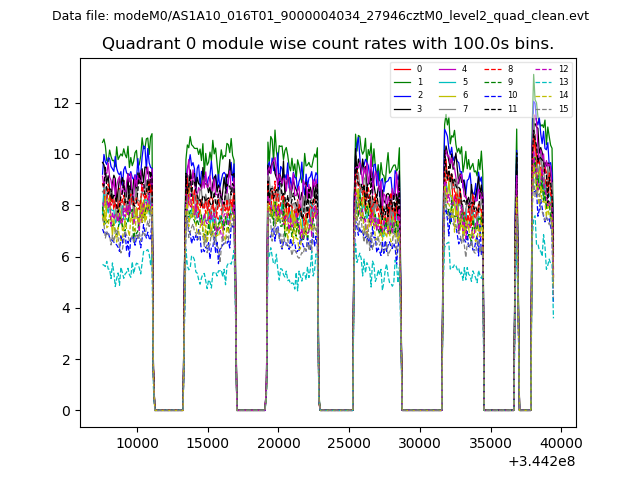 |
 |
| Module-wise count rates for Quadrant B Data is divided into 100 sec bins |
 |
 |
| Module-wise count rates for Quadrant C Data is divided into 100 sec bins |
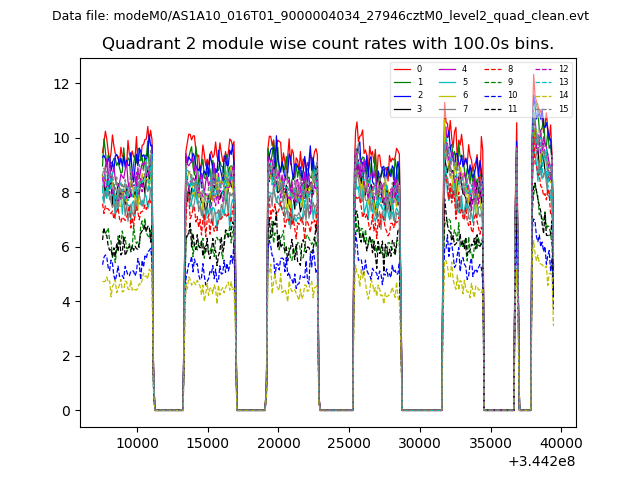 |
 |
| Module-wise count rates for Quadrant D Data is divided into 100 sec bins |
 |
 |
| Parameter | Plot |
|---|---|
| CZT HV Monitor | 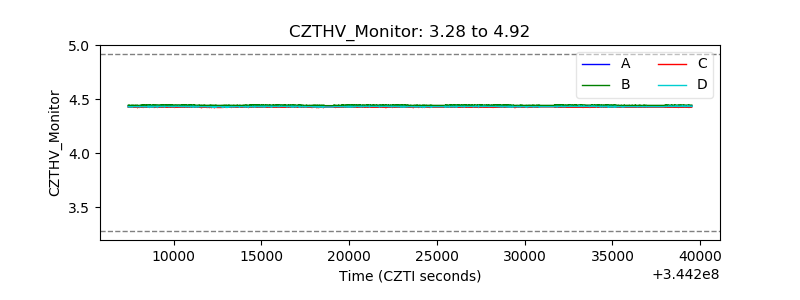 |
| D_VDD | 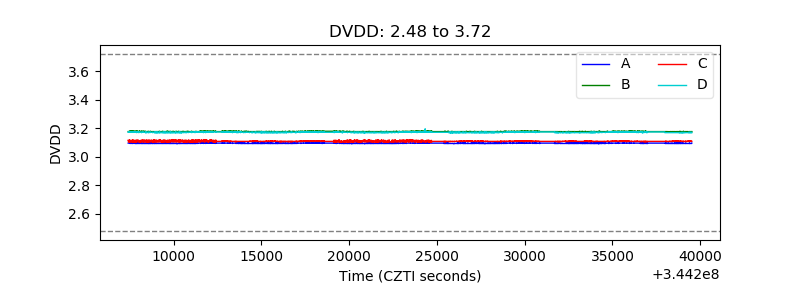 |
| Temperature 1 | 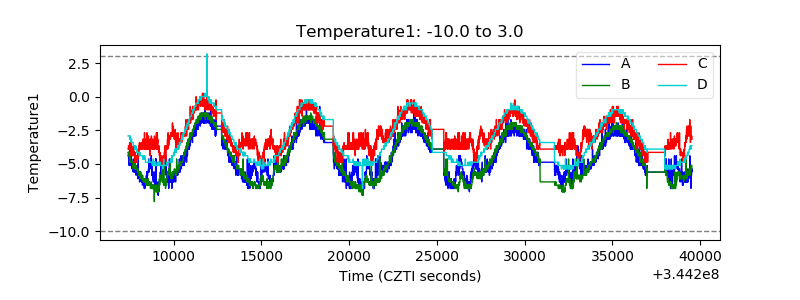 |
| Veto HV Monitor | 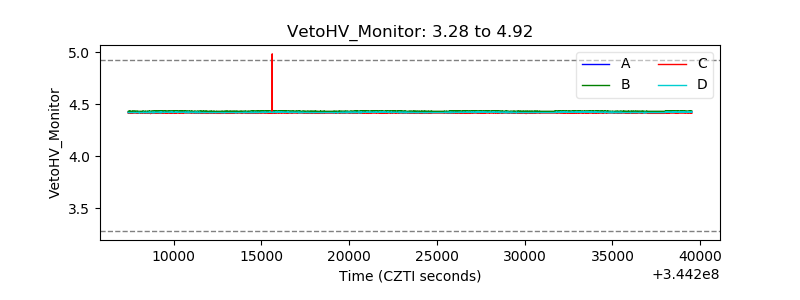 |
| Veto LLD | 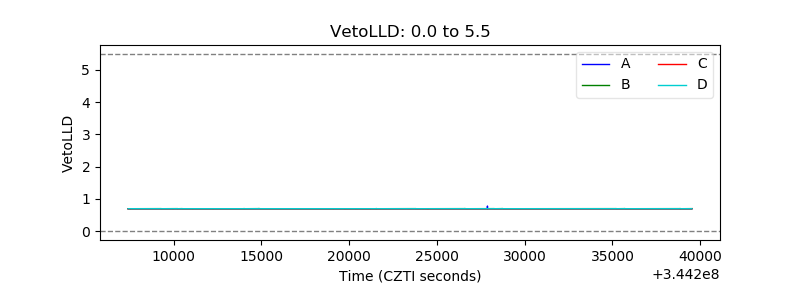 |
| Alpha Counter | 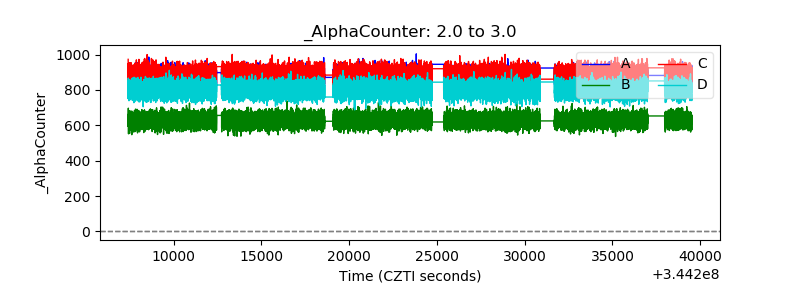 |
| _CPM_Rate | 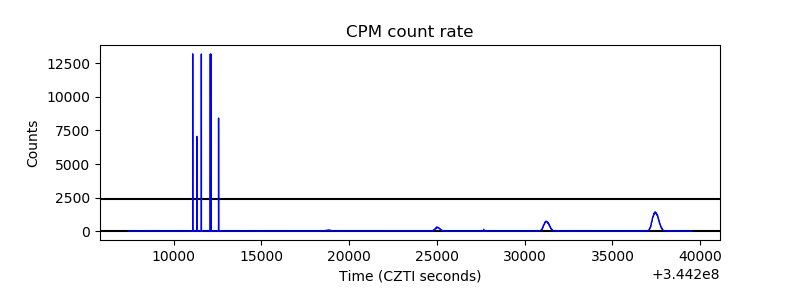 |
| CZT Counter | 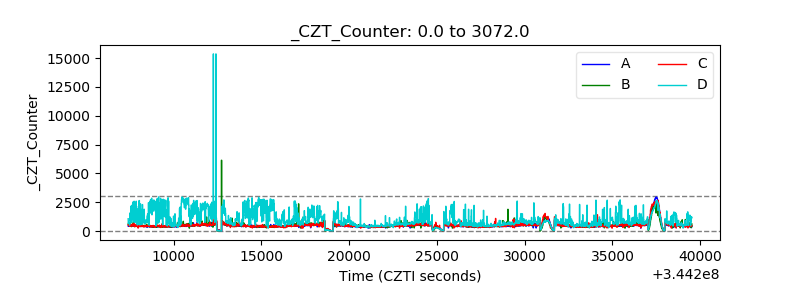 |
| +2.5 Volts monitor |  |
| +5 Volts monitor |  |
| _ROLL_ROT | 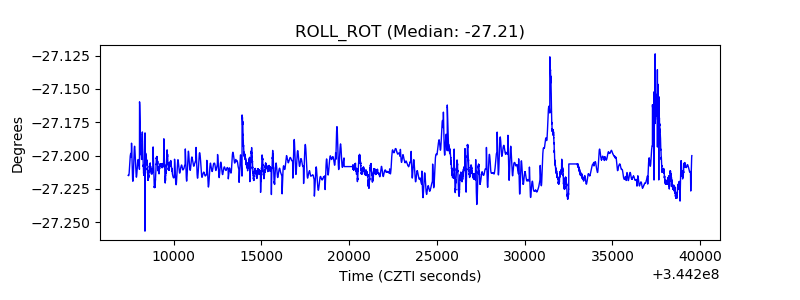 |
| _Roll_DEC | 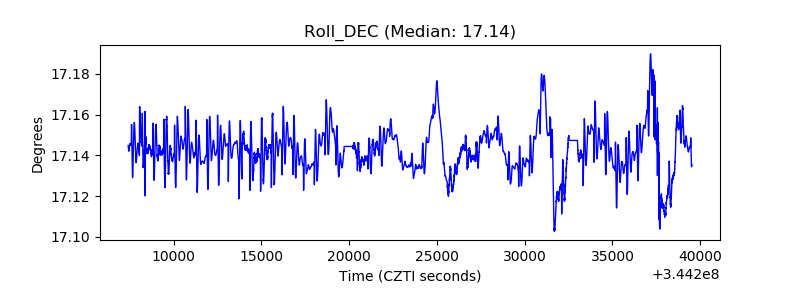 |
| _Roll_RA | 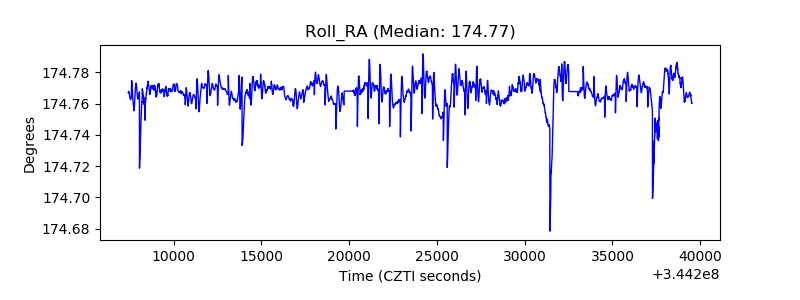 |
| Veto Counter | 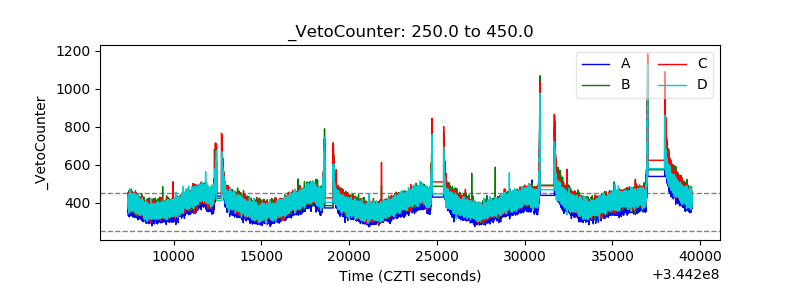 |