| Param | Original file | Final file |
|---|---|---|
| Filename | modeM0/AS1A10_016T01_9000004034_27948cztM0_level2.evt | modeM0/AS1A10_016T01_9000004034_27948cztM0_level2_quad_clean.evt |
| Size (bytes) | 689,454,720 | 79,499,520 |
| Size | 657.5 MB | 75.8 MB |
| Events in quadrant A | 2,905,466 | 537,327 |
| Events in quadrant B | 4,176,485 | 544,553 |
| Events in quadrant C | 3,083,121 | 520,427 |
| Events in quadrant D | 10,314,054 | 390,058 |
| Mode M0 | |||
|---|---|---|---|
| Quadrant | BADHDUFLAG | Total packets | Discarded packets |
| A | 0 | 12228 | 0 |
| B | 0 | 16289 | 0 |
| C | 0 | 12773 | 0 |
| D | 0 | 34607 | 0 |
| Mode M9 | |||
|---|---|---|---|
| Quadrant | BADHDUFLAG | Total packets | Discarded packets |
| A | 0 | 11 | 0 |
| B | 0 | 11 | 0 |
| C | 0 | 11 | 0 |
| D | 0 | 11 | 0 |
| Quadrant | Total seconds | Saturated seconds | Saturation percentage |
|---|---|---|---|
| A | 5924 | 21 | 0.354490% |
| B | 5925 | 229 | 3.864979% |
| C | 5925 | 62 | 1.046414% |
| D | 5924 | 3009 | 50.793383% |
Noise dominated data is calculated using 1-second bins in cleaned event files. If a bin has >2000 counts, and if more than 50% of those come from <1% of pixels, then it is considered to be noise-dominated and hence unusable.
| Quadrant | # 1 sec bins | Bins with >0 counts | Bins with >2000 counts | High rate bins dominated by noise | Noise dominated (total time) | Noise dominated (detector-on time) | Marked lightcurve |
|---|---|---|---|---|---|---|---|
| A | 7069 | 5924 | 1 | 1 | 0.01% | 0.02% | 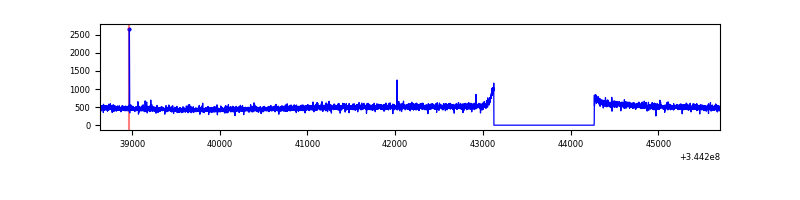 |
| B | 7070 | 5925 | 76 | 76 | 1.07% | 1.28% | 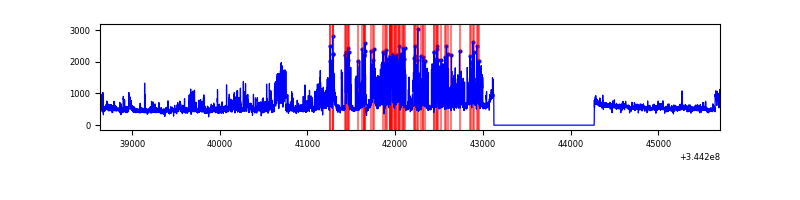 |
| C | 7070 | 5925 | 1 | 1 | 0.01% | 0.02% | 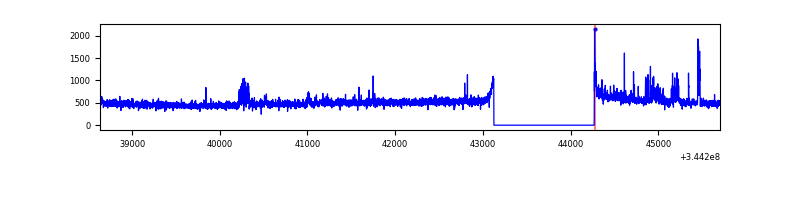 |
| D | 7068 | 5923 | 2901 | 2901 | 41.04% | 48.98% |  |
Top three noisy pixels from each quadrant. If the there are fewer than three noisy pixels in the level2.evt file, extra rows are filled as -1
| Pixel properties | Quadrant properties | ||||||
|---|---|---|---|---|---|---|---|
| Quadrant | DetID | PixID | Counts | Sigma | Mean | Median | Sigma |
| A | 13 | 254 | 10050 | 61.91 | 751 | 736 | 150.4 |
| A | 3 | 137 | 6898 | 40.96 | 751 | 736 | 150.4 |
| A | 0 | 226 | 6441 | 37.92 | 751 | 736 | 150.4 |
| B | 10 | 245 | 1222112 | 8691.69 | 737 | 719 | 140.5 |
| B | 0 | 230 | 29376 | 203.93 | 737 | 719 | 140.5 |
| B | 15 | 32 | 27077 | 187.57 | 737 | 719 | 140.5 |
| C | 3 | 233 | 163899 | 975.13 | 718 | 724 | 167.3 |
| C | 14 | 238 | 117355 | 696.98 | 718 | 724 | 167.3 |
| C | 13 | 61 | 4871 | 24.78 | 718 | 724 | 167.3 |
| D | 7 | 80 | 4006307 | 29170.25 | 583 | 565 | 137.3 |
| D | 1 | 52 | 3364552 | 24496.92 | 583 | 565 | 137.3 |
| D | 8 | 195 | 587961 | 4277.48 | 583 | 565 | 137.3 |
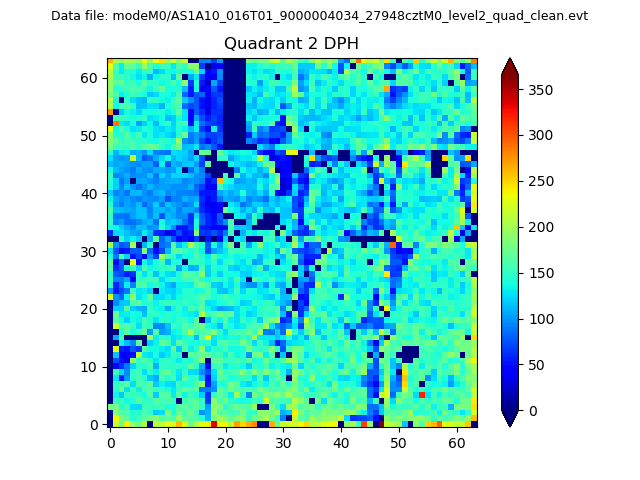
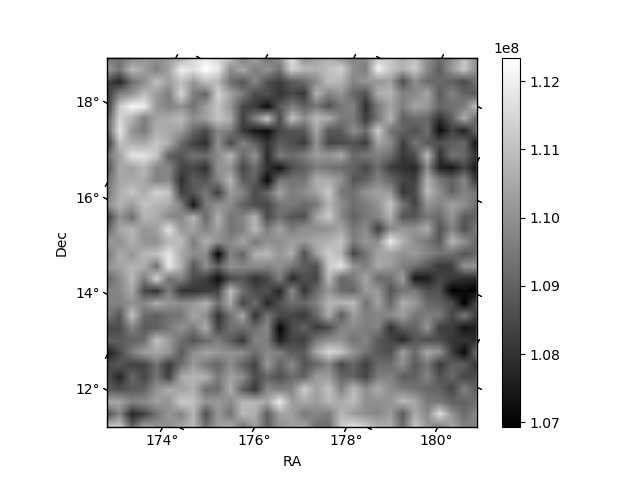
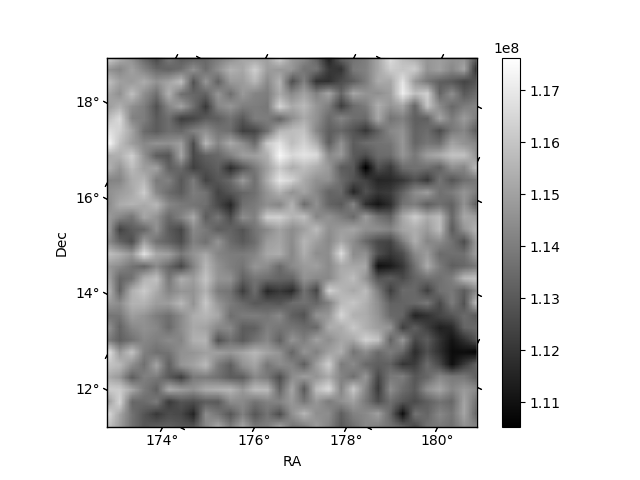
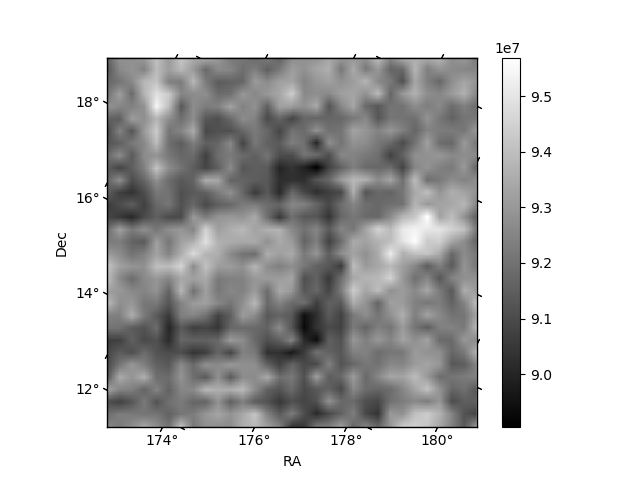
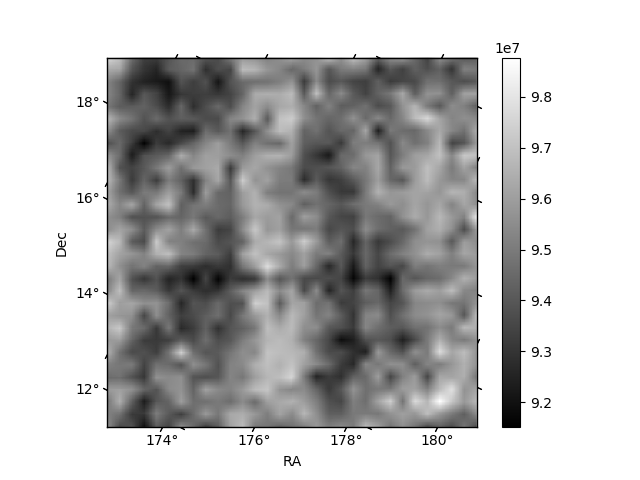
Histogram calculated using DETX and DETY for each event in the final _common_clean file
| Quadrant A | 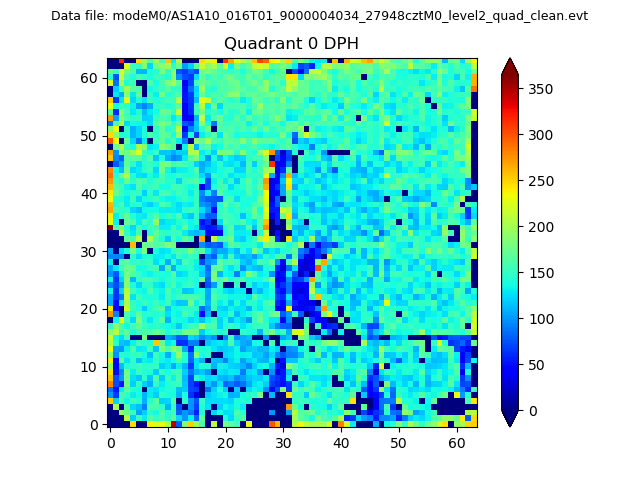 |
 |
Quadrant B |
|---|---|---|---|
| Quadrant D | 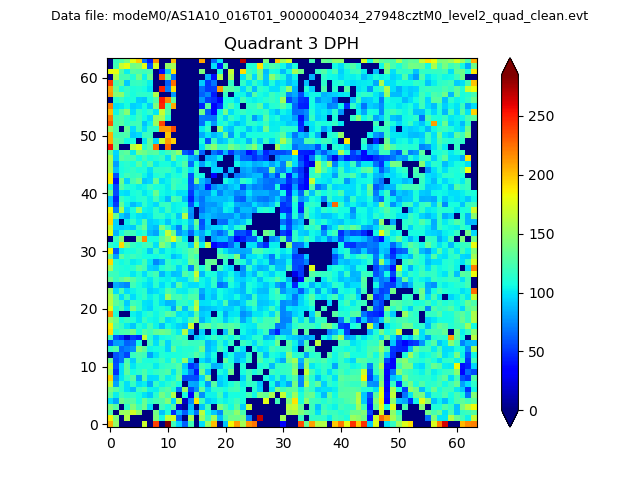 |
 |
Quadrant C |
| Plot type | Count rate plots | Images |
|---|---|---|
| Comparison with Poisson distribution Blue bars denote a histogram of data divided into 1 sec bins. Red curve is a Poisson curve with rate = median count rate of data. |
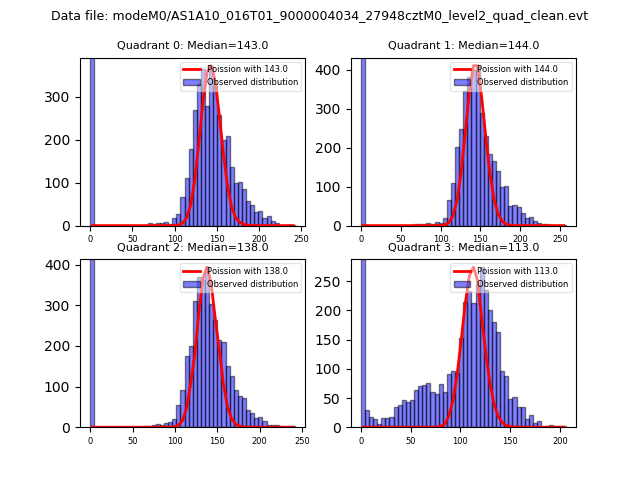 |
 |
| Quadrant-wise count rates Data is divided into 100 sec bins |
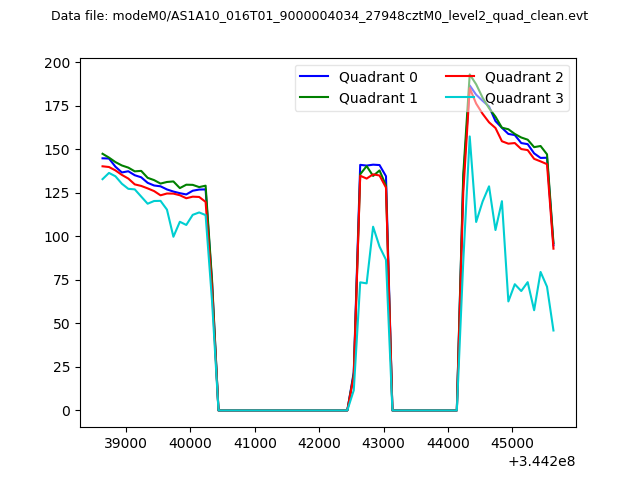 |
|
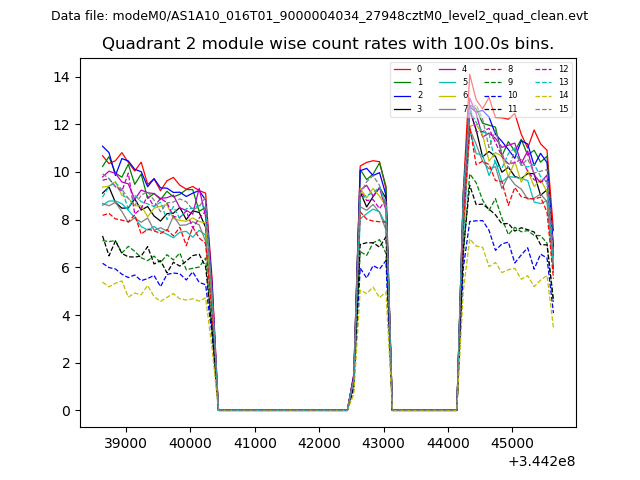
| Module-wise count rates for Quadrant A Data is divided into 100 sec bins |
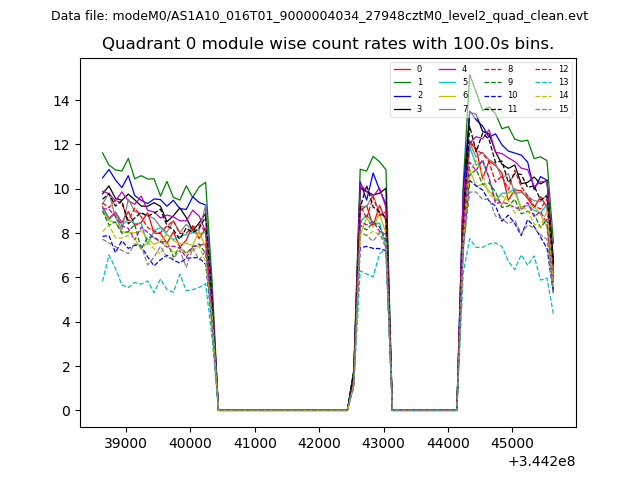 |
 |
| Module-wise count rates for Quadrant B Data is divided into 100 sec bins |
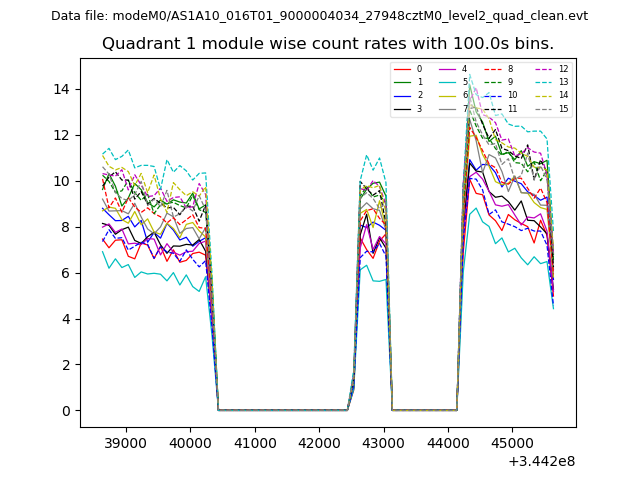 |
 |
| Module-wise count rates for Quadrant C Data is divided into 100 sec bins |
 |
 |
| Module-wise count rates for Quadrant D Data is divided into 100 sec bins |
 |
 |
| Parameter | Plot |
|---|---|
| CZT HV Monitor | 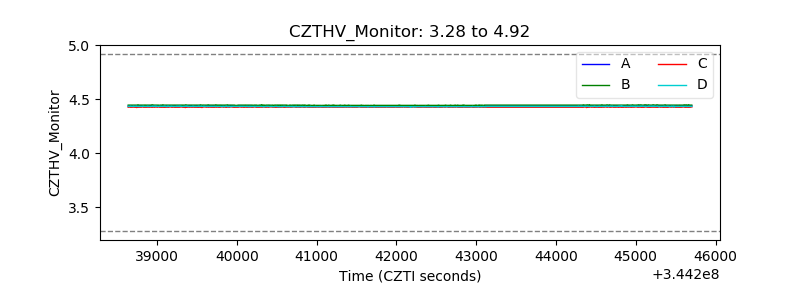 |
| D_VDD | 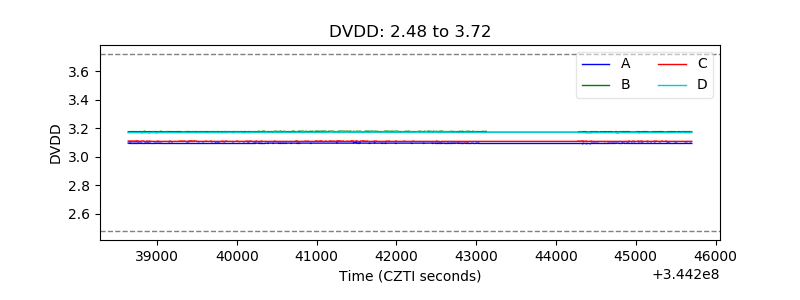 |
| Temperature 1 | 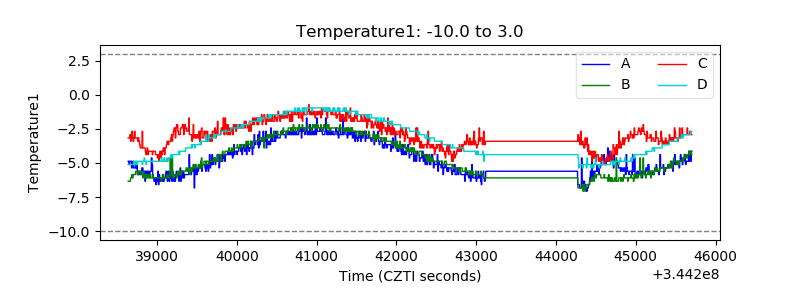 |
| Veto HV Monitor | 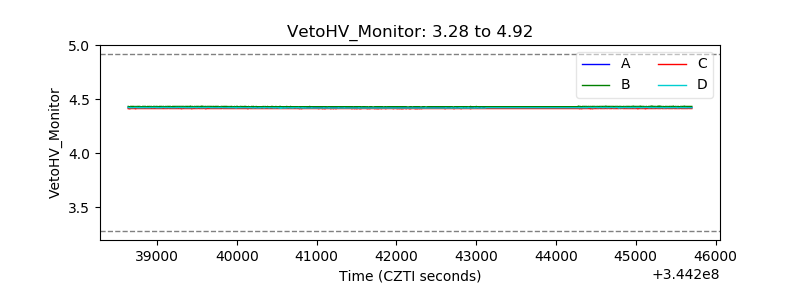 |
| Veto LLD | 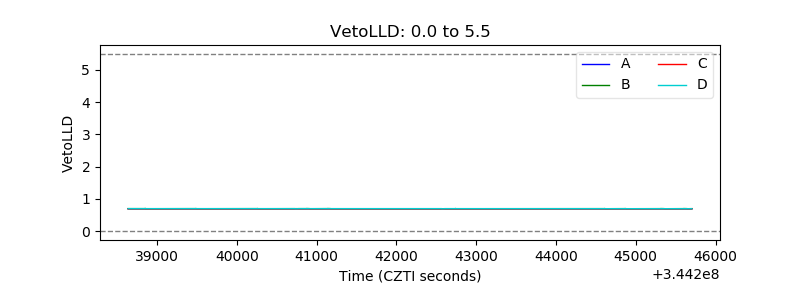 |
| Alpha Counter |  |
| _CPM_Rate | 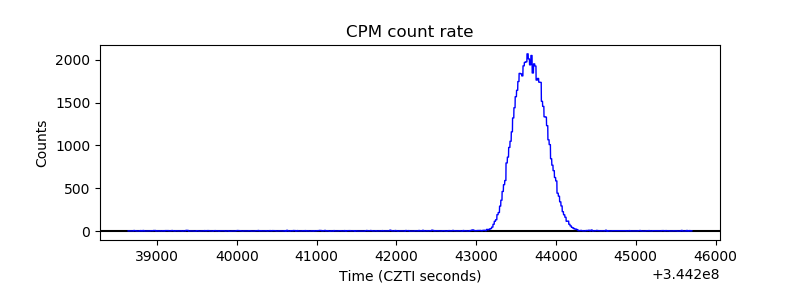 |
| CZT Counter | 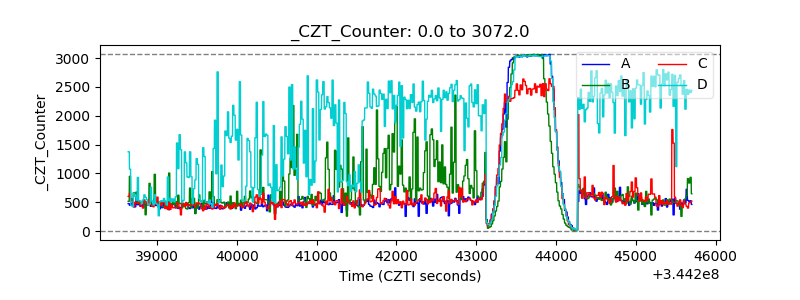 |
| +2.5 Volts monitor |  |
| +5 Volts monitor |  |
| _ROLL_ROT | 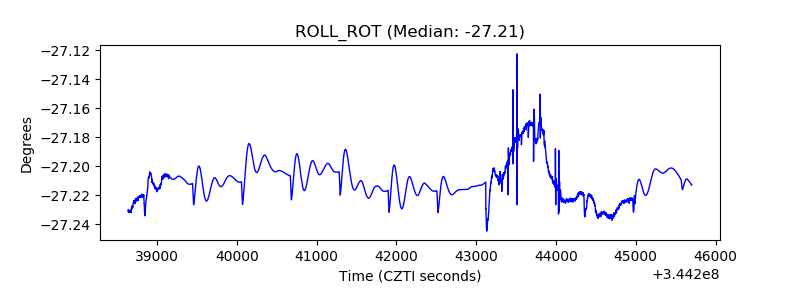 |
| _Roll_DEC | 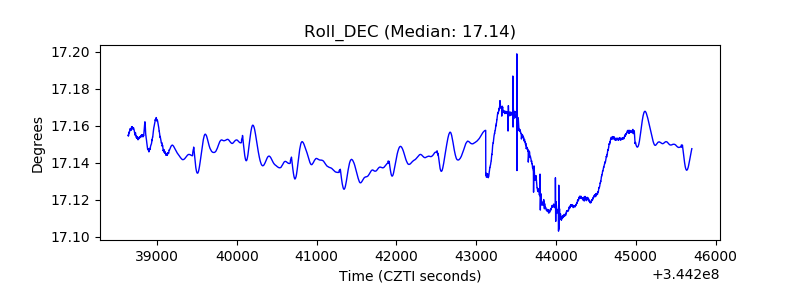 |
| _Roll_RA | 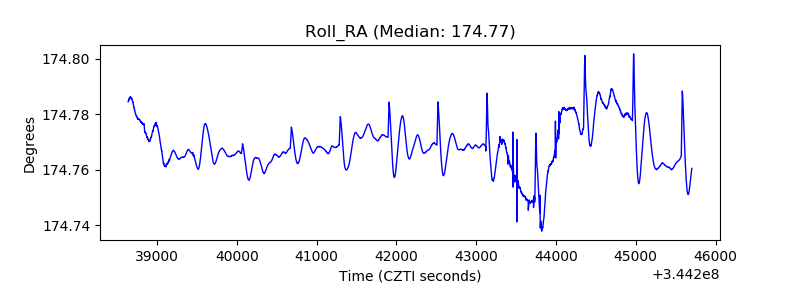 |
| Veto Counter | 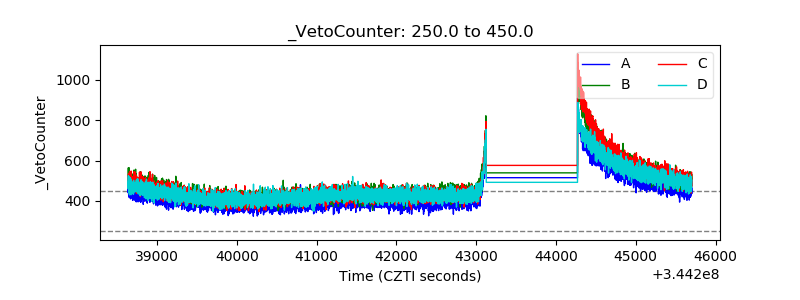 |