| Param | Original file | Final file |
|---|---|---|
| Filename | modeM0/AS1A10_016T01_9000004034_27949cztM0_level2.evt | modeM0/AS1A10_016T01_9000004034_27949cztM0_level2_quad_clean.evt |
| Size (bytes) | 683,628,480 | 86,135,040 |
| Size | 652.0 MB | 82.1 MB |
| Events in quadrant A | 3,100,390 | 590,753 |
| Events in quadrant B | 3,527,614 | 602,154 |
| Events in quadrant C | 3,487,363 | 571,573 |
| Events in quadrant D | 10,186,216 | 427,467 |
| Mode M0 | |||
|---|---|---|---|
| Quadrant | BADHDUFLAG | Total packets | Discarded packets |
| A | 0 | 12615 | 0 |
| B | 0 | 14097 | 0 |
| C | 0 | 13949 | 0 |
| D | 0 | 34427 | 0 |
| Mode M9 | |||
|---|---|---|---|
| Quadrant | BADHDUFLAG | Total packets | Discarded packets |
| A | 0 | 12 | 0 |
| B | 0 | 12 | 0 |
| C | 0 | 12 | 0 |
| D | 0 | 12 | 0 |
| Quadrant | Total seconds | Saturated seconds | Saturation percentage |
|---|---|---|---|
| A | 5950 | 70 | 1.176471% |
| B | 5950 | 87 | 1.462185% |
| C | 5949 | 193 | 3.244243% |
| D | 5949 | 2647 | 44.494873% |
Noise dominated data is calculated using 1-second bins in cleaned event files. If a bin has >2000 counts, and if more than 50% of those come from <1% of pixels, then it is considered to be noise-dominated and hence unusable.
| Quadrant | # 1 sec bins | Bins with >0 counts | Bins with >2000 counts | High rate bins dominated by noise | Noise dominated (total time) | Noise dominated (detector-on time) | Marked lightcurve |
|---|---|---|---|---|---|---|---|
| A | 7150 | 5950 | 0 | 0 | 0.00% | 0.00% | 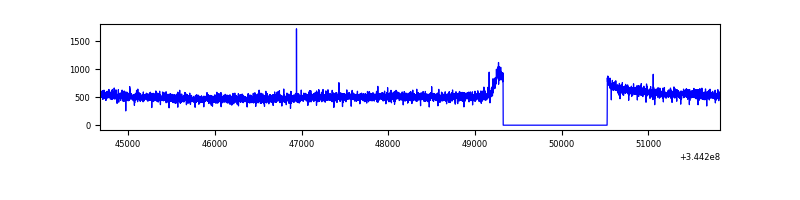 |
| B | 7150 | 5950 | 2 | 2 | 0.03% | 0.03% | 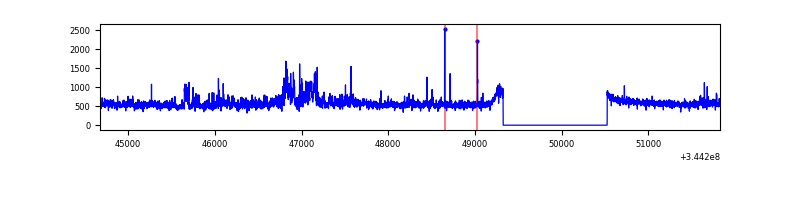 |
| C | 7149 | 5949 | 48 | 48 | 0.67% | 0.81% | 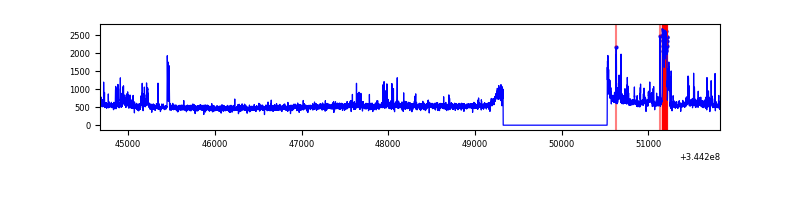 |
| D | 7149 | 5949 | 2543 | 2543 | 35.57% | 42.75% | 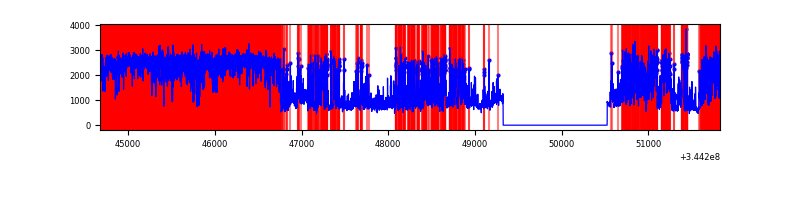 |
Top three noisy pixels from each quadrant. If the there are fewer than three noisy pixels in the level2.evt file, extra rows are filled as -1
| Pixel properties | Quadrant properties | ||||||
|---|---|---|---|---|---|---|---|
| Quadrant | DetID | PixID | Counts | Sigma | Mean | Median | Sigma |
| A | 13 | 254 | 10125 | 57.88 | 802 | 789 | 161.3 |
| A | 3 | 137 | 7113 | 39.21 | 802 | 789 | 161.3 |
| A | 0 | 226 | 6856 | 37.61 | 802 | 789 | 161.3 |
| B | 10 | 245 | 156319 | 1044.0 | 789 | 770 | 149.0 |
| B | 0 | 230 | 130153 | 868.38 | 789 | 770 | 149.0 |
| B | 15 | 32 | 101453 | 675.76 | 789 | 770 | 149.0 |
| C | 3 | 233 | 371855 | 2080.74 | 766 | 773 | 178.3 |
| C | 14 | 238 | 124815 | 695.53 | 766 | 773 | 178.3 |
| C | 13 | 61 | 5204 | 24.85 | 766 | 773 | 178.3 |
| D | 7 | 80 | 5363596 | 34786.23 | 644 | 626 | 154.2 |
| D | 1 | 52 | 1679980 | 10892.92 | 644 | 626 | 154.2 |
| D | 8 | 195 | 594412 | 3851.52 | 644 | 626 | 154.2 |
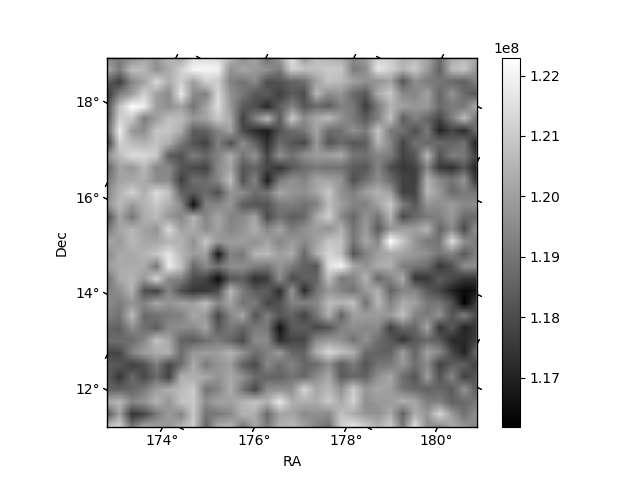
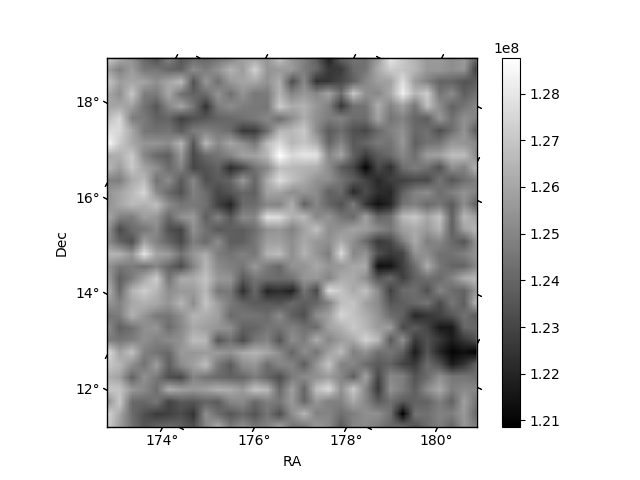
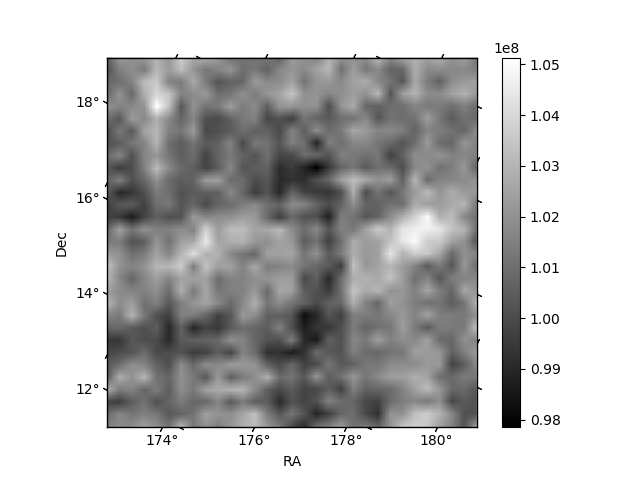
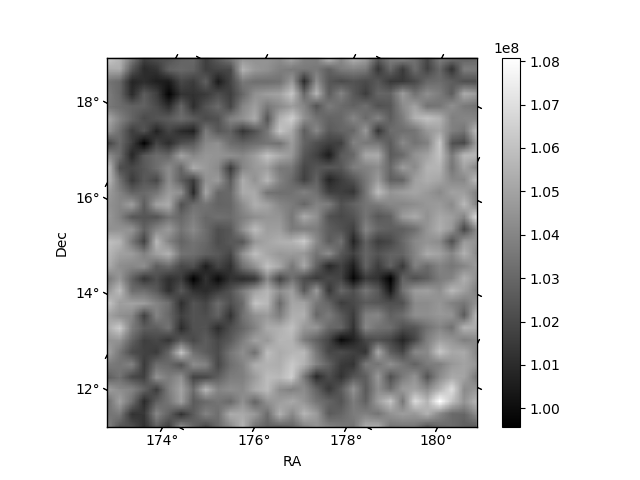
Histogram calculated using DETX and DETY for each event in the final _common_clean file
| Quadrant A | 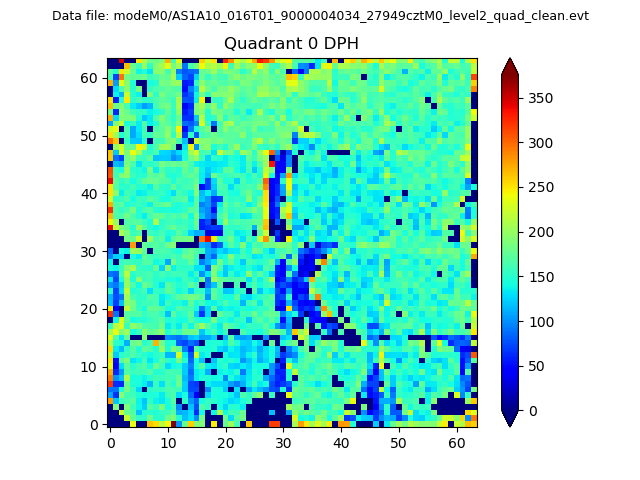 |
 |
Quadrant B |
|---|---|---|---|
| Quadrant D | 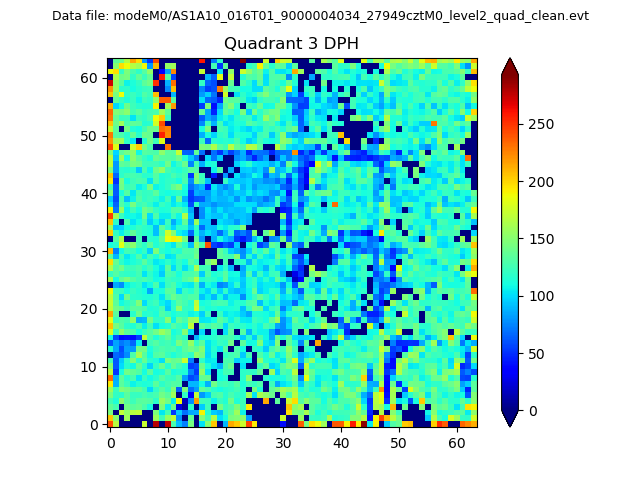 |
 |
Quadrant C |
| Plot type | Count rate plots | Images |
|---|---|---|
| Comparison with Poisson distribution Blue bars denote a histogram of data divided into 1 sec bins. Red curve is a Poisson curve with rate = median count rate of data. |
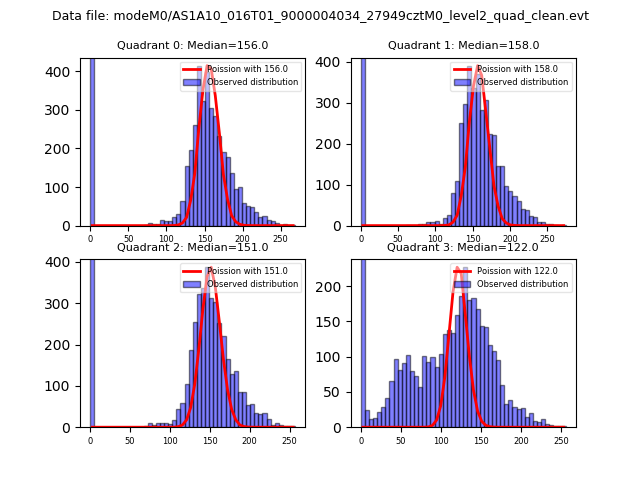 |
 |
| Quadrant-wise count rates Data is divided into 100 sec bins |
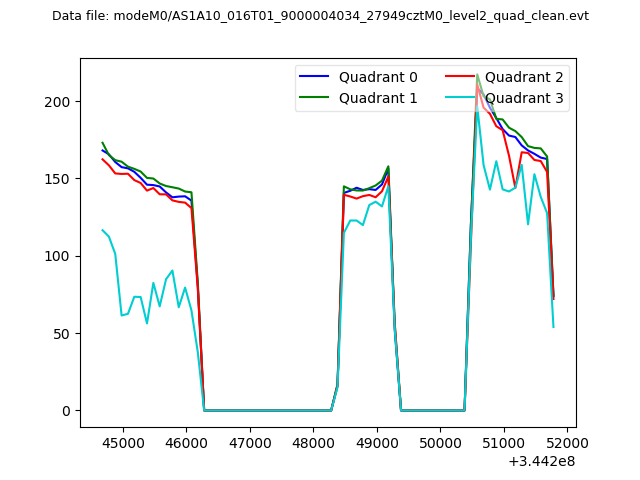 |
|
| Module-wise count rates for Quadrant A Data is divided into 100 sec bins |
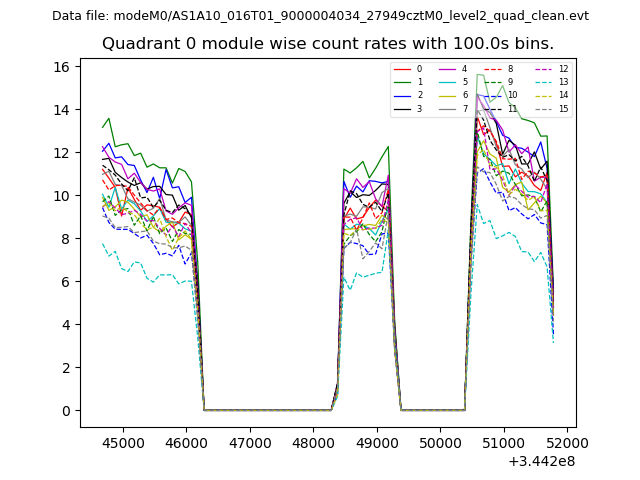 |
 |
| Module-wise count rates for Quadrant B Data is divided into 100 sec bins |
 |
 |
| Module-wise count rates for Quadrant C Data is divided into 100 sec bins |
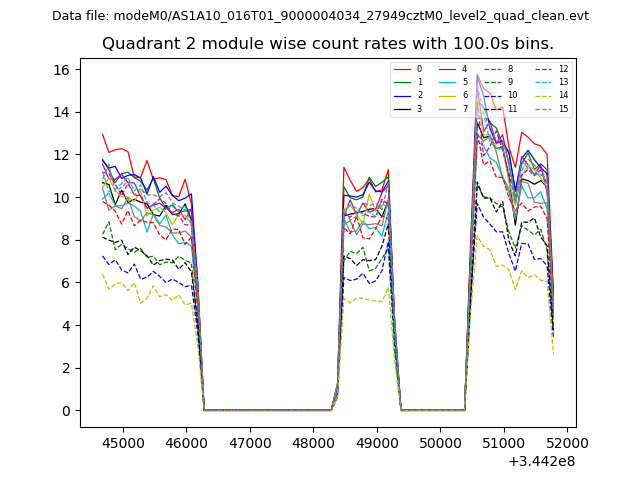 |
 |
| Module-wise count rates for Quadrant D Data is divided into 100 sec bins |
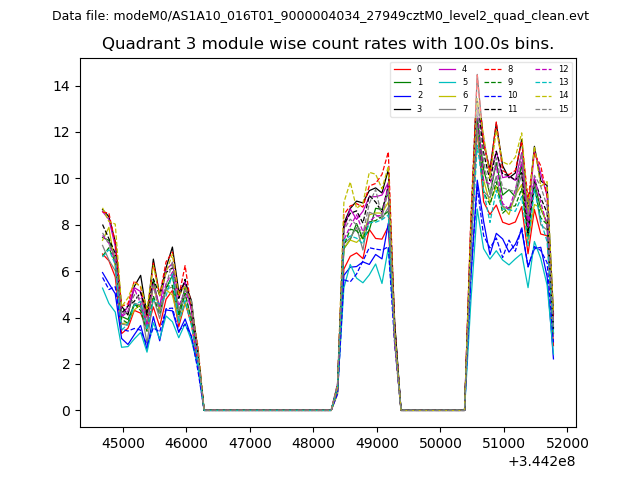 |
 |
| Parameter | Plot |
|---|---|
| CZT HV Monitor | 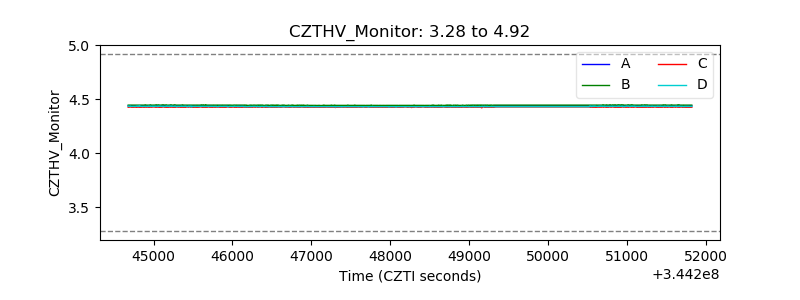 |
| D_VDD | 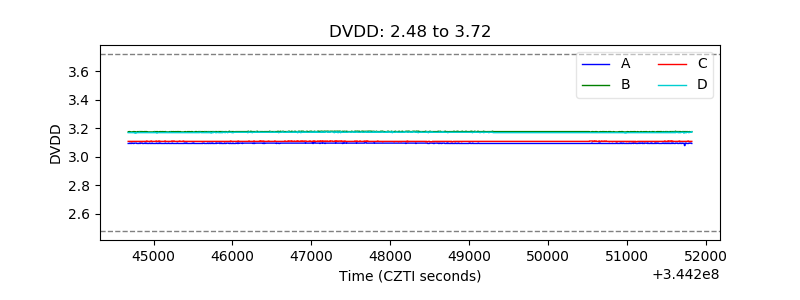 |
| Temperature 1 | 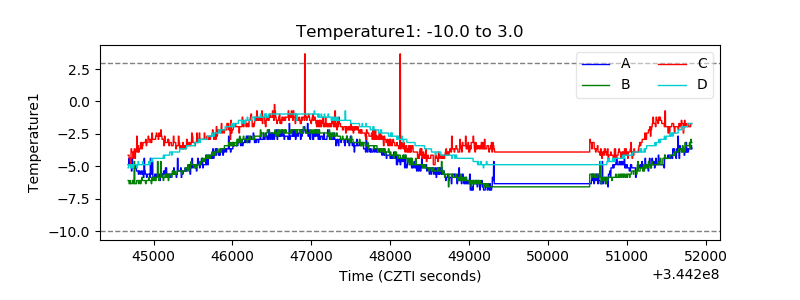 |
| Veto HV Monitor | 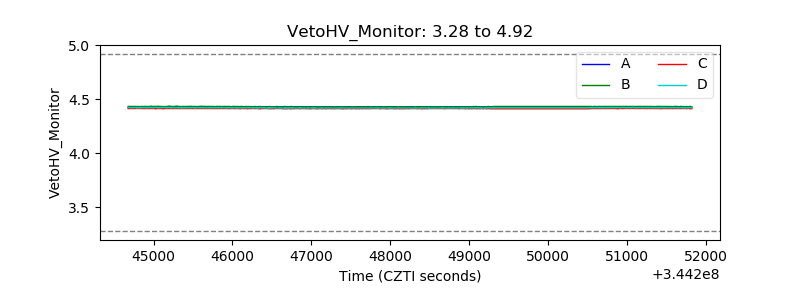 |
| Veto LLD |  |
| Alpha Counter | 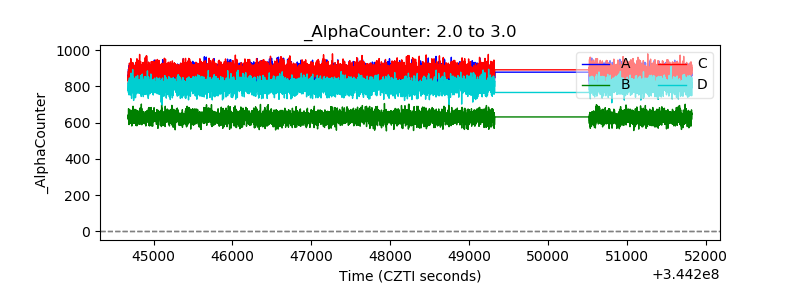 |
| _CPM_Rate | 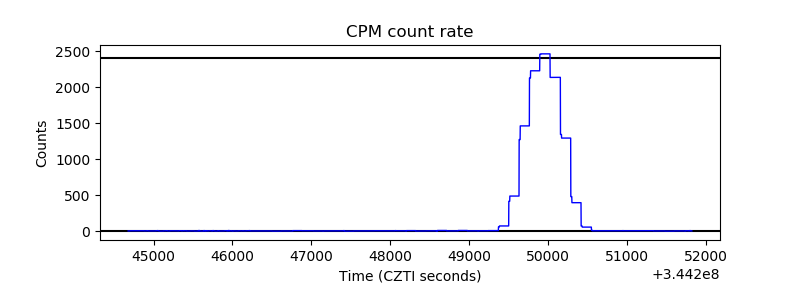 |
| CZT Counter |  |
| +2.5 Volts monitor | 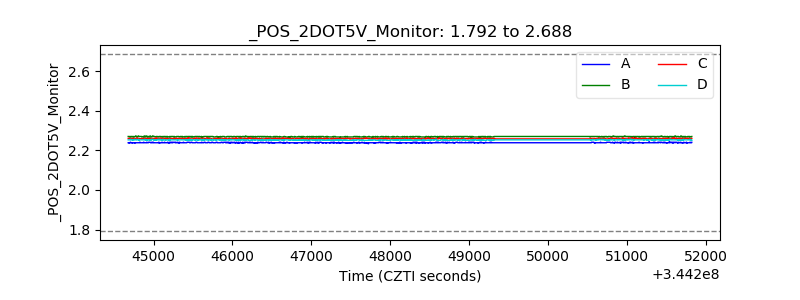 |
| +5 Volts monitor |  |
| _ROLL_ROT | 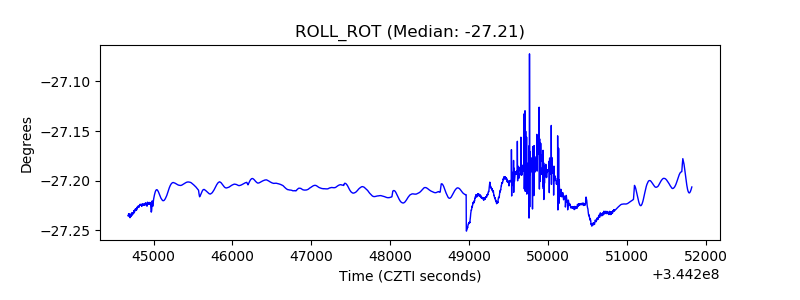 |
| _Roll_DEC | 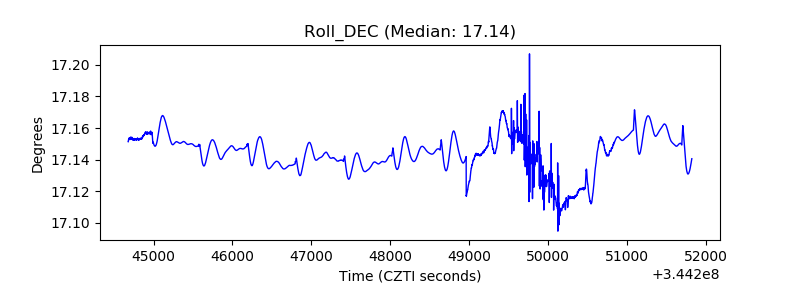 |
| _Roll_RA |  |
| Veto Counter | 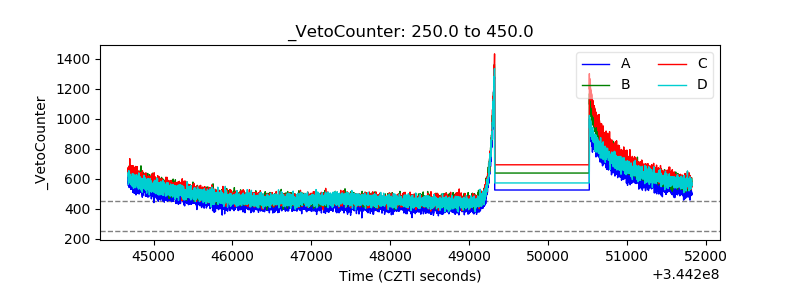 |