| Param | Original file | Final file |
|---|---|---|
| Filename | modeM0/AS1A10_016T01_9000004034_27950cztM0_level2.evt | modeM0/AS1A10_016T01_9000004034_27950cztM0_level2_quad_clean.evt |
| Size (bytes) | 584,069,760 | 92,105,280 |
| Size | 557.0 MB | 87.8 MB |
| Events in quadrant A | 3,223,118 | 613,341 |
| Events in quadrant B | 3,438,824 | 622,904 |
| Events in quadrant C | 3,638,268 | 591,603 |
| Events in quadrant D | 6,988,856 | 548,523 |
| Mode M0 | |||
|---|---|---|---|
| Quadrant | BADHDUFLAG | Total packets | Discarded packets |
| A | 0 | 12914 | 0 |
| B | 0 | 13824 | 0 |
| C | 0 | 14498 | 0 |
| D | 0 | 25102 | 0 |
| Mode M9 | |||
|---|---|---|---|
| Quadrant | BADHDUFLAG | Total packets | Discarded packets |
| A | 0 | 12 | 0 |
| B | 0 | 12 | 0 |
| C | 0 | 12 | 0 |
| D | 0 | 12 | 0 |
| Quadrant | Total seconds | Saturated seconds | Saturation percentage |
|---|---|---|---|
| A | 5899 | 76 | 1.288354% |
| B | 5900 | 75 | 1.271186% |
| C | 5900 | 190 | 3.220339% |
| D | 5900 | 922 | 15.627119% |
Noise dominated data is calculated using 1-second bins in cleaned event files. If a bin has >2000 counts, and if more than 50% of those come from <1% of pixels, then it is considered to be noise-dominated and hence unusable.
| Quadrant | # 1 sec bins | Bins with >0 counts | Bins with >2000 counts | High rate bins dominated by noise | Noise dominated (total time) | Noise dominated (detector-on time) | Marked lightcurve |
|---|---|---|---|---|---|---|---|
| A | 7184 | 5899 | 0 | 0 | 0.00% | 0.00% | 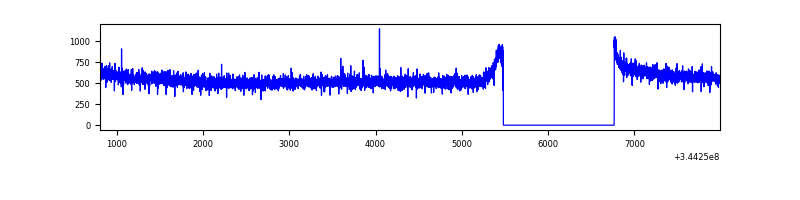 |
| B | 7185 | 5900 | 4 | 4 | 0.06% | 0.07% | 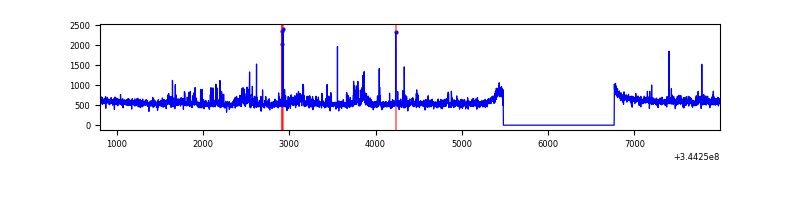 |
| C | 7185 | 5900 | 52 | 52 | 0.72% | 0.88% | 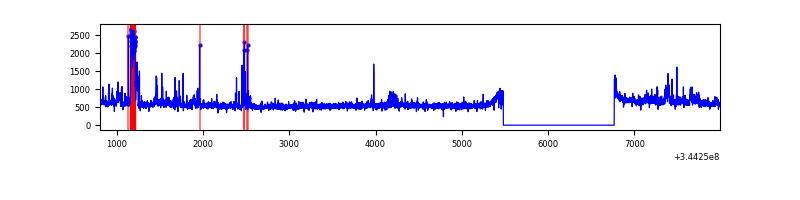 |
| D | 7185 | 5900 | 897 | 897 | 12.48% | 15.20% | 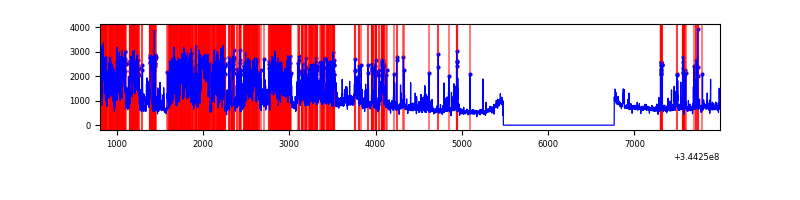 |
Top three noisy pixels from each quadrant. If the there are fewer than three noisy pixels in the level2.evt file, extra rows are filled as -1
| Pixel properties | Quadrant properties | ||||||
|---|---|---|---|---|---|---|---|
| Quadrant | DetID | PixID | Counts | Sigma | Mean | Median | Sigma |
| A | 13 | 254 | 9438 | 51.83 | 835 | 822 | 166.2 |
| A | 0 | 226 | 7188 | 38.3 | 835 | 822 | 166.2 |
| A | 3 | 137 | 7146 | 38.04 | 835 | 822 | 166.2 |
| B | 10 | 245 | 137654 | 907.2 | 818 | 802 | 150.9 |
| B | 0 | 230 | 49634 | 323.71 | 818 | 802 | 150.9 |
| B | 12 | 111 | 17955 | 113.71 | 818 | 802 | 150.9 |
| C | 3 | 233 | 364419 | 1978.0 | 797 | 807 | 183.8 |
| C | 14 | 238 | 135073 | 730.39 | 797 | 807 | 183.8 |
| C | 2 | 16 | 20033 | 104.59 | 797 | 807 | 183.8 |
| D | 7 | 80 | 2155831 | 11643.74 | 781 | 762 | 185.1 |
| D | 1 | 52 | 791462 | 4272.12 | 781 | 762 | 185.1 |
| D | 8 | 195 | 758528 | 4094.18 | 781 | 762 | 185.1 |
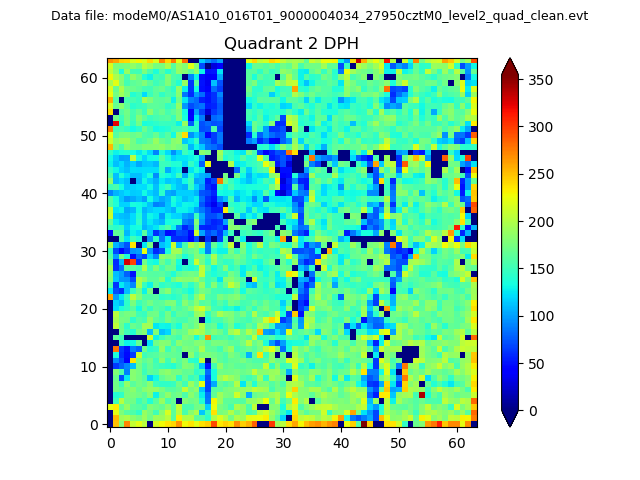
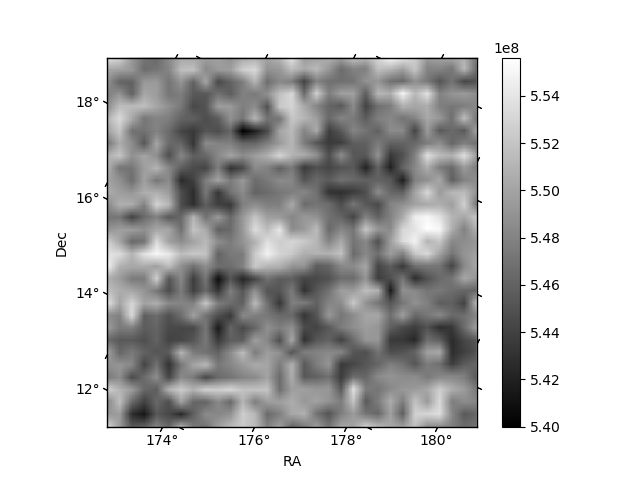
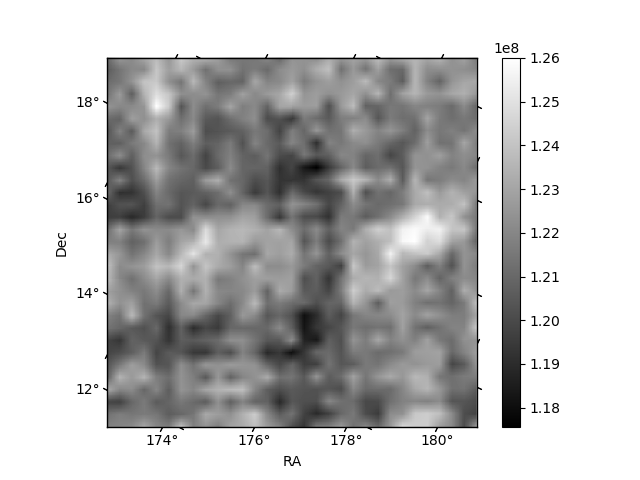
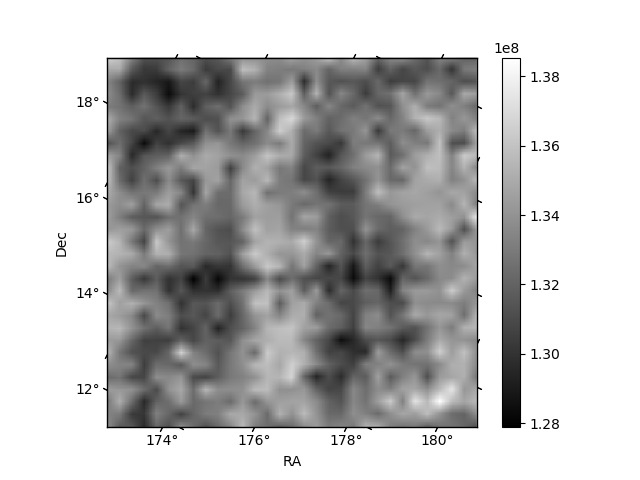
Histogram calculated using DETX and DETY for each event in the final _common_clean file
| Quadrant A | 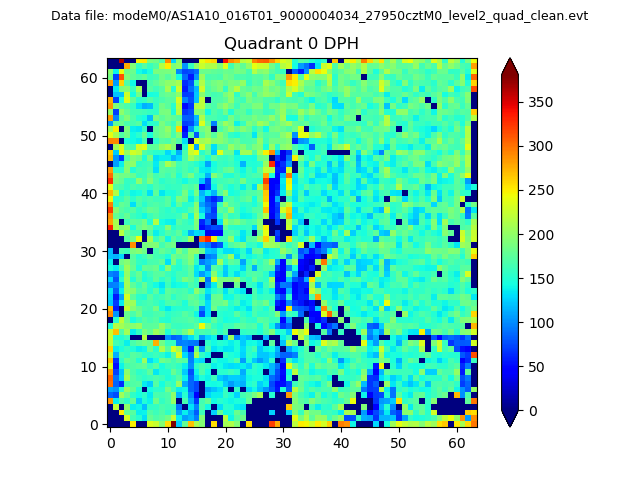 |
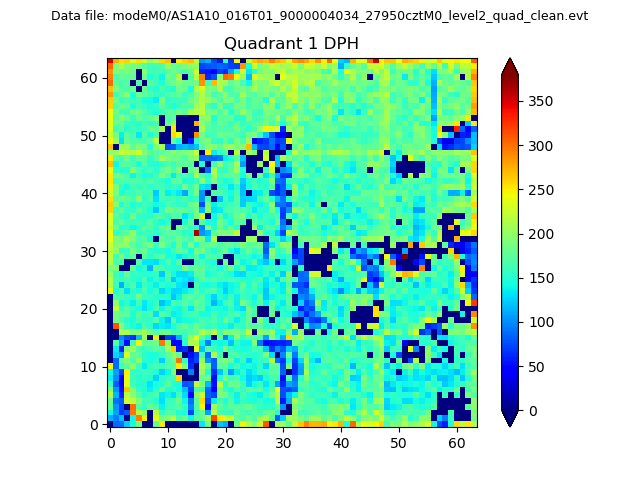 |
Quadrant B |
|---|---|---|---|
| Quadrant D | 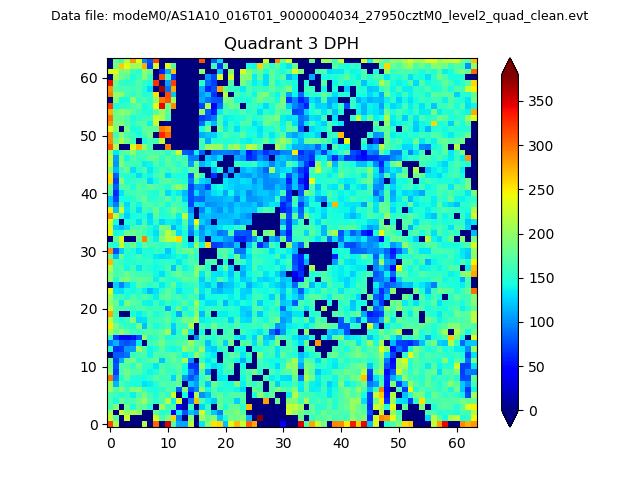 |
 |
Quadrant C |
| Plot type | Count rate plots | Images |
|---|---|---|
| Comparison with Poisson distribution Blue bars denote a histogram of data divided into 1 sec bins. Red curve is a Poisson curve with rate = median count rate of data. |
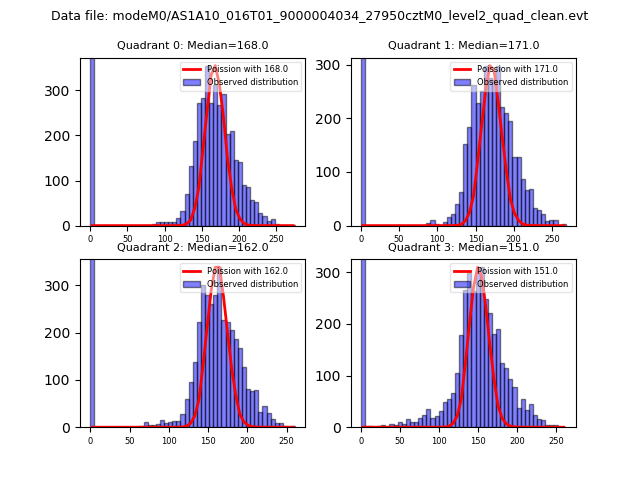 |
 |
| Quadrant-wise count rates Data is divided into 100 sec bins |
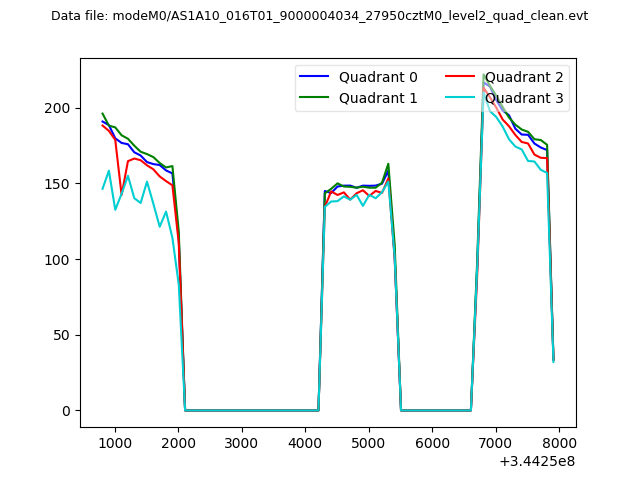 |
|
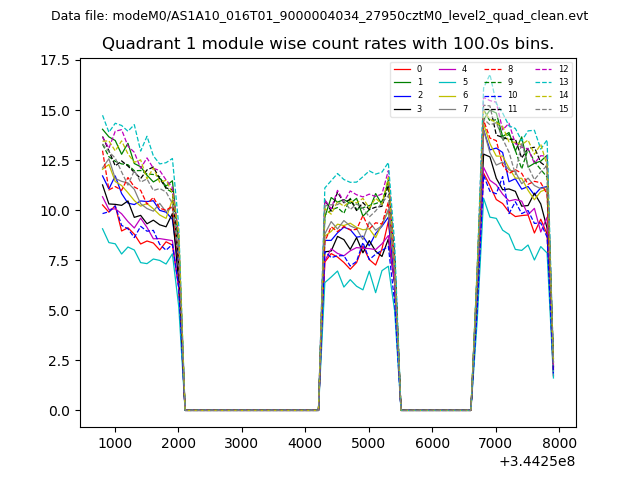
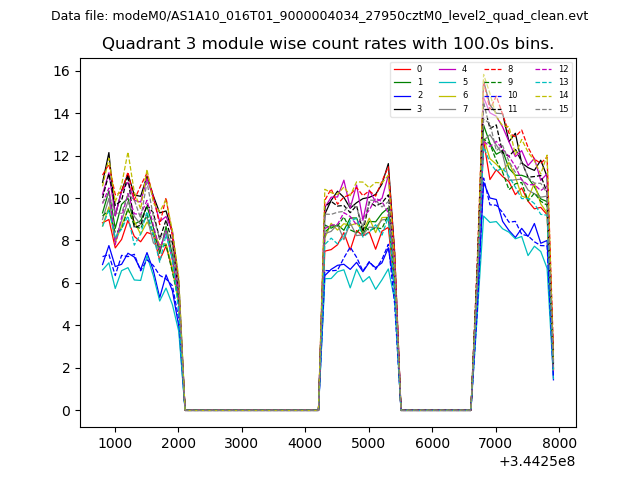
| Module-wise count rates for Quadrant A Data is divided into 100 sec bins |
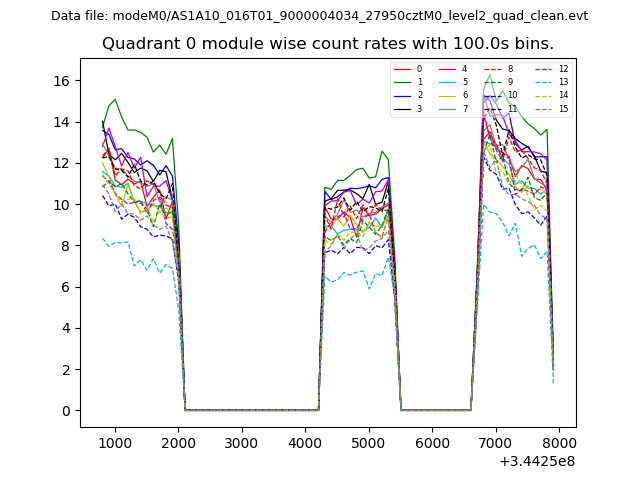 |
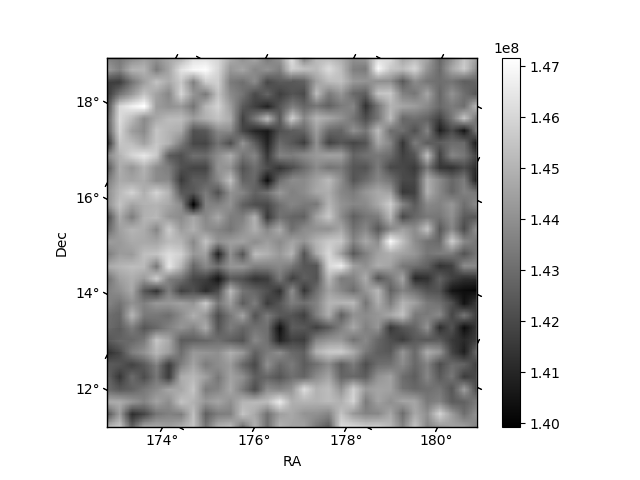 |
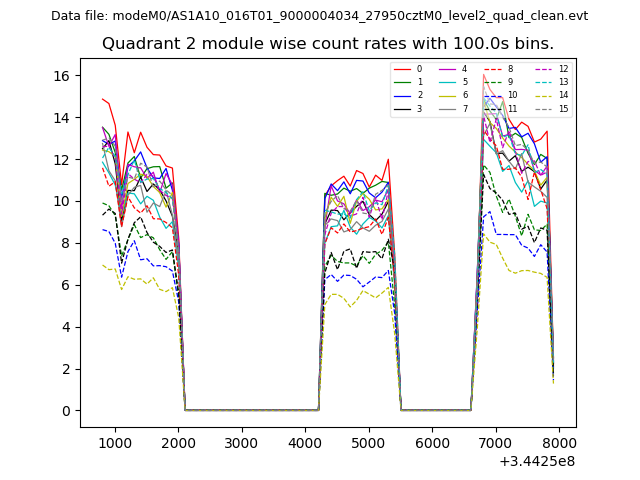
| Module-wise count rates for Quadrant B Data is divided into 100 sec bins |
 |
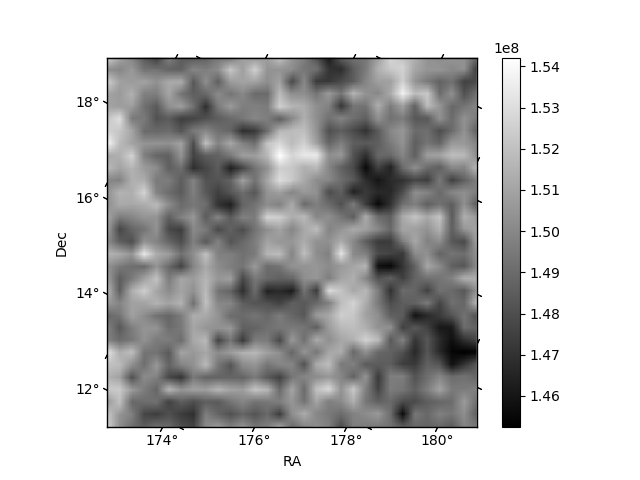 |
| Module-wise count rates for Quadrant C Data is divided into 100 sec bins |
 |
 |
| Module-wise count rates for Quadrant D Data is divided into 100 sec bins |
 |
 |
| Parameter | Plot |
|---|---|
| CZT HV Monitor |  |
| D_VDD | 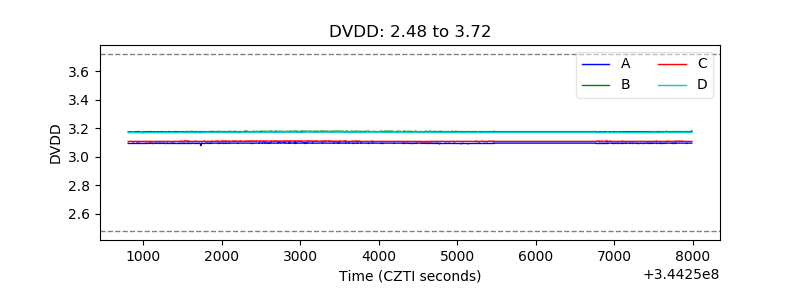 |
| Temperature 1 | 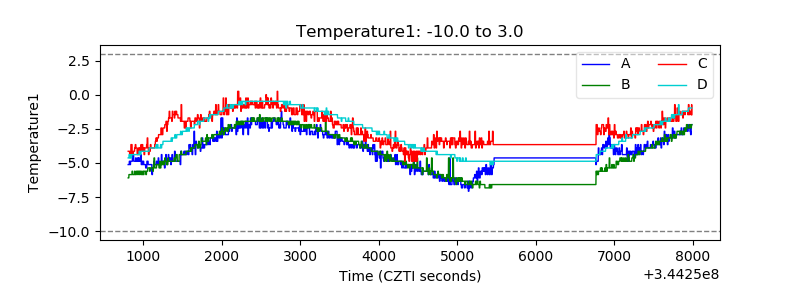 |
| Veto HV Monitor | 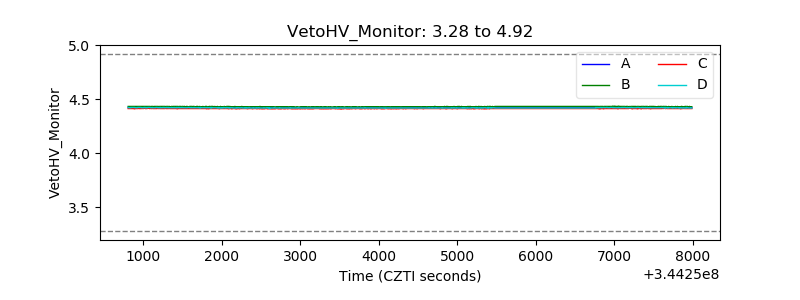 |
| Veto LLD | 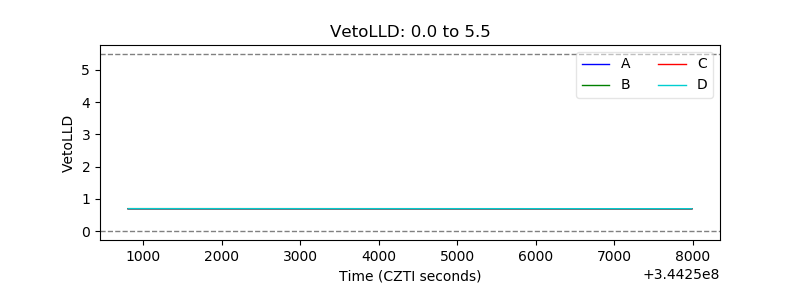 |
| Alpha Counter | 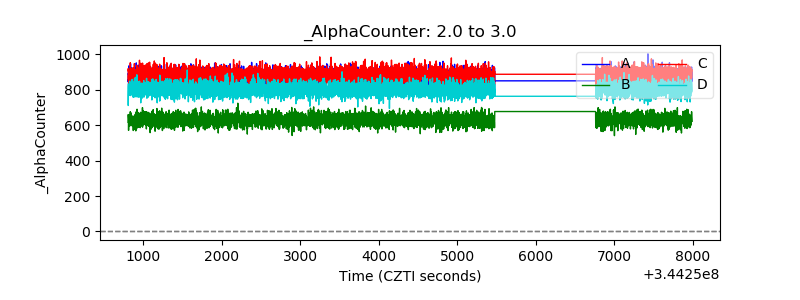 |
| _CPM_Rate | 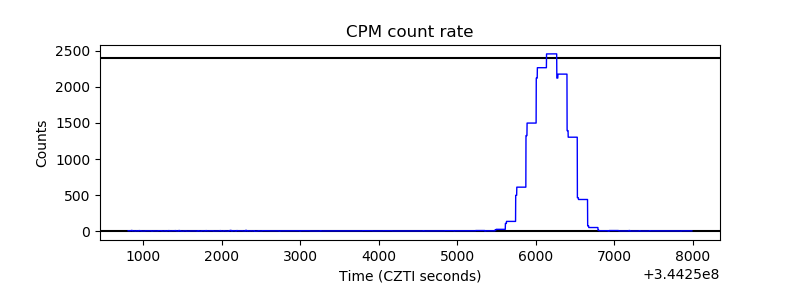 |
| CZT Counter | 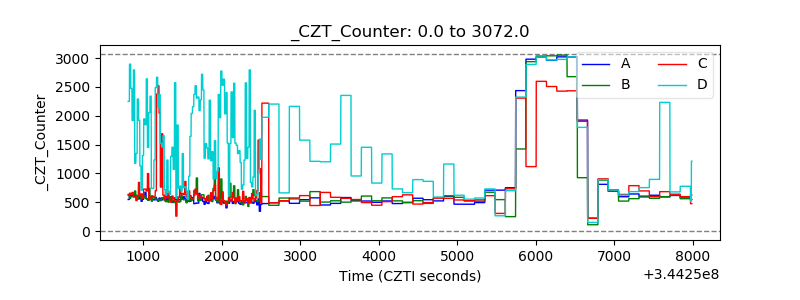 |
| +2.5 Volts monitor | 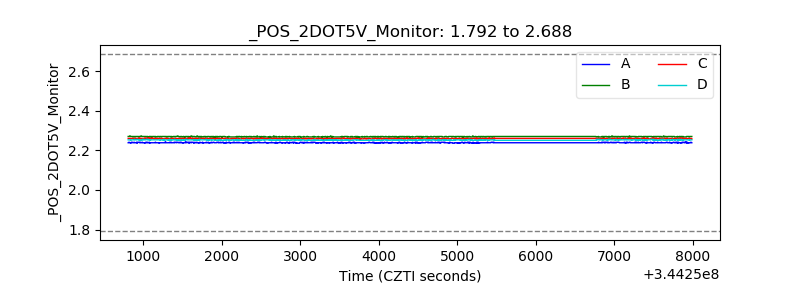 |
| +5 Volts monitor |  |
| _ROLL_ROT | 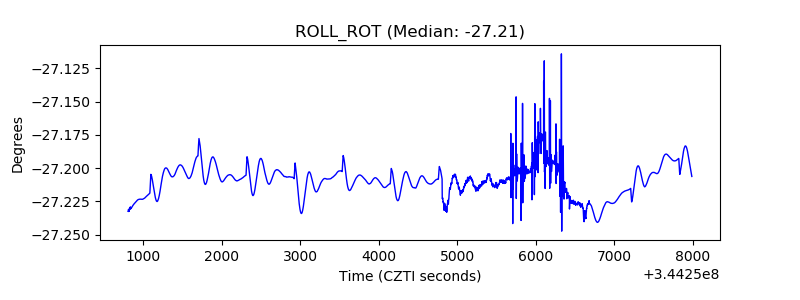 |
| _Roll_DEC | 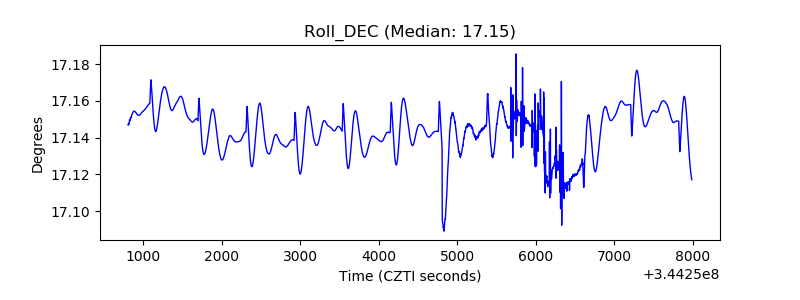 |
| _Roll_RA | 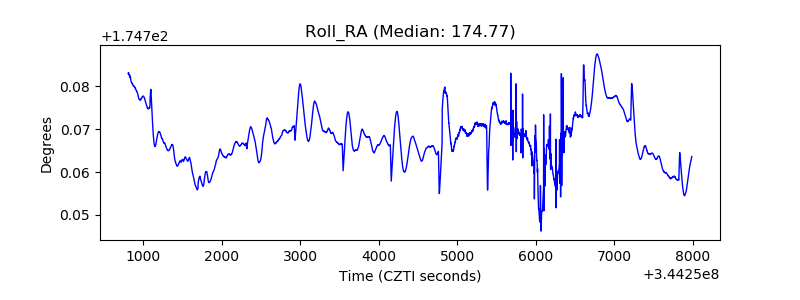 |
| Veto Counter | 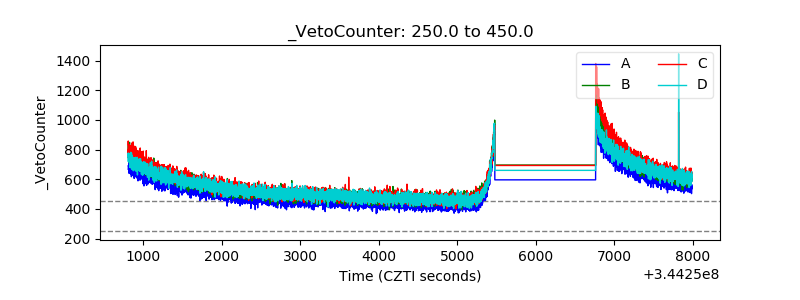 |