| Param | Original file | Final file |
|---|---|---|
| Filename | modeM0/AS1A10_016T01_9000004034_27951cztM0_level2.evt | modeM0/AS1A10_016T01_9000004034_27951cztM0_level2_quad_clean.evt |
| Size (bytes) | 563,192,640 | 81,809,280 |
| Size | 537.1 MB | 78.0 MB |
| Events in quadrant A | 3,250,509 | 531,818 |
| Events in quadrant B | 3,434,223 | 538,169 |
| Events in quadrant C | 3,719,527 | 519,178 |
| Events in quadrant D | 6,255,228 | 478,173 |
| Mode M0 | |||
|---|---|---|---|
| Quadrant | BADHDUFLAG | Total packets | Discarded packets |
| A | 0 | 13060 | 0 |
| B | 0 | 13838 | 0 |
| C | 0 | 14991 | 0 |
| D | 0 | 23084 | 0 |
| Mode M9 | |||
|---|---|---|---|
| Quadrant | BADHDUFLAG | Total packets | Discarded packets |
| A | 0 | 14 | 0 |
| B | 0 | 14 | 0 |
| C | 0 | 14 | 0 |
| D | 0 | 14 | 0 |
| Quadrant | Total seconds | Saturated seconds | Saturation percentage |
|---|---|---|---|
| A | 5862 | 55 | 0.938246% |
| B | 5863 | 62 | 1.057479% |
| C | 5863 | 148 | 2.524305% |
| D | 5863 | 676 | 11.529933% |
Noise dominated data is calculated using 1-second bins in cleaned event files. If a bin has >2000 counts, and if more than 50% of those come from <1% of pixels, then it is considered to be noise-dominated and hence unusable.
| Quadrant | # 1 sec bins | Bins with >0 counts | Bins with >2000 counts | High rate bins dominated by noise | Noise dominated (total time) | Noise dominated (detector-on time) | Marked lightcurve |
|---|---|---|---|---|---|---|---|
| A | 7222 | 5862 | 0 | 0 | 0.00% | 0.00% | 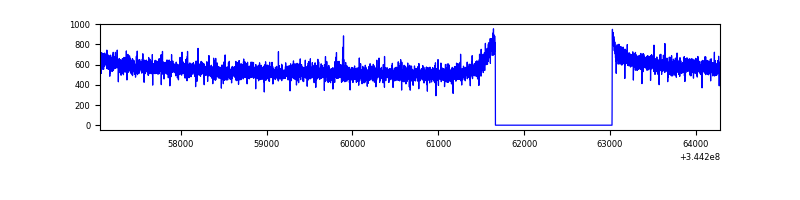 |
| B | 7223 | 5863 | 16 | 16 | 0.22% | 0.27% | 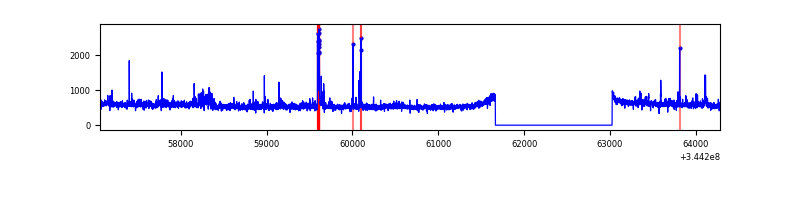 |
| C | 7223 | 5864 | 35 | 35 | 0.48% | 0.60% | 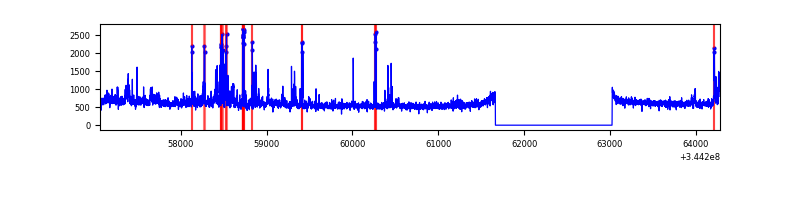 |
| D | 7223 | 5863 | 650 | 650 | 9.00% | 11.09% | 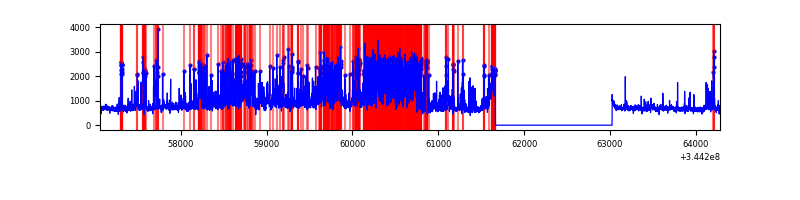 |
Top three noisy pixels from each quadrant. If the there are fewer than three noisy pixels in the level2.evt file, extra rows are filled as -1
| Pixel properties | Quadrant properties | ||||||
|---|---|---|---|---|---|---|---|
| Quadrant | DetID | PixID | Counts | Sigma | Mean | Median | Sigma |
| A | 13 | 254 | 9950 | 54.33 | 841 | 828 | 167.9 |
| A | 0 | 226 | 7442 | 39.39 | 841 | 828 | 167.9 |
| A | 3 | 137 | 6946 | 36.44 | 841 | 828 | 167.9 |
| B | 0 | 230 | 67107 | 435.77 | 823 | 806 | 152.1 |
| B | 15 | 32 | 48221 | 311.64 | 823 | 806 | 152.1 |
| B | 10 | 245 | 32705 | 209.66 | 823 | 806 | 152.1 |
| C | 3 | 233 | 410834 | 2224.83 | 804 | 813 | 184.3 |
| C | 14 | 238 | 134755 | 726.79 | 804 | 813 | 184.3 |
| C | 2 | 16 | 38257 | 203.18 | 804 | 813 | 184.3 |
| D | 7 | 80 | 1250491 | 6790.76 | 787 | 770 | 184.0 |
| D | 1 | 52 | 1033552 | 5611.95 | 787 | 770 | 184.0 |
| D | 8 | 195 | 715258 | 3882.4 | 787 | 770 | 184.0 |
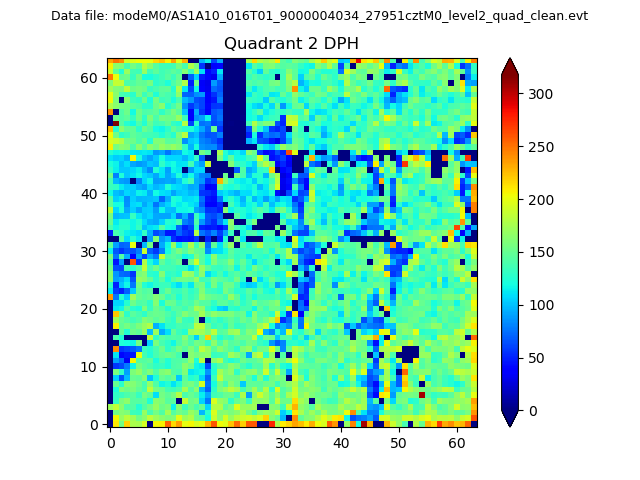
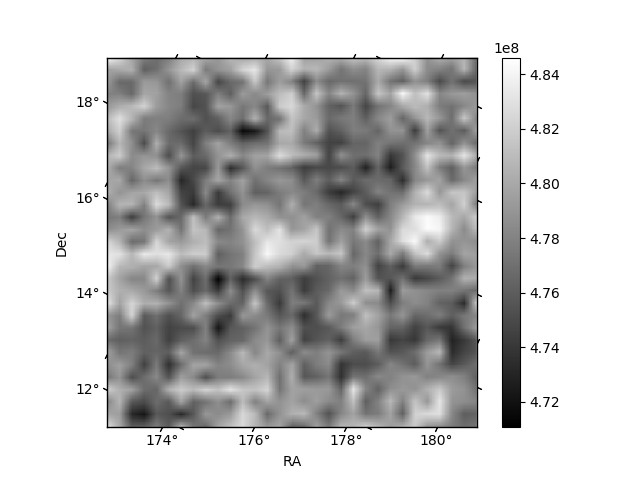
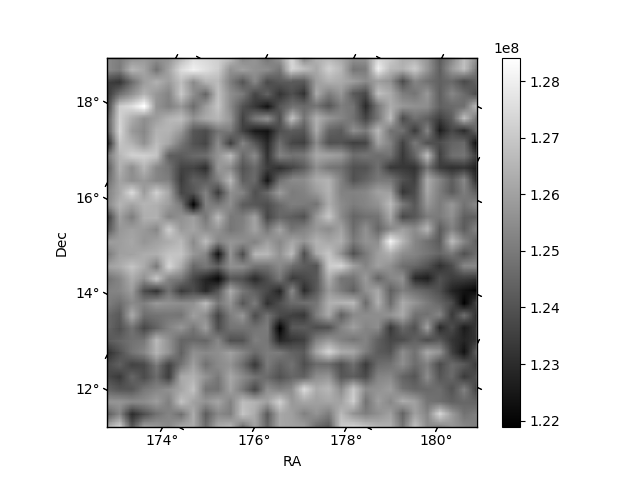
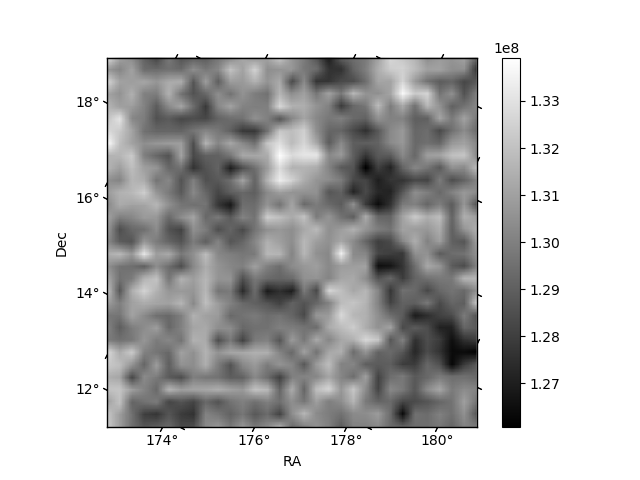
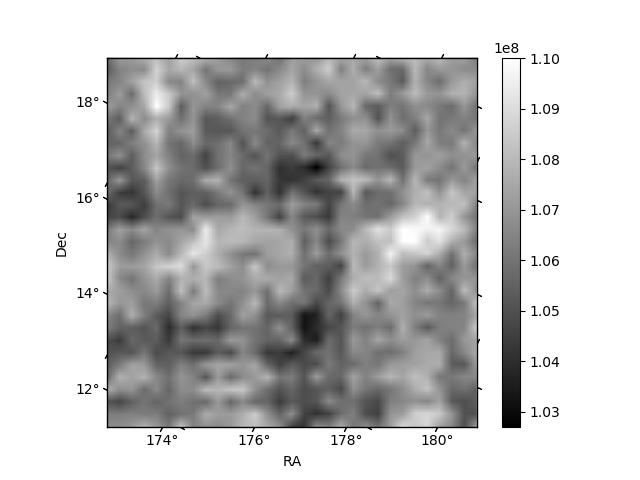
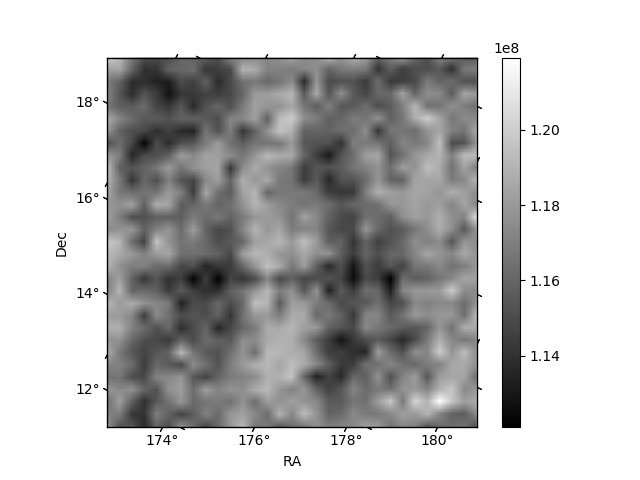
Histogram calculated using DETX and DETY for each event in the final _common_clean file
| Quadrant A | 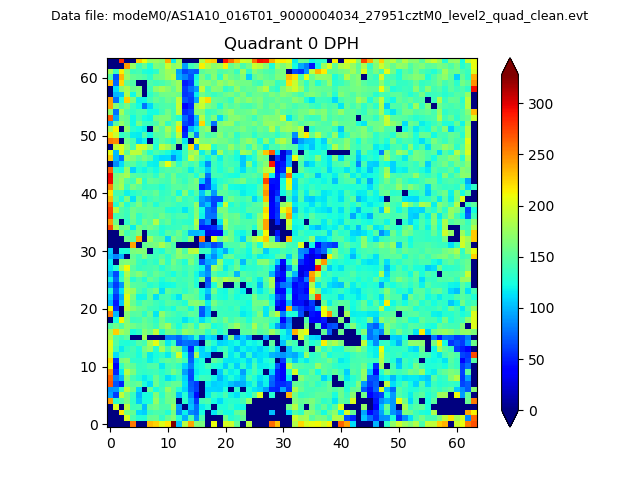 |
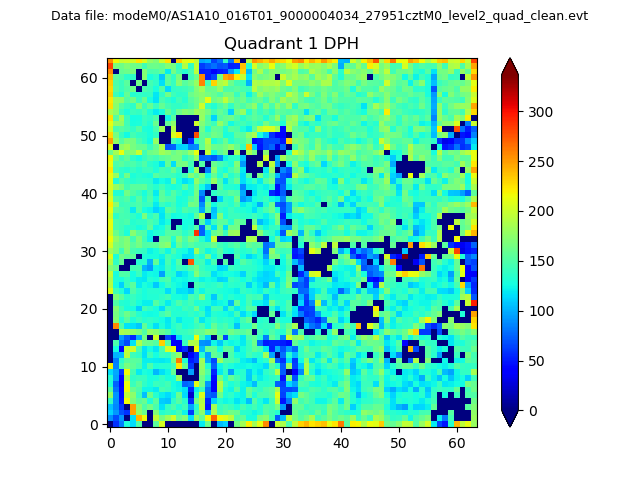 |
Quadrant B |
|---|---|---|---|
| Quadrant D | 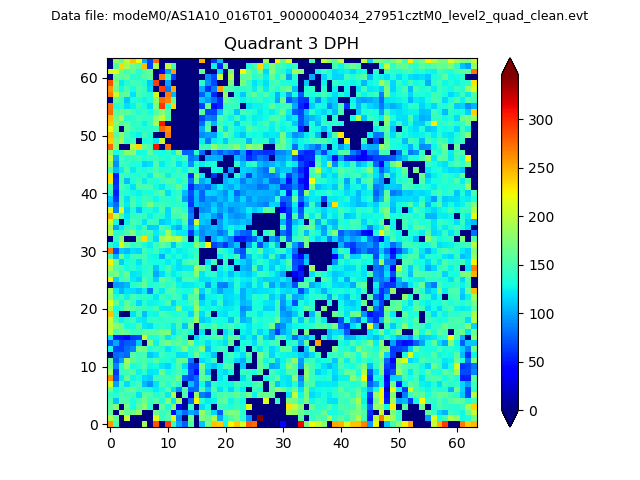 |
 |
Quadrant C |
| Plot type | Count rate plots | Images |
|---|---|---|
| Comparison with Poisson distribution Blue bars denote a histogram of data divided into 1 sec bins. Red curve is a Poisson curve with rate = median count rate of data. |
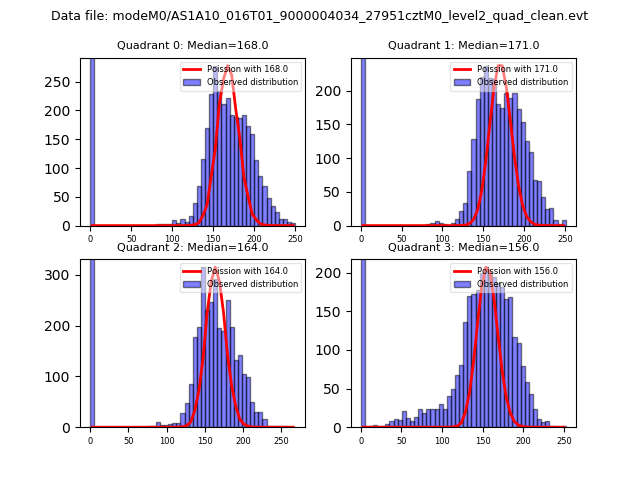 |
 |
| Quadrant-wise count rates Data is divided into 100 sec bins |
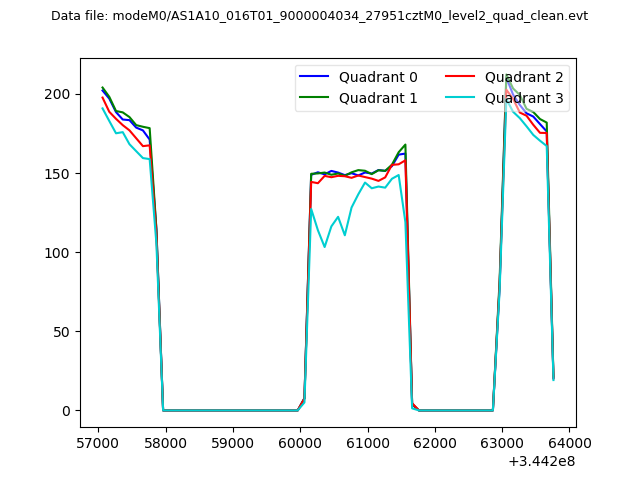 |
|
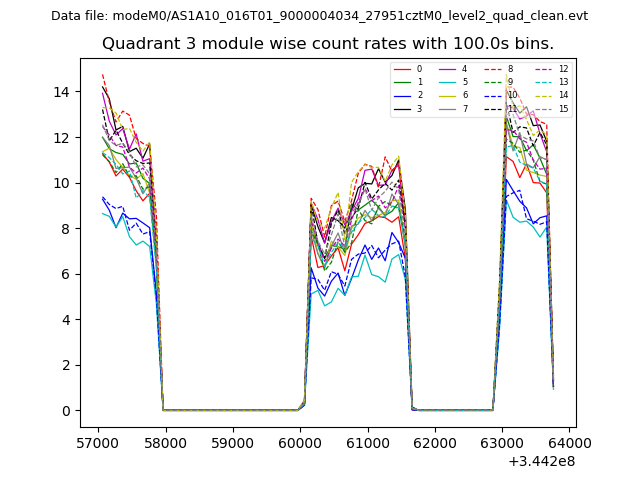
| Module-wise count rates for Quadrant A Data is divided into 100 sec bins |
 |
 |
| Module-wise count rates for Quadrant B Data is divided into 100 sec bins |
 |
 |
| Module-wise count rates for Quadrant C Data is divided into 100 sec bins |
 |
 |
| Module-wise count rates for Quadrant D Data is divided into 100 sec bins |
 |
 |
| Parameter | Plot |
|---|---|
| CZT HV Monitor | 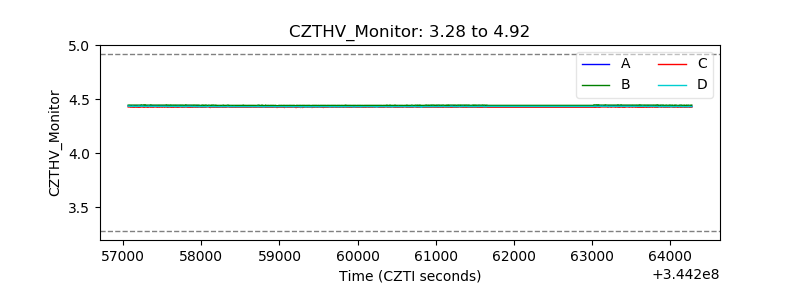 |
| D_VDD | 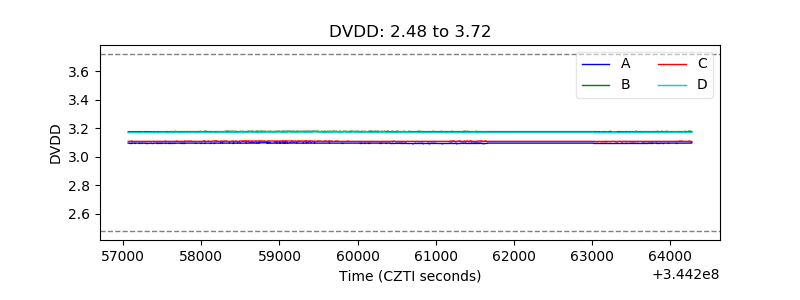 |
| Temperature 1 | 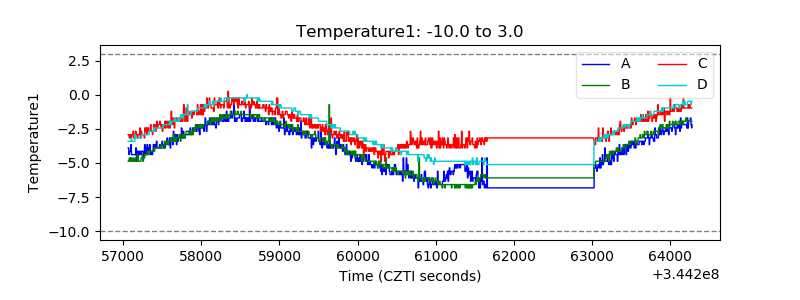 |
| Veto HV Monitor | 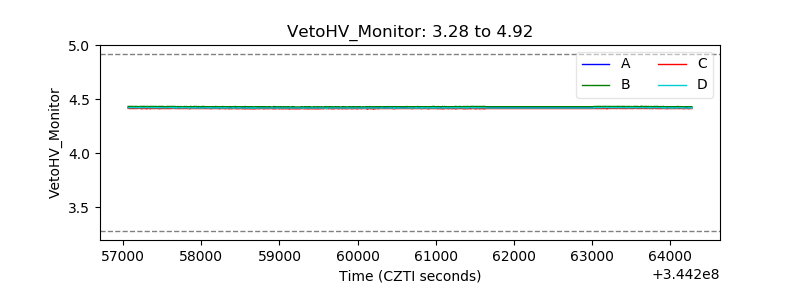 |
| Veto LLD | 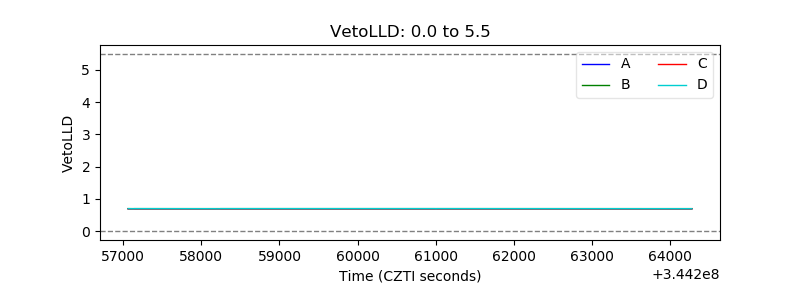 |
| Alpha Counter | 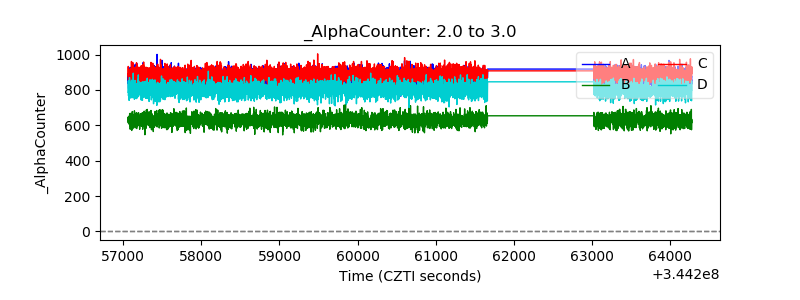 |
| _CPM_Rate | 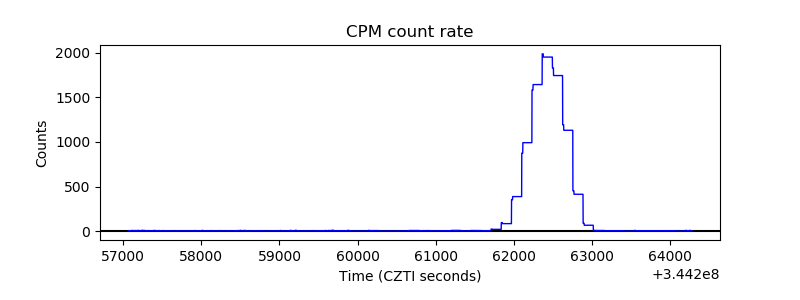 |
| CZT Counter | 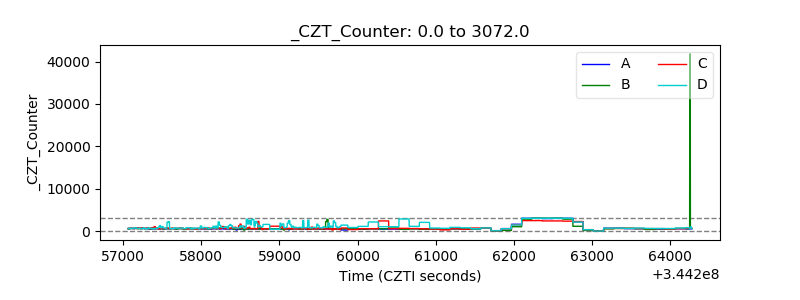 |
| +2.5 Volts monitor |  |
| +5 Volts monitor |  |
| _ROLL_ROT | 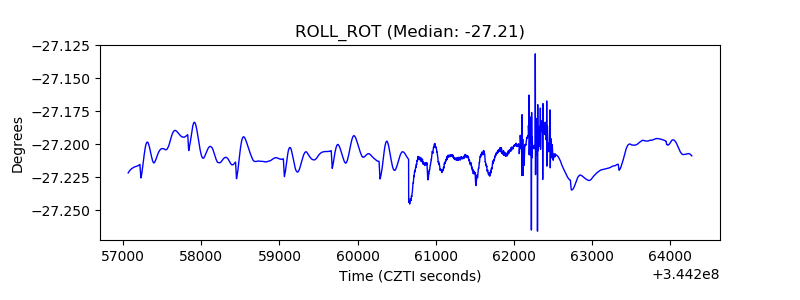 |
| _Roll_DEC | 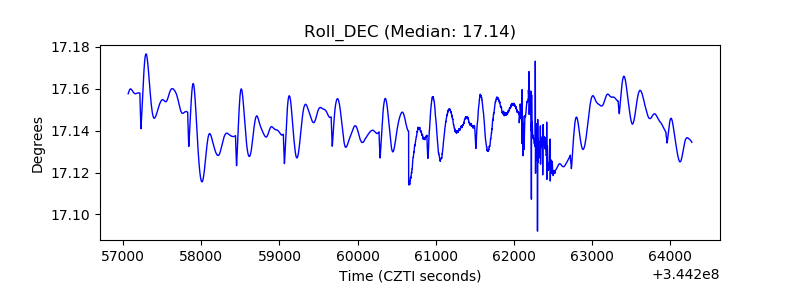 |
| _Roll_RA | 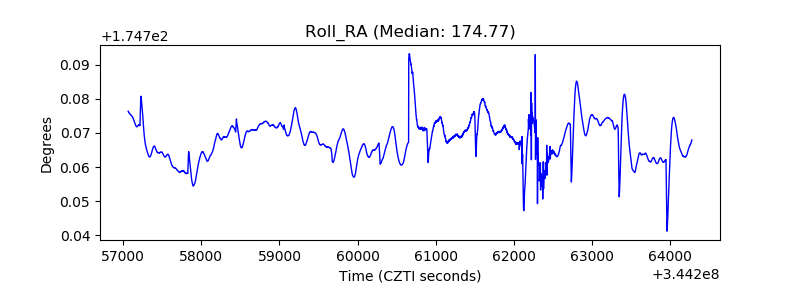 |
| Veto Counter | 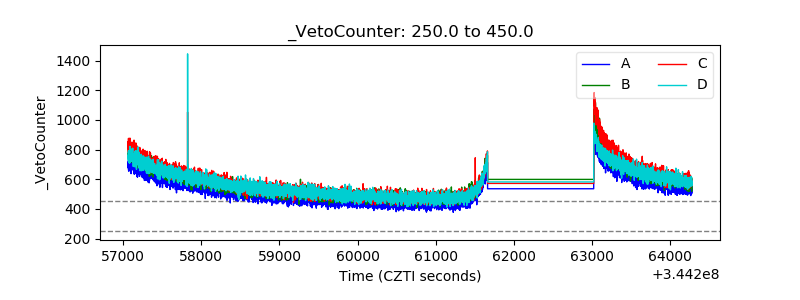 |