| Param | Original file | Final file |
|---|---|---|
| Filename | modeM0/AS1A10_016T01_9000004034_27952cztM0_level2.evt | modeM0/AS1A10_016T01_9000004034_27952cztM0_level2_quad_clean.evt |
| Size (bytes) | 590,688,000 | 80,254,080 |
| Size | 563.3 MB | 76.5 MB |
| Events in quadrant A | 3,484,713 | 507,118 |
| Events in quadrant B | 3,664,104 | 513,280 |
| Events in quadrant C | 3,758,563 | 494,171 |
| Events in quadrant D | 6,552,736 | 473,567 |
| Mode M0 | |||
|---|---|---|---|
| Quadrant | BADHDUFLAG | Total packets | Discarded packets |
| A | 0 | 14069 | 0 |
| B | 0 | 14809 | 0 |
| C | 0 | 15143 | 0 |
| D | 0 | 24372 | 0 |
| Mode M9 | |||
|---|---|---|---|
| Quadrant | BADHDUFLAG | Total packets | Discarded packets |
| A | 0 | 14 | 0 |
| B | 0 | 15 | 0 |
| C | 0 | 15 | 0 |
| D | 0 | 15 | 0 |
| Quadrant | Total seconds | Saturated seconds | Saturation percentage |
|---|---|---|---|
| A | 6329 | 92 | 1.453626% |
| B | 6329 | 107 | 1.690630% |
| C | 6329 | 164 | 2.591247% |
| D | 6329 | 1055 | 16.669300% |
Noise dominated data is calculated using 1-second bins in cleaned event files. If a bin has >2000 counts, and if more than 50% of those come from <1% of pixels, then it is considered to be noise-dominated and hence unusable.
| Quadrant | # 1 sec bins | Bins with >0 counts | Bins with >2000 counts | High rate bins dominated by noise | Noise dominated (total time) | Noise dominated (detector-on time) | Marked lightcurve |
|---|---|---|---|---|---|---|---|
| A | 7594 | 6329 | 0 | 0 | 0.00% | 0.00% | 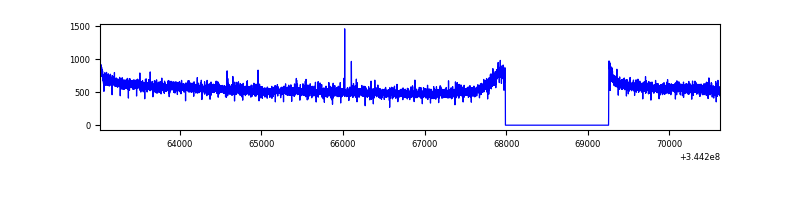 |
| B | 7594 | 6329 | 6 | 6 | 0.08% | 0.09% | 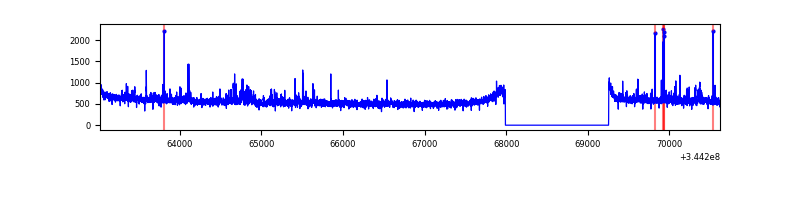 |
| C | 7594 | 6329 | 14 | 14 | 0.18% | 0.22% | 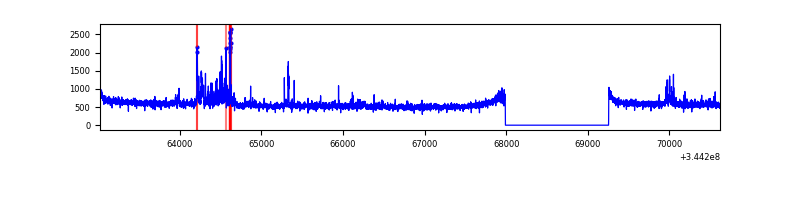 |
| D | 7594 | 6329 | 951 | 951 | 12.52% | 15.03% | 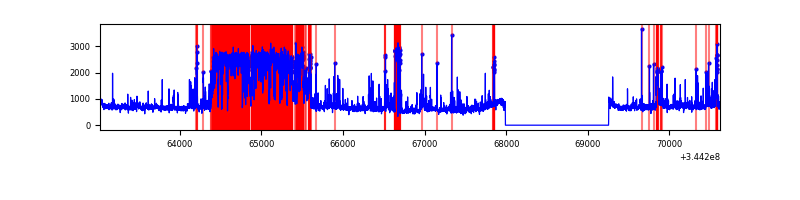 |
Top three noisy pixels from each quadrant. If the there are fewer than three noisy pixels in the level2.evt file, extra rows are filled as -1
| Pixel properties | Quadrant properties | ||||||
|---|---|---|---|---|---|---|---|
| Quadrant | DetID | PixID | Counts | Sigma | Mean | Median | Sigma |
| A | 13 | 254 | 11052 | 57.08 | 900 | 883 | 178.2 |
| A | 0 | 226 | 7865 | 39.19 | 900 | 883 | 178.2 |
| A | 3 | 137 | 7708 | 38.31 | 900 | 883 | 178.2 |
| B | 10 | 245 | 116847 | 701.16 | 884 | 865 | 165.4 |
| B | 0 | 230 | 46118 | 273.57 | 884 | 865 | 165.4 |
| B | 0 | 229 | 19521 | 112.78 | 884 | 865 | 165.4 |
| C | 3 | 233 | 238786 | 1191.35 | 866 | 876 | 199.7 |
| C | 14 | 238 | 141762 | 705.49 | 866 | 876 | 199.7 |
| C | 13 | 61 | 5944 | 25.38 | 866 | 876 | 199.7 |
| D | 12 | 233 | 1972894 | 10122.72 | 814 | 795 | 194.8 |
| D | 8 | 195 | 632952 | 3244.84 | 814 | 795 | 194.8 |
| D | 2 | 250 | 380211 | 1947.53 | 814 | 795 | 194.8 |
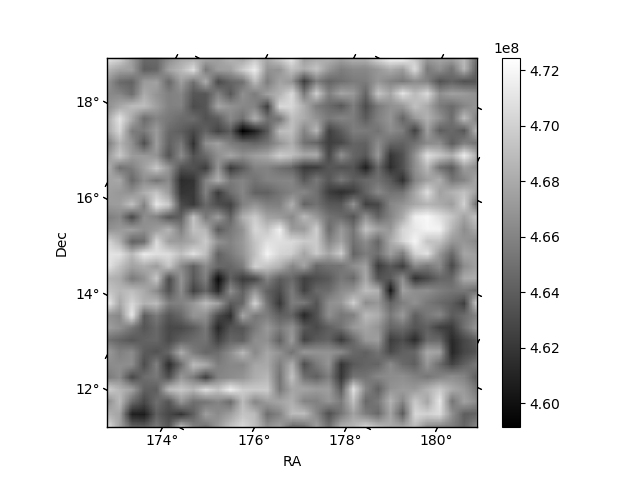
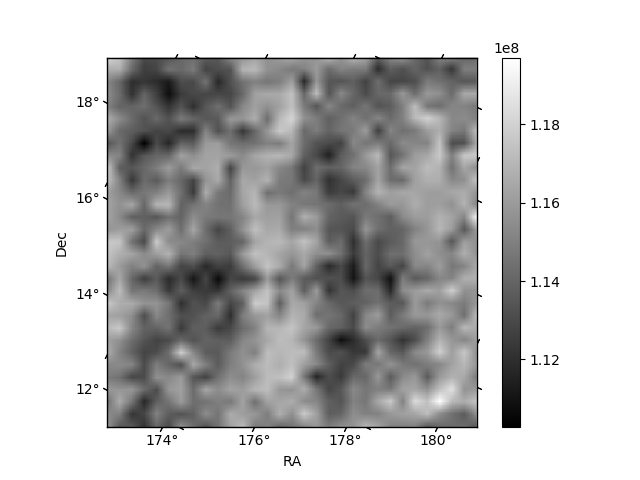
Histogram calculated using DETX and DETY for each event in the final _common_clean file
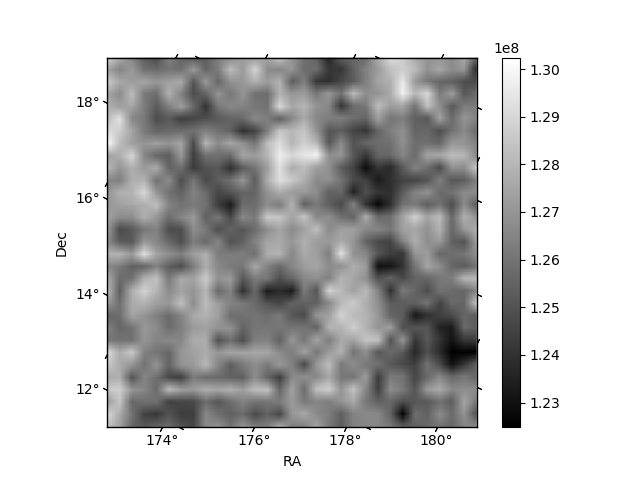
| Quadrant A | 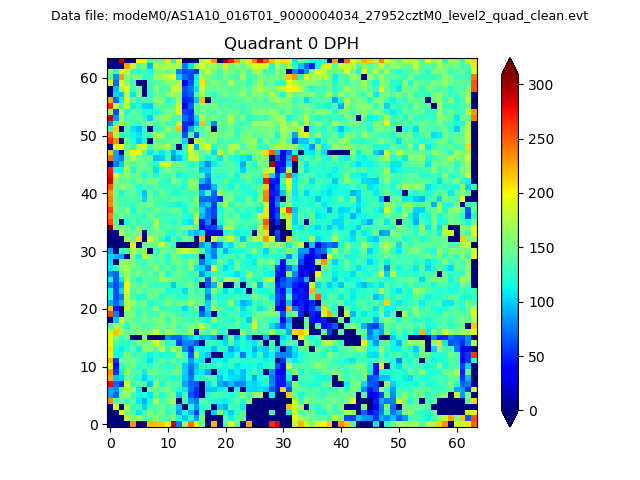 |
 |
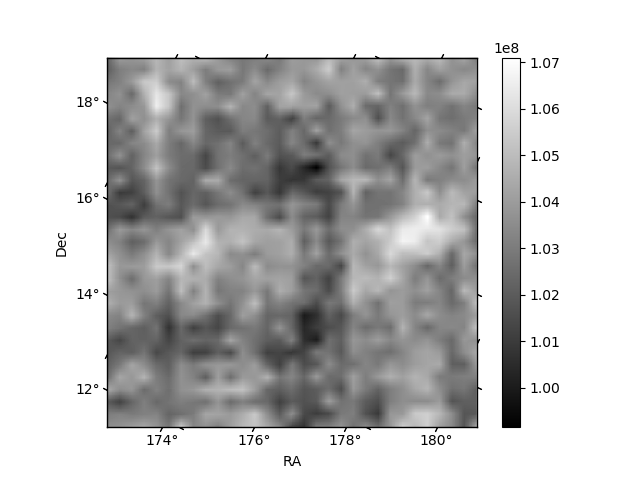
Quadrant B |
|---|---|---|---|
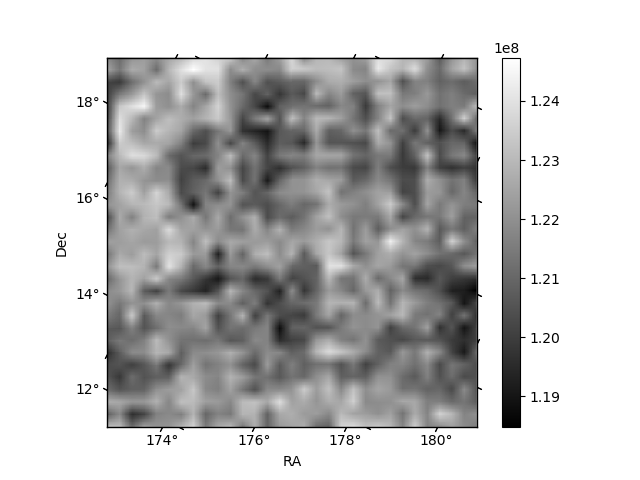
| Quadrant D | 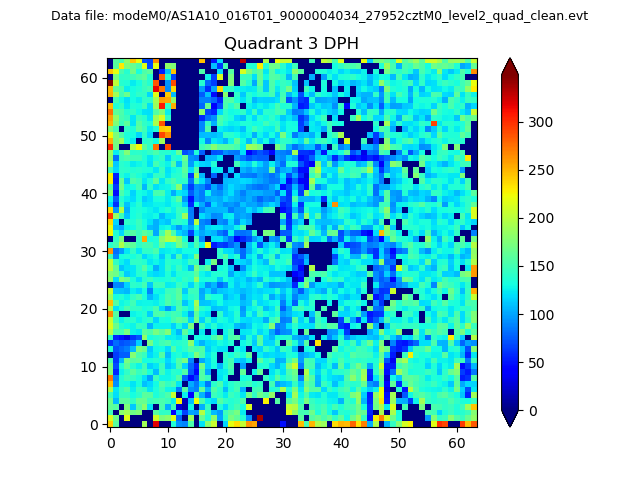 |
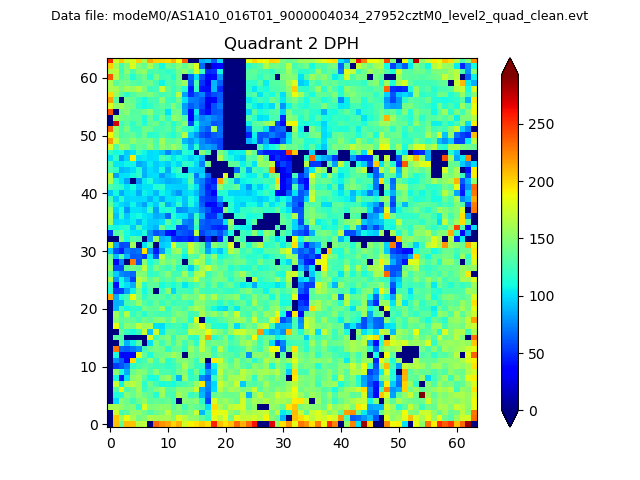 |
Quadrant C |
| Plot type | Count rate plots | Images |
|---|---|---|
| Comparison with Poisson distribution Blue bars denote a histogram of data divided into 1 sec bins. Red curve is a Poisson curve with rate = median count rate of data. |
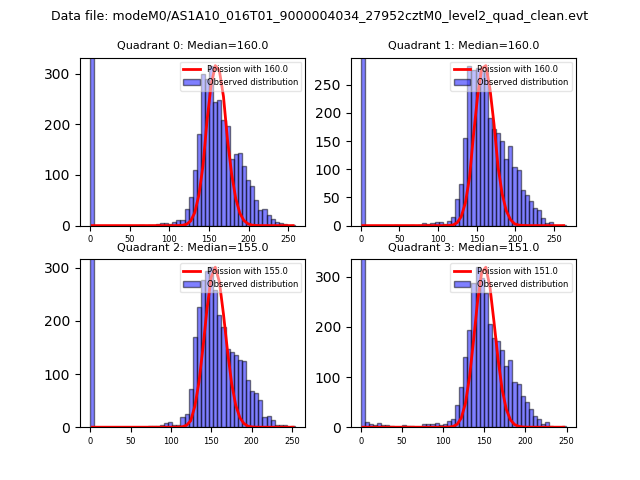 |
 |
| Quadrant-wise count rates Data is divided into 100 sec bins |
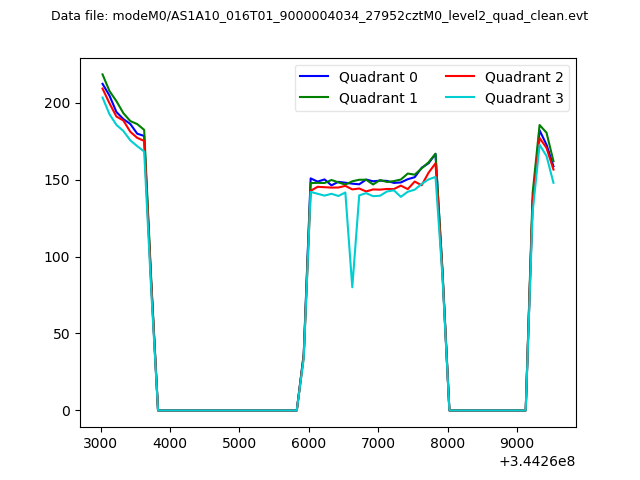 |
|
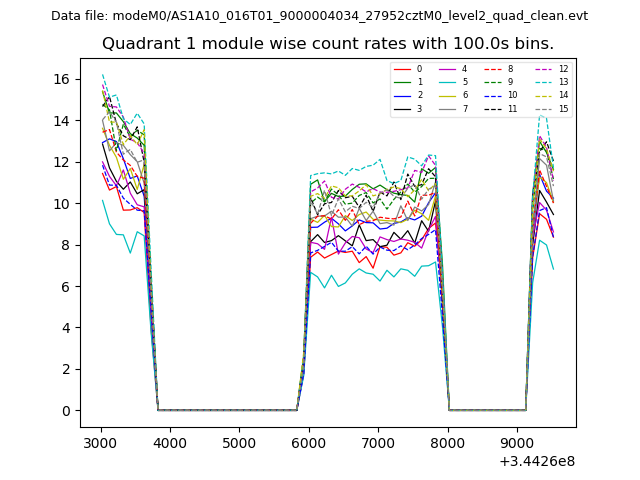
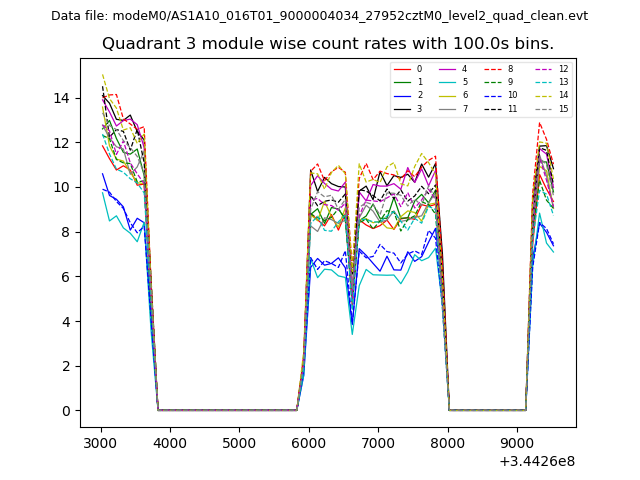
| Module-wise count rates for Quadrant A Data is divided into 100 sec bins |
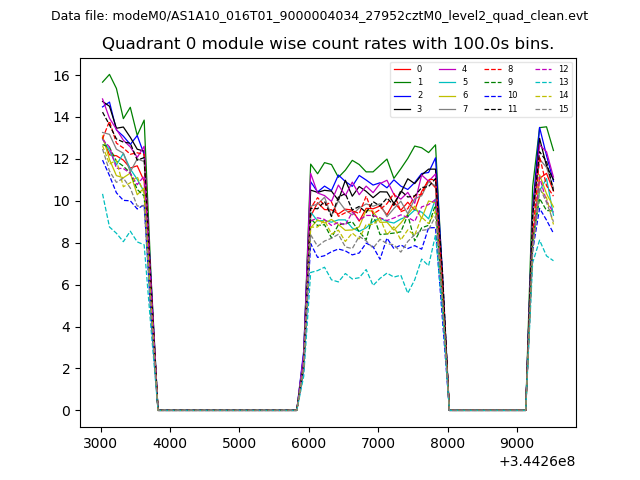 |
 |
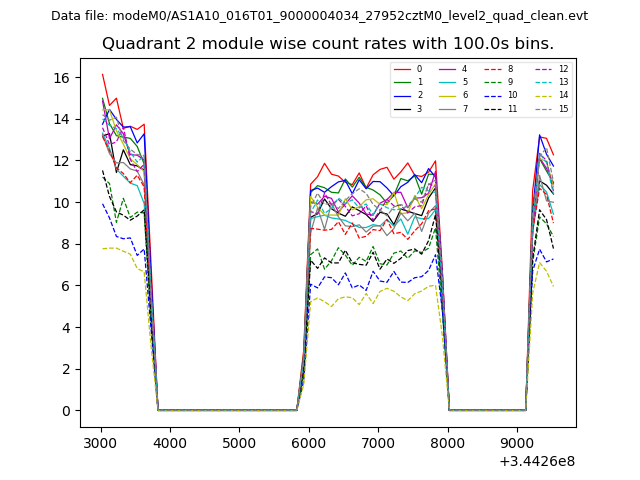
| Module-wise count rates for Quadrant B Data is divided into 100 sec bins |
 |
 |
| Module-wise count rates for Quadrant C Data is divided into 100 sec bins |
 |
 |
| Module-wise count rates for Quadrant D Data is divided into 100 sec bins |
 |
 |
| Parameter | Plot |
|---|---|
| CZT HV Monitor | 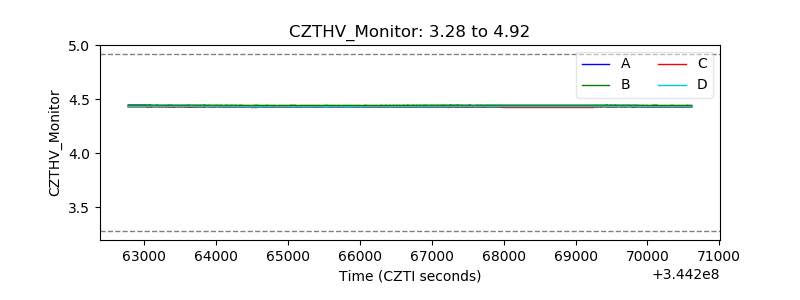 |
| D_VDD | 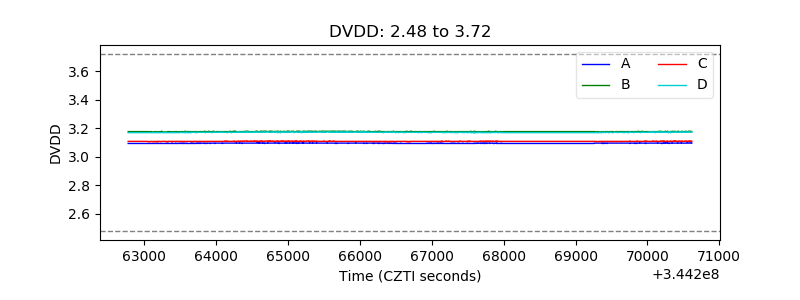 |
| Temperature 1 | 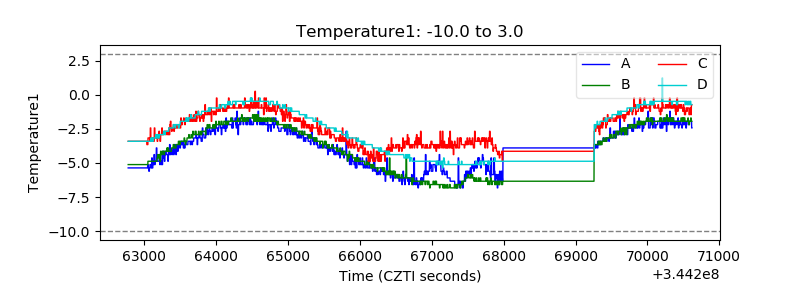 |
| Veto HV Monitor | 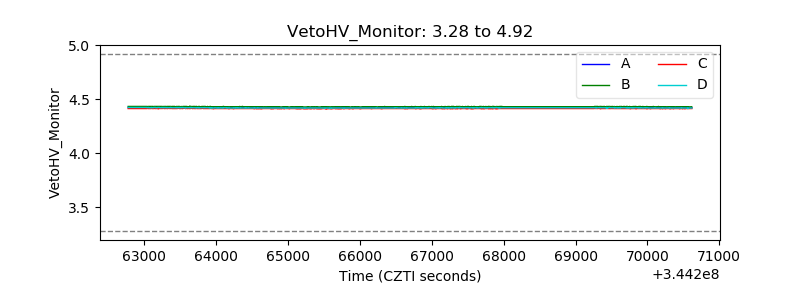 |
| Veto LLD | 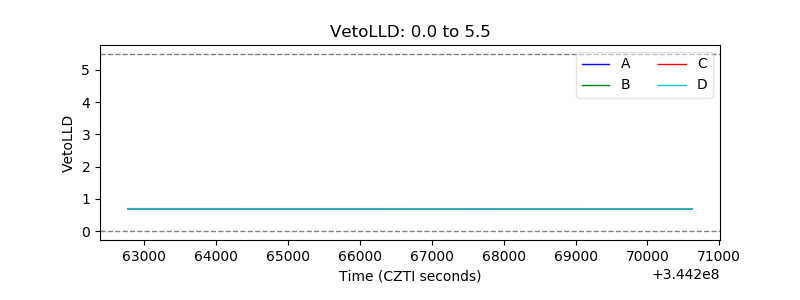 |
| Alpha Counter | 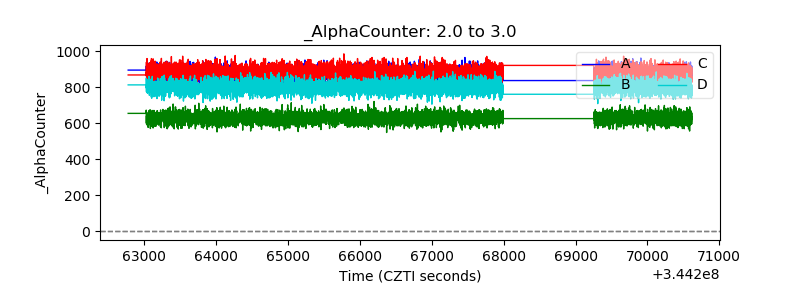 |
| _CPM_Rate | 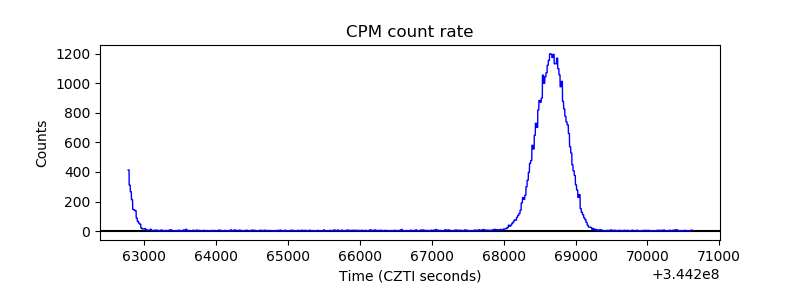 |
| CZT Counter | 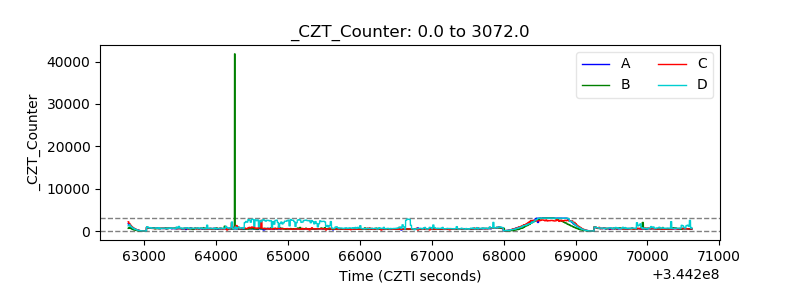 |
| +2.5 Volts monitor |  |
| +5 Volts monitor |  |
| _ROLL_ROT | 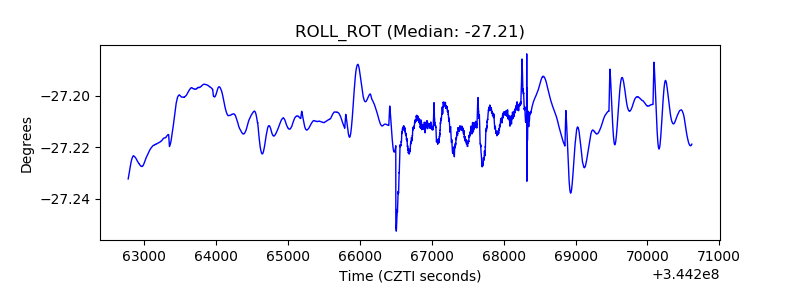 |
| _Roll_DEC | 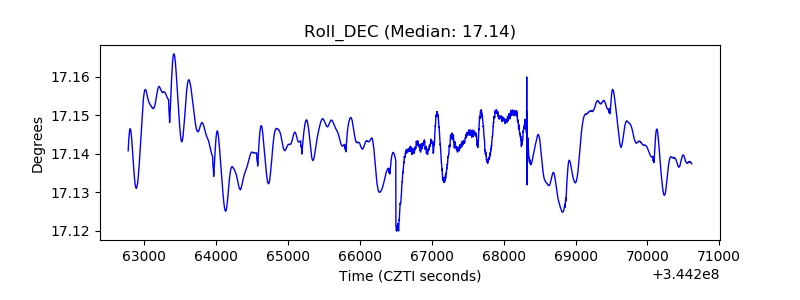 |
| _Roll_RA | 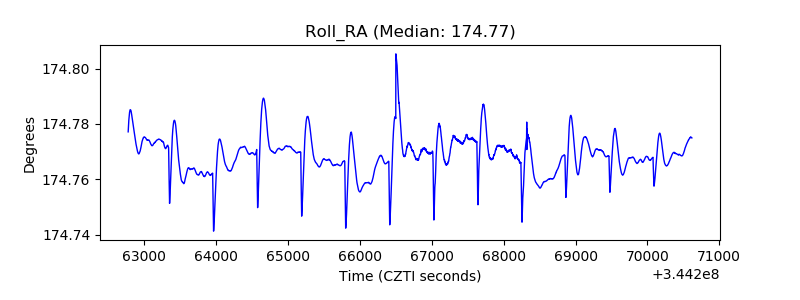 |
| Veto Counter |  |