| Param | Original file | Final file |
|---|---|---|
| Filename | modeM0/AS1A10_016T01_9000004034_27953cztM0_level2.evt | modeM0/AS1A10_016T01_9000004034_27953cztM0_level2_quad_clean.evt |
| Size (bytes) | 555,361,920 | 65,433,600 |
| Size | 529.6 MB | 62.4 MB |
| Events in quadrant A | 3,444,395 | 390,685 |
| Events in quadrant B | 3,947,713 | 391,732 |
| Events in quadrant C | 3,654,590 | 378,797 |
| Events in quadrant D | 5,326,733 | 361,181 |
| Mode M0 | |||
|---|---|---|---|
| Quadrant | BADHDUFLAG | Total packets | Discarded packets |
| A | 0 | 13966 | 0 |
| B | 0 | 15763 | 0 |
| C | 0 | 14665 | 0 |
| D | 0 | 20670 | 0 |
| Mode M9 | |||
|---|---|---|---|
| Quadrant | BADHDUFLAG | Total packets | Discarded packets |
| A | 0 | 10 | 0 |
| B | 0 | 10 | 0 |
| C | 0 | 10 | 0 |
| D | 0 | 10 | 0 |
| Quadrant | Total seconds | Saturated seconds | Saturation percentage |
|---|---|---|---|
| A | 6574 | 124 | 1.886218% |
| B | 6574 | 169 | 2.570733% |
| C | 6574 | 184 | 2.798905% |
| D | 6575 | 357 | 5.429658% |
Noise dominated data is calculated using 1-second bins in cleaned event files. If a bin has >2000 counts, and if more than 50% of those come from <1% of pixels, then it is considered to be noise-dominated and hence unusable.
| Quadrant | # 1 sec bins | Bins with >0 counts | Bins with >2000 counts | High rate bins dominated by noise | Noise dominated (total time) | Noise dominated (detector-on time) | Marked lightcurve |
|---|---|---|---|---|---|---|---|
| A | 7584 | 6574 | 0 | 0 | 0.00% | 0.00% | 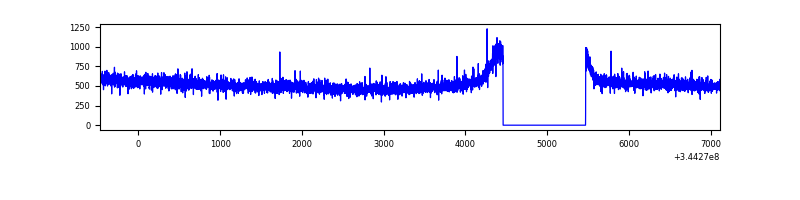 |
| B | 7584 | 6574 | 23 | 23 | 0.30% | 0.35% | 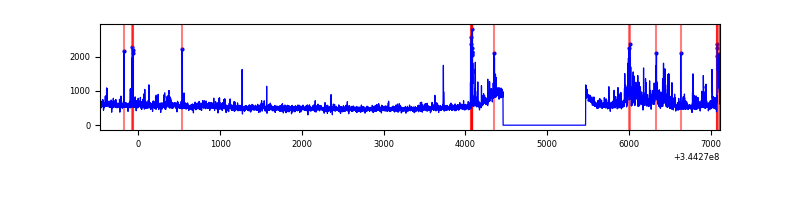 |
| C | 7584 | 6574 | 4 | 4 | 0.05% | 0.06% | 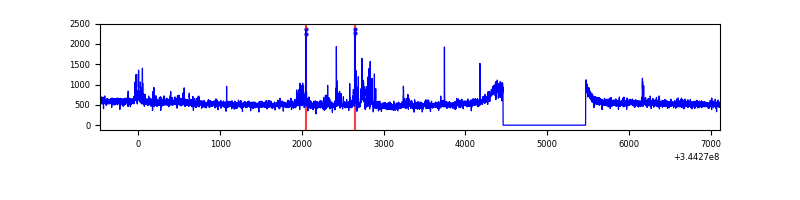 |
| D | 7585 | 6575 | 259 | 259 | 3.41% | 3.94% | 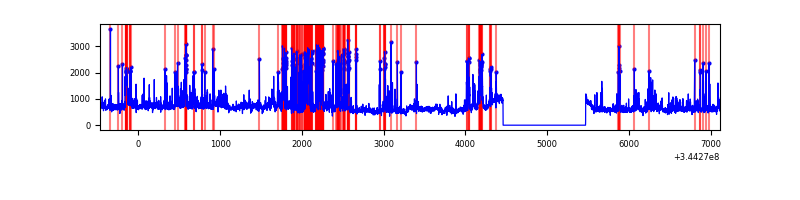 |
Top three noisy pixels from each quadrant. If the there are fewer than three noisy pixels in the level2.evt file, extra rows are filled as -1
| Pixel properties | Quadrant properties | ||||||
|---|---|---|---|---|---|---|---|
| Quadrant | DetID | PixID | Counts | Sigma | Mean | Median | Sigma |
| A | 13 | 254 | 11494 | 58.94 | 889 | 870 | 180.2 |
| A | 3 | 137 | 8177 | 40.54 | 889 | 870 | 180.2 |
| A | 0 | 226 | 7698 | 37.88 | 889 | 870 | 180.2 |
| B | 10 | 245 | 436823 | 2631.0 | 874 | 854 | 165.7 |
| B | 0 | 230 | 71075 | 423.77 | 874 | 854 | 165.7 |
| B | 12 | 111 | 19892 | 114.89 | 874 | 854 | 165.7 |
| C | 3 | 233 | 182031 | 904.04 | 855 | 863 | 200.4 |
| C | 14 | 238 | 139639 | 692.5 | 855 | 863 | 200.4 |
| C | 13 | 61 | 5779 | 24.53 | 855 | 863 | 200.4 |
| D | 1 | 52 | 837223 | 4069.19 | 857 | 834 | 205.5 |
| D | 8 | 195 | 742424 | 3607.97 | 857 | 834 | 205.5 |
| D | 2 | 250 | 324132 | 1572.9 | 857 | 834 | 205.5 |
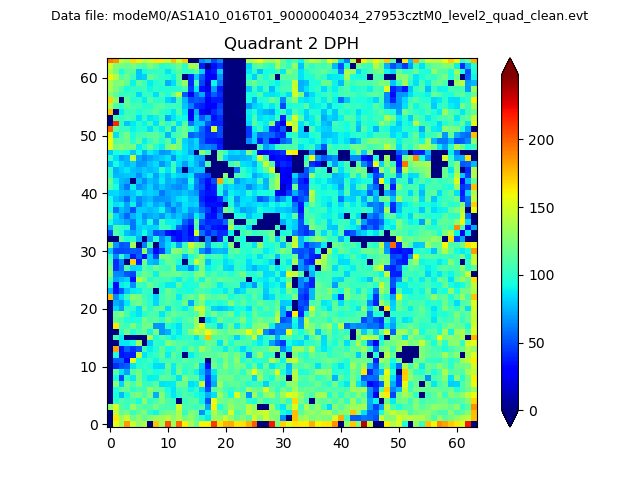
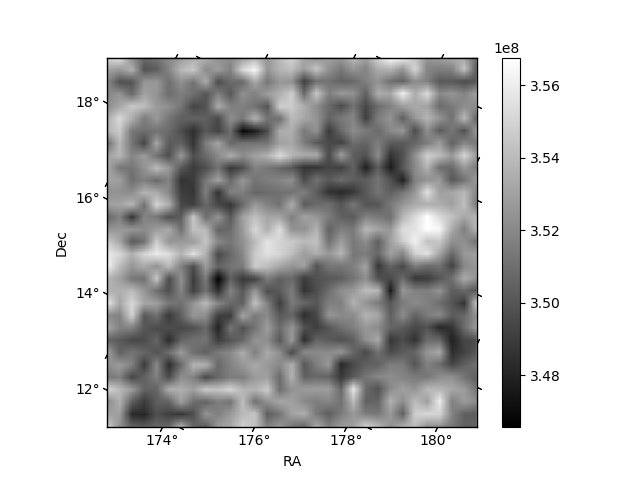
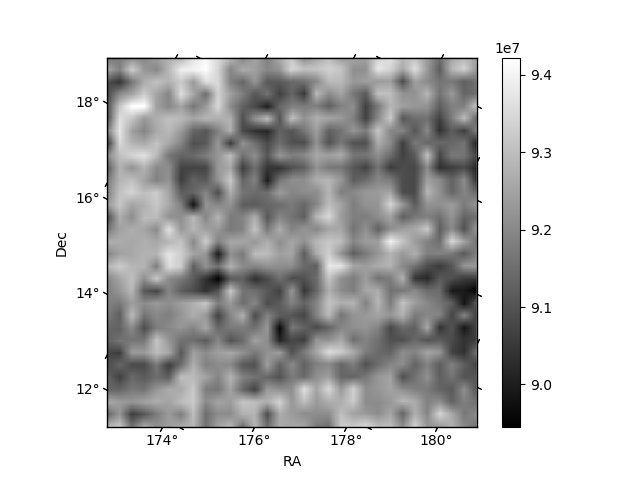
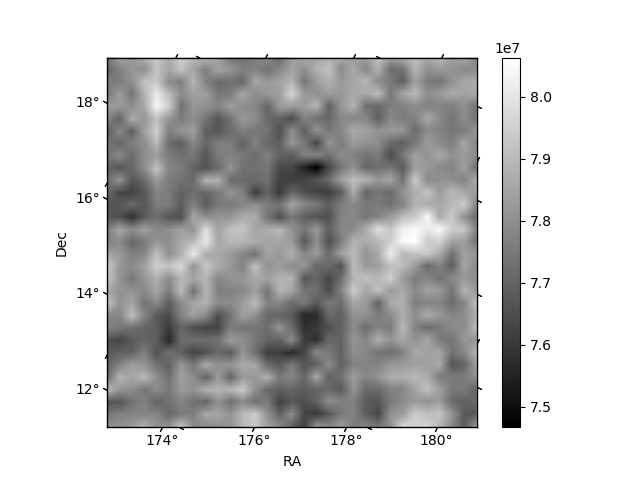
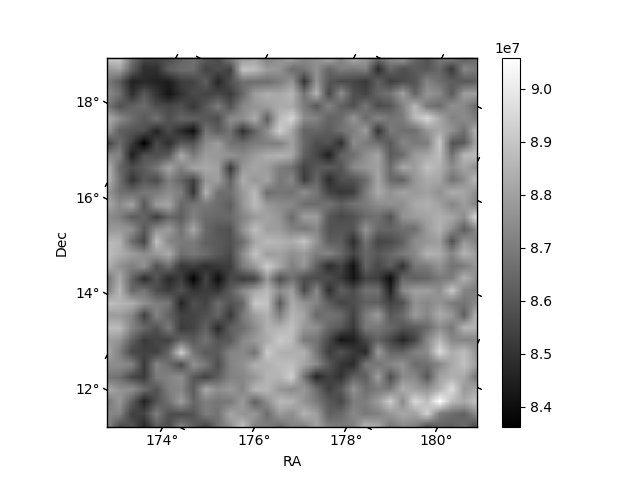
Histogram calculated using DETX and DETY for each event in the final _common_clean file
| Quadrant A | 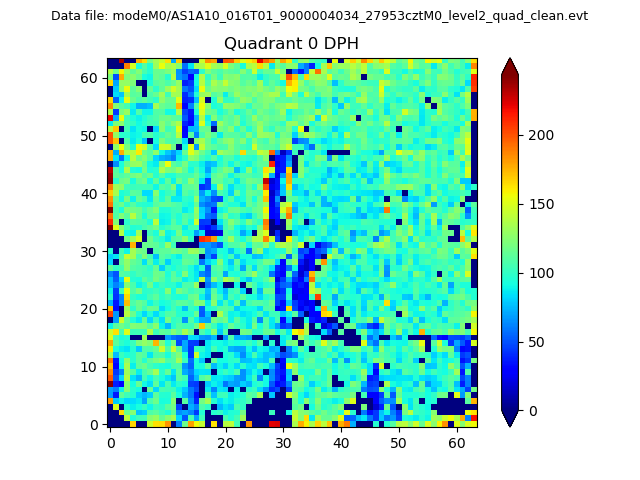 |
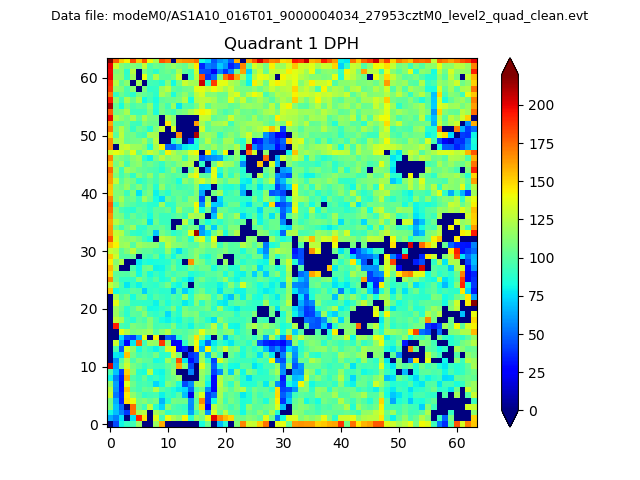 |
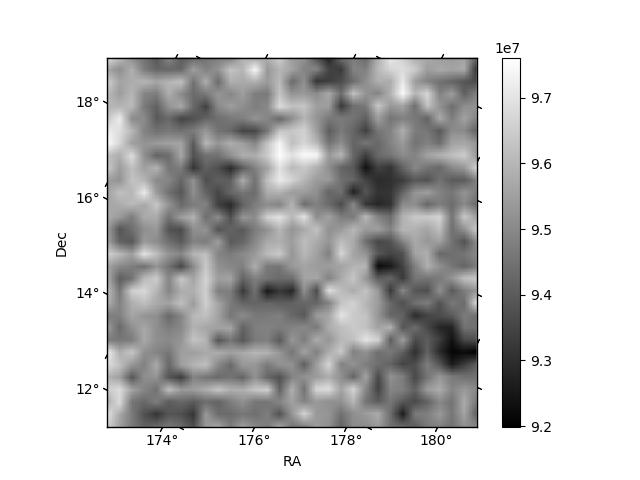
Quadrant B |
|---|---|---|---|
| Quadrant D | 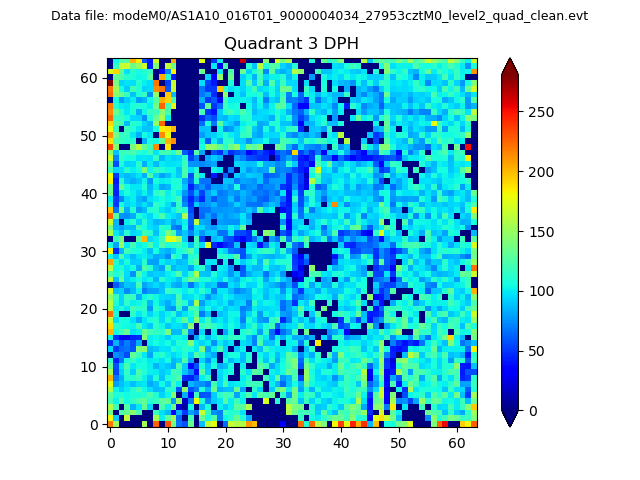 |
 |
Quadrant C |
| Plot type | Count rate plots | Images |
|---|---|---|
| Comparison with Poisson distribution Blue bars denote a histogram of data divided into 1 sec bins. Red curve is a Poisson curve with rate = median count rate of data. |
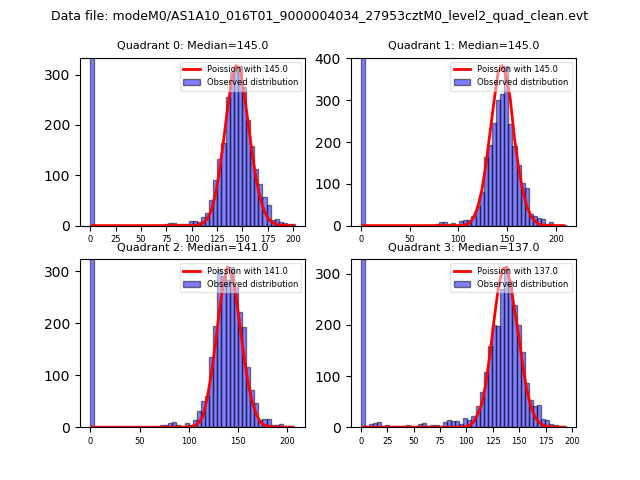 |
 |
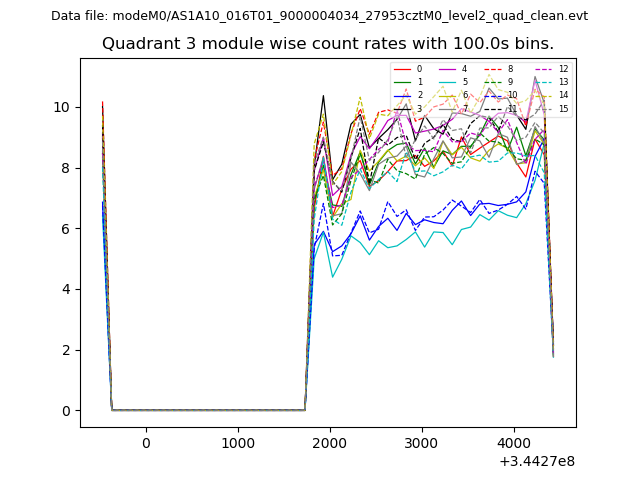
| Quadrant-wise count rates Data is divided into 100 sec bins |
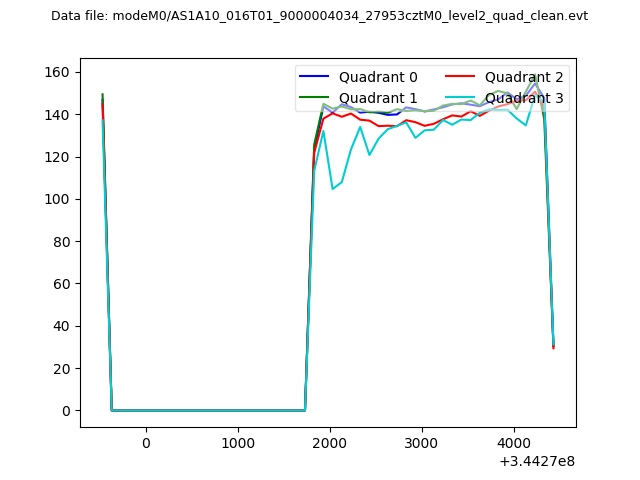 |
|
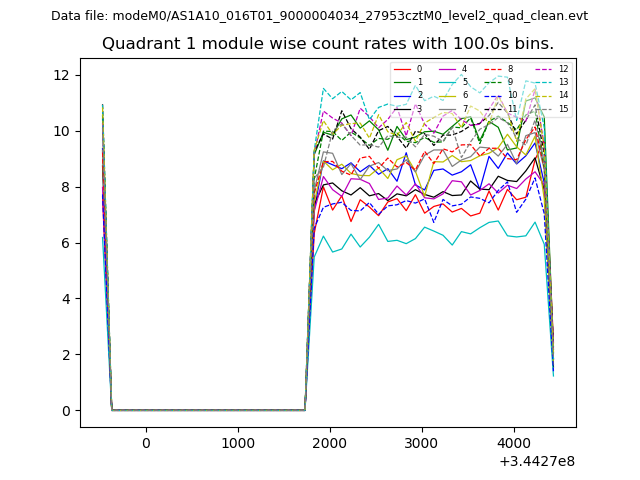
| Module-wise count rates for Quadrant A Data is divided into 100 sec bins |
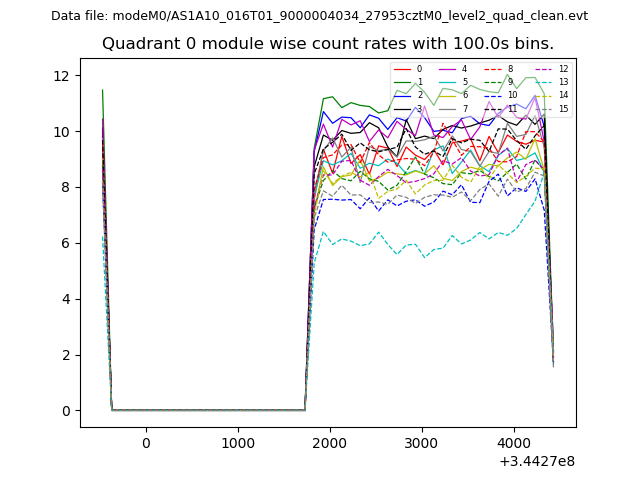 |
 |
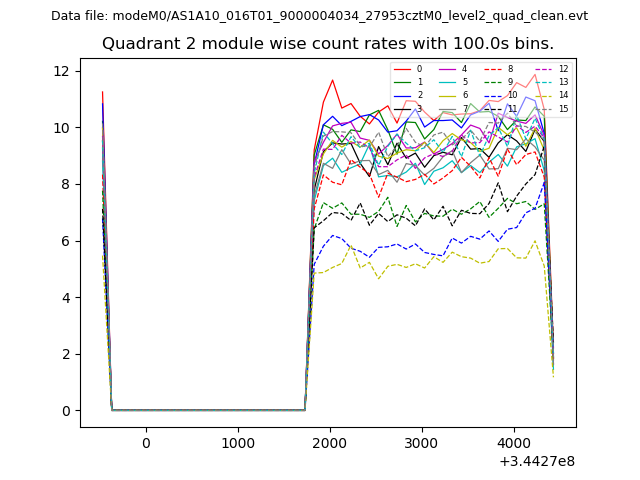
| Module-wise count rates for Quadrant B Data is divided into 100 sec bins |
 |
 |
| Module-wise count rates for Quadrant C Data is divided into 100 sec bins |
 |
 |
| Module-wise count rates for Quadrant D Data is divided into 100 sec bins |
 |
 |
| Parameter | Plot |
|---|---|
| CZT HV Monitor | 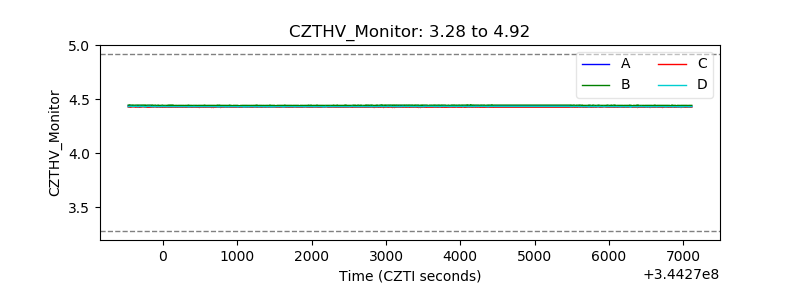 |
| D_VDD | 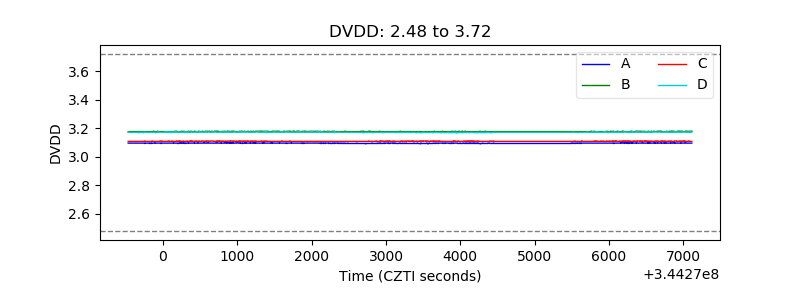 |
| Temperature 1 | 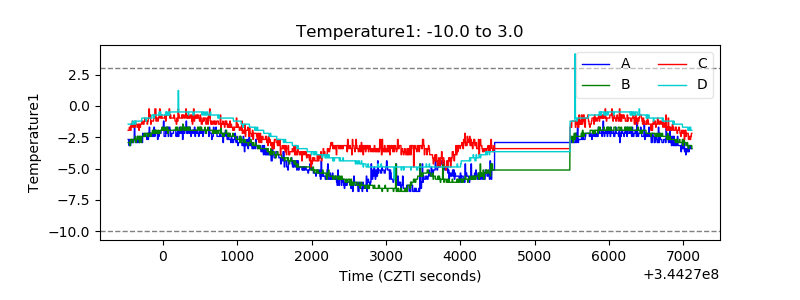 |
| Veto HV Monitor | 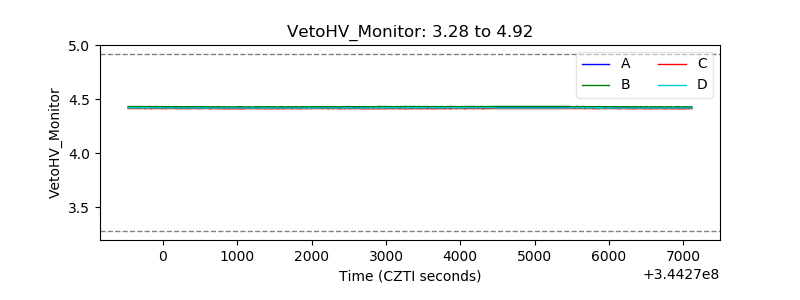 |
| Veto LLD | 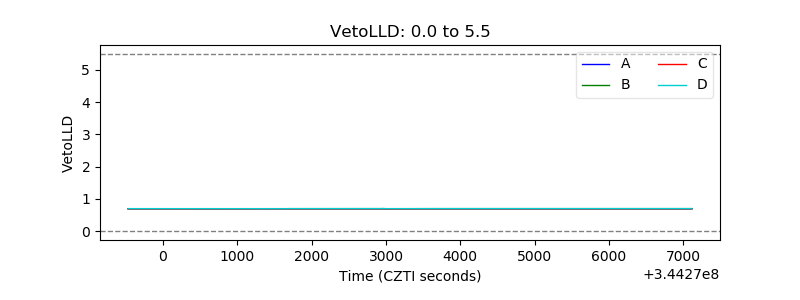 |
| Alpha Counter | 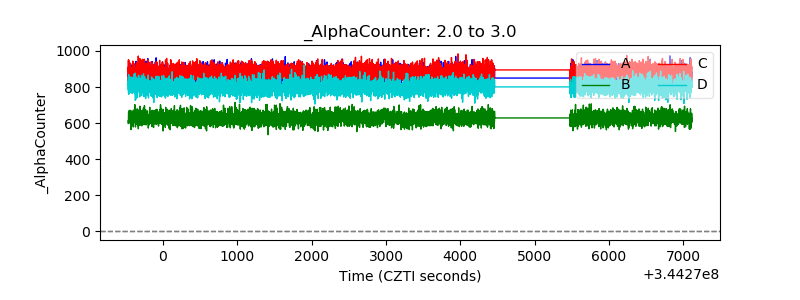 |
| _CPM_Rate | 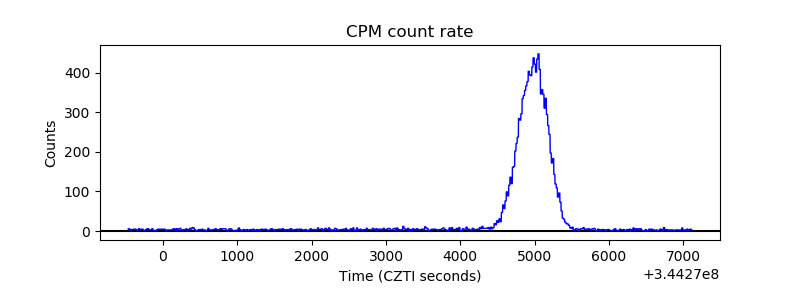 |
| CZT Counter | 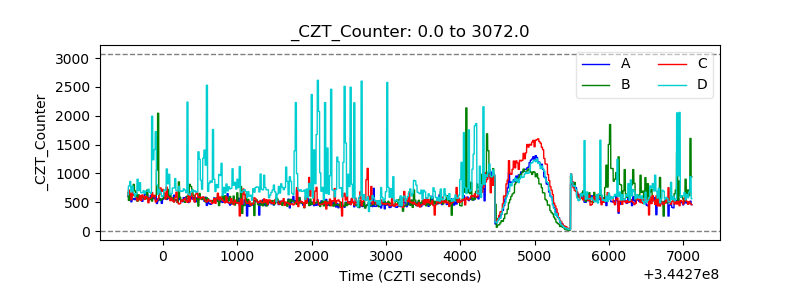 |
| +2.5 Volts monitor |  |
| +5 Volts monitor |  |
| _ROLL_ROT | 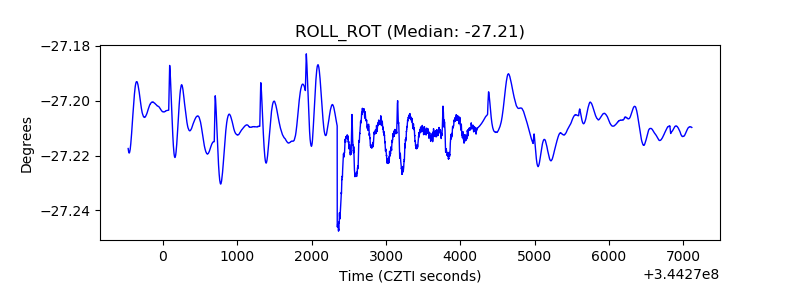 |
| _Roll_DEC | 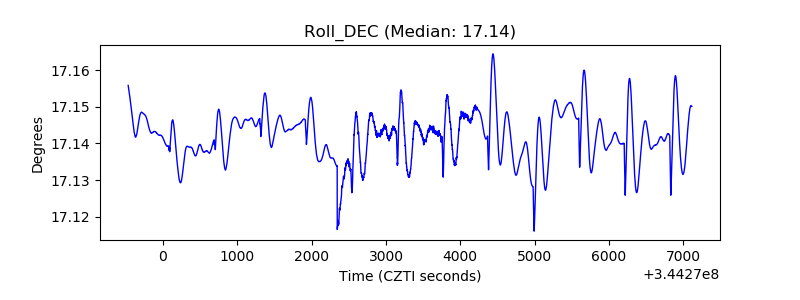 |
| _Roll_RA | 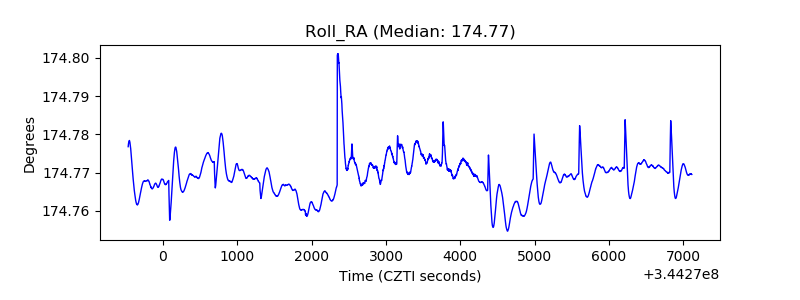 |
| Veto Counter | 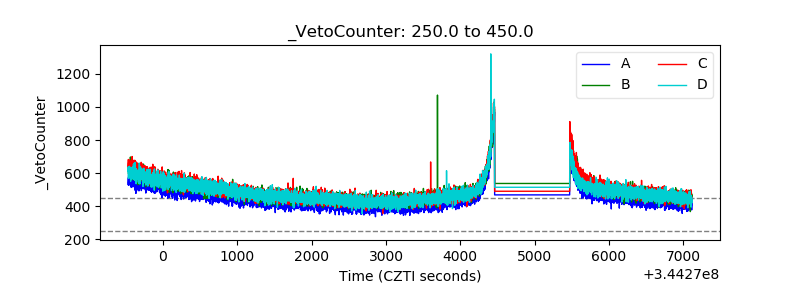 |