| Param | Original file | Final file |
|---|---|---|
| Filename | modeM0/AS1A10_016T01_9000004034_27954cztM0_level2.evt | modeM0/AS1A10_016T01_9000004034_27954cztM0_level2_quad_clean.evt |
| Size (bytes) | 615,133,440 | 75,222,720 |
| Size | 586.6 MB | 71.7 MB |
| Events in quadrant A | 3,653,163 | 459,064 |
| Events in quadrant B | 4,664,057 | 456,544 |
| Events in quadrant C | 3,638,272 | 444,166 |
| Events in quadrant D | 6,195,957 | 426,120 |
| Mode M0 | |||
|---|---|---|---|
| Quadrant | BADHDUFLAG | Total packets | Discarded packets |
| A | 0 | 15045 | 0 |
| B | 0 | 18483 | 0 |
| C | 0 | 14915 | 0 |
| D | 0 | 23187 | 0 |
| Mode M9 | |||
|---|---|---|---|
| Quadrant | BADHDUFLAG | Total packets | Discarded packets |
| A | 0 | 7 | 0 |
| B | 0 | 7 | 0 |
| C | 0 | 7 | 0 |
| D | 0 | 7 | 0 |
| Quadrant | Total seconds | Saturated seconds | Saturation percentage |
|---|---|---|---|
| A | 7062 | 119 | 1.685075% |
| B | 7063 | 149 | 2.109585% |
| C | 7063 | 165 | 2.336118% |
| D | 7063 | 589 | 8.339233% |
Noise dominated data is calculated using 1-second bins in cleaned event files. If a bin has >2000 counts, and if more than 50% of those come from <1% of pixels, then it is considered to be noise-dominated and hence unusable.
| Quadrant | # 1 sec bins | Bins with >0 counts | Bins with >2000 counts | High rate bins dominated by noise | Noise dominated (total time) | Noise dominated (detector-on time) | Marked lightcurve |
|---|---|---|---|---|---|---|---|
| A | 7707 | 7062 | 28 | 28 | 0.36% | 0.40% | 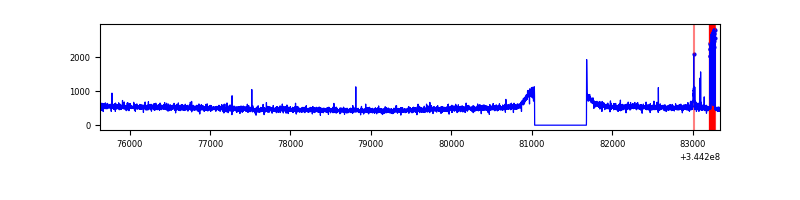 |
| B | 7708 | 7063 | 19 | 19 | 0.25% | 0.27% | 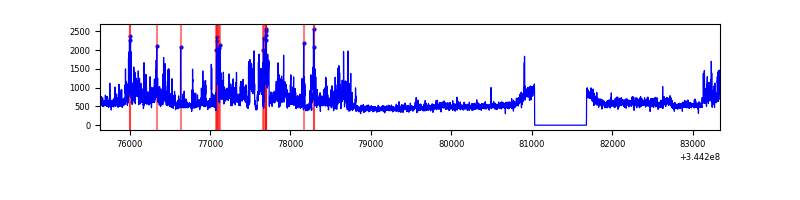 |
| C | 7708 | 7063 | 1 | 1 | 0.01% | 0.01% | 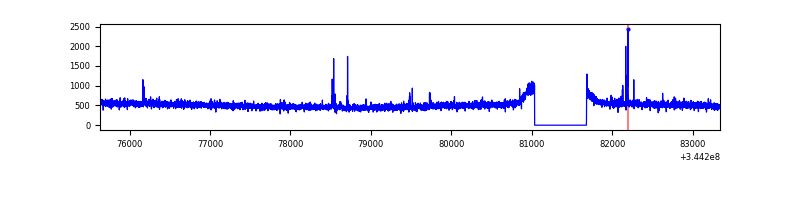 |
| D | 7708 | 7063 | 471 | 471 | 6.11% | 6.67% | 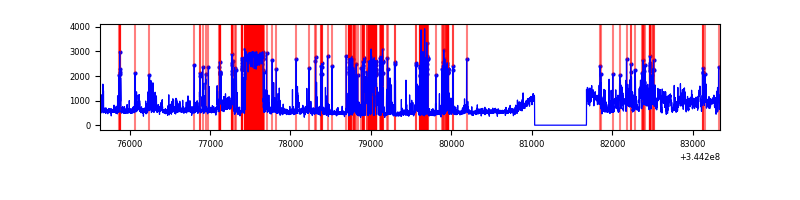 |
Top three noisy pixels from each quadrant. If the there are fewer than three noisy pixels in the level2.evt file, extra rows are filled as -1
| Pixel properties | Quadrant properties | ||||||
|---|---|---|---|---|---|---|---|
| Quadrant | DetID | PixID | Counts | Sigma | Mean | Median | Sigma |
| A | 6 | 16 | 82461 | 440.46 | 916 | 898 | 185.2 |
| A | 13 | 248 | 21999 | 113.95 | 916 | 898 | 185.2 |
| A | 13 | 254 | 11932 | 59.59 | 916 | 898 | 185.2 |
| B | 10 | 245 | 1063392 | 6109.08 | 902 | 879 | 173.9 |
| B | 0 | 230 | 57015 | 322.76 | 902 | 879 | 173.9 |
| B | 12 | 111 | 20818 | 114.64 | 902 | 879 | 173.9 |
| C | 14 | 238 | 143614 | 690.12 | 879 | 885 | 206.8 |
| C | 3 | 233 | 37517 | 177.12 | 879 | 885 | 206.8 |
| C | 15 | 208 | 28583 | 133.92 | 879 | 885 | 206.8 |
| D | 1 | 52 | 1386248 | 6678.95 | 862 | 841 | 207.4 |
| D | 7 | 80 | 799644 | 3850.97 | 862 | 841 | 207.4 |
| D | 8 | 195 | 390994 | 1880.9 | 862 | 841 | 207.4 |
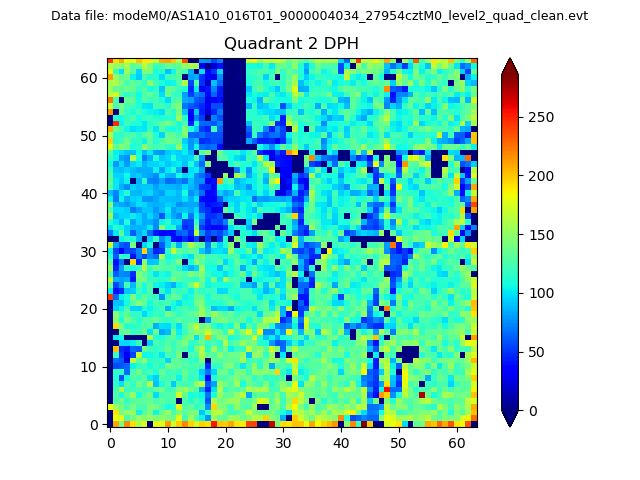
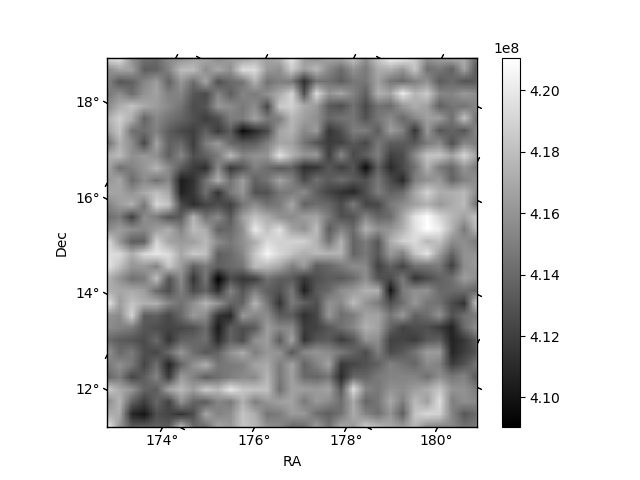
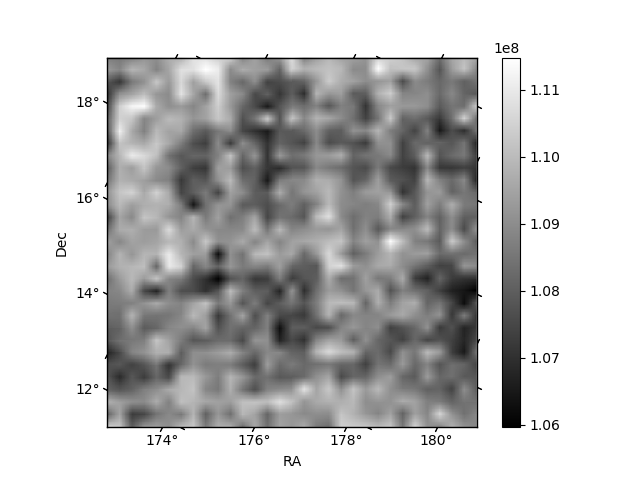
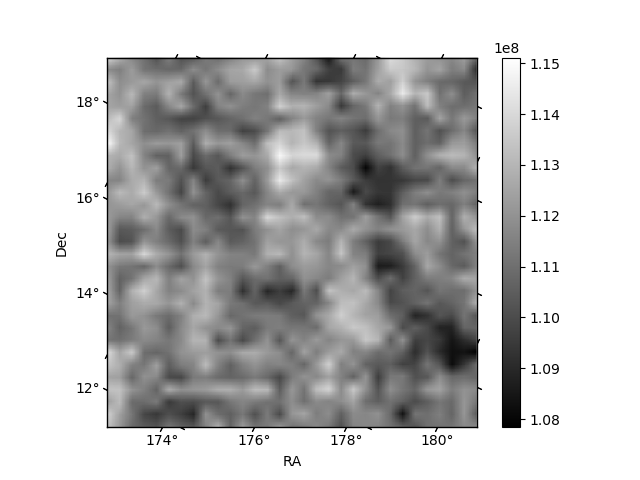
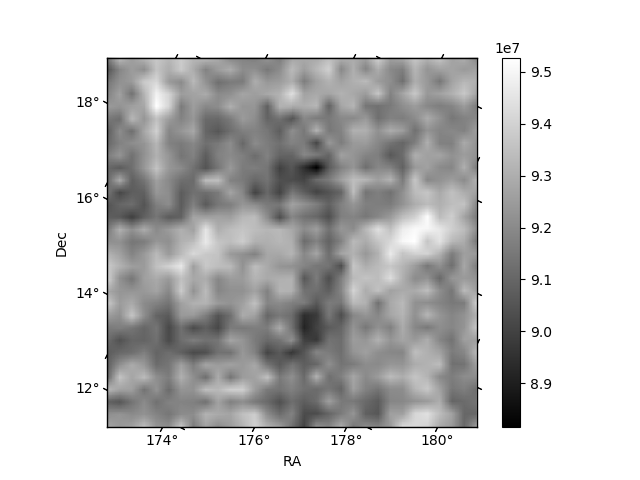
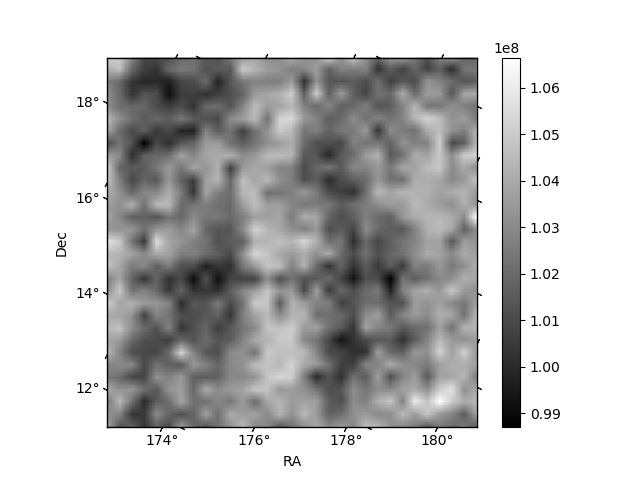
Histogram calculated using DETX and DETY for each event in the final _common_clean file
| Quadrant A | 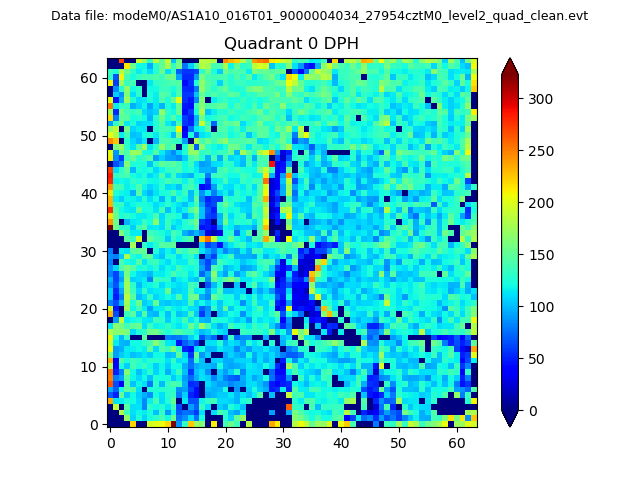 |
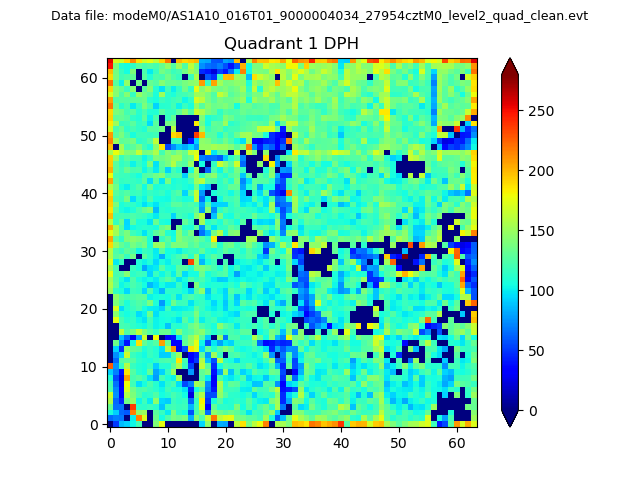 |
Quadrant B |
|---|---|---|---|
| Quadrant D | 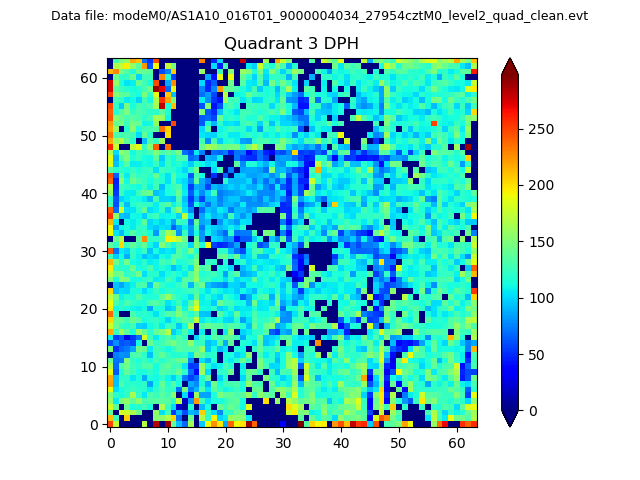 |
 |
Quadrant C |
| Plot type | Count rate plots | Images |
|---|---|---|
| Comparison with Poisson distribution Blue bars denote a histogram of data divided into 1 sec bins. Red curve is a Poisson curve with rate = median count rate of data. |
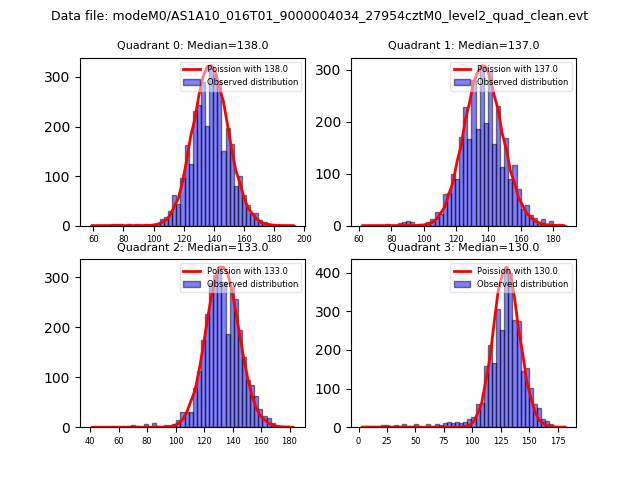 |
 |
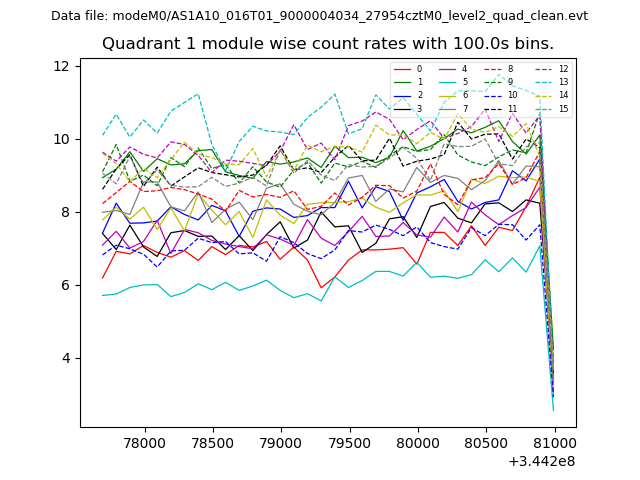
| Quadrant-wise count rates Data is divided into 100 sec bins |
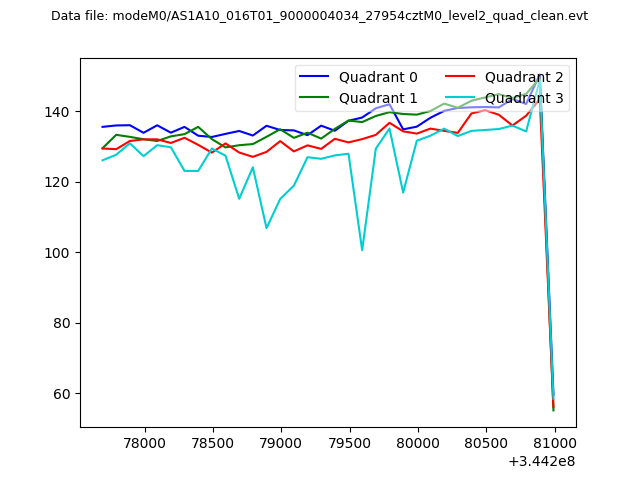 |
|
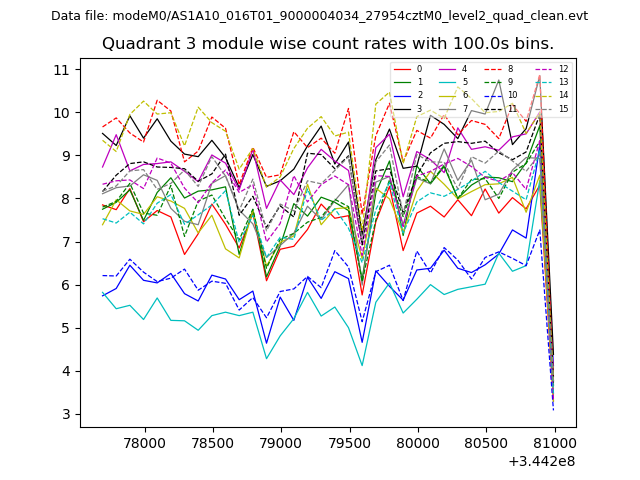
| Module-wise count rates for Quadrant A Data is divided into 100 sec bins |
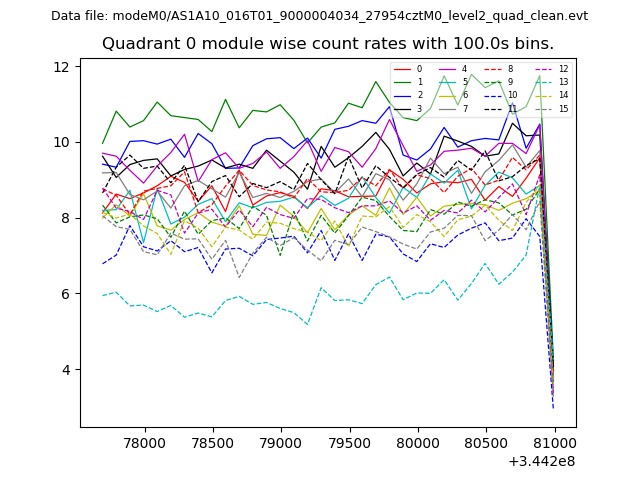 |
 |
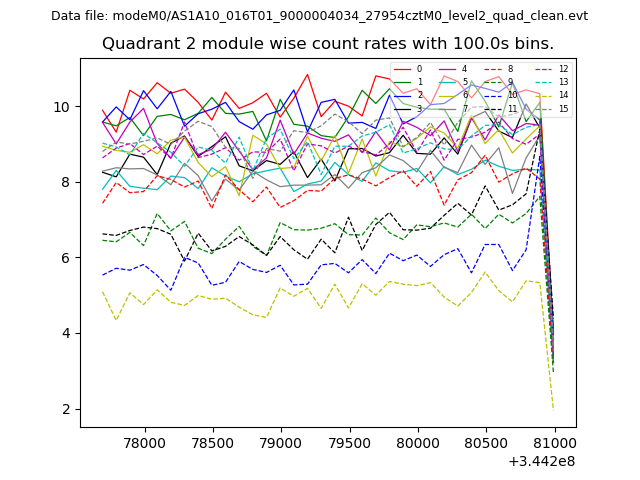
| Module-wise count rates for Quadrant B Data is divided into 100 sec bins |
 |
 |
| Module-wise count rates for Quadrant C Data is divided into 100 sec bins |
 |
 |
| Module-wise count rates for Quadrant D Data is divided into 100 sec bins |
 |
 |
| Parameter | Plot |
|---|---|
| CZT HV Monitor | 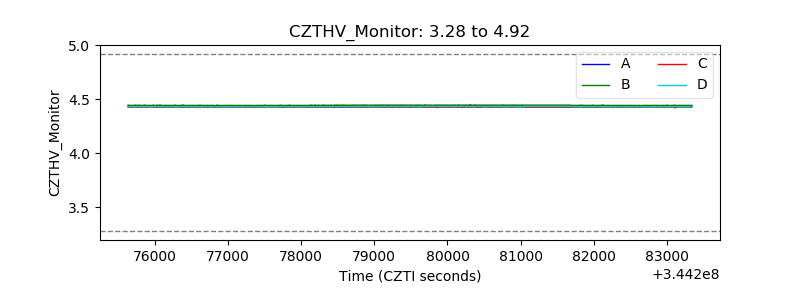 |
| D_VDD | 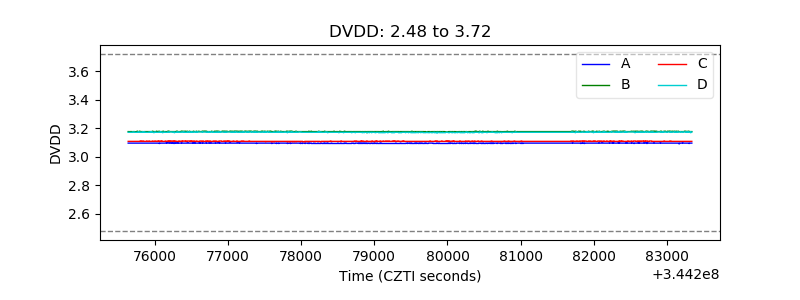 |
| Temperature 1 | 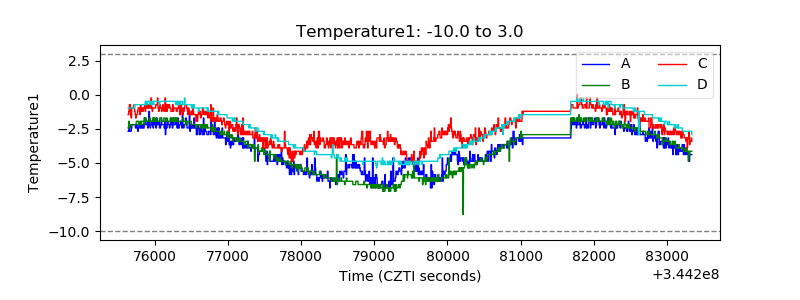 |
| Veto HV Monitor | 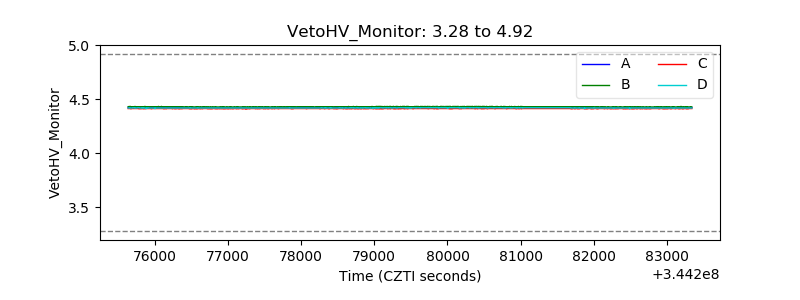 |
| Veto LLD | 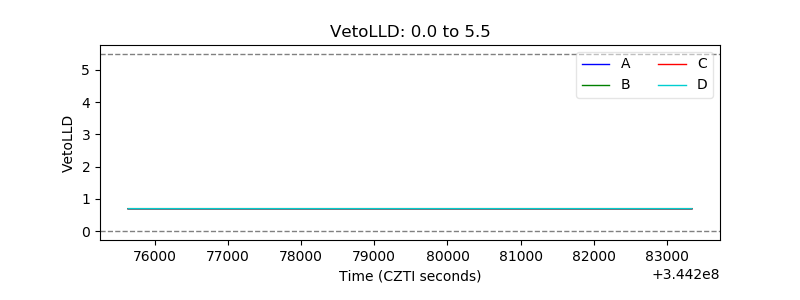 |
| Alpha Counter | 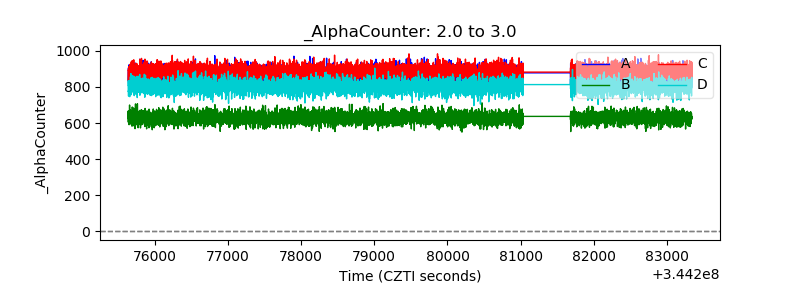 |
| _CPM_Rate | 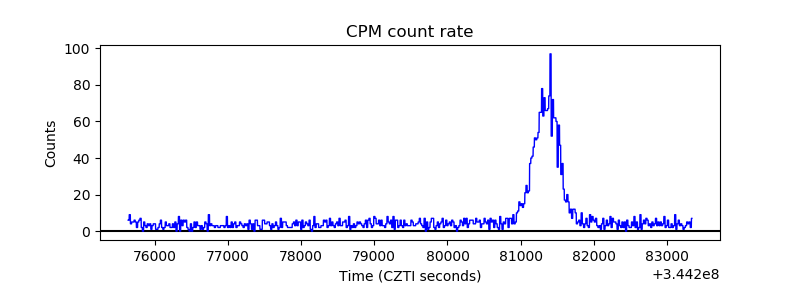 |
| CZT Counter | 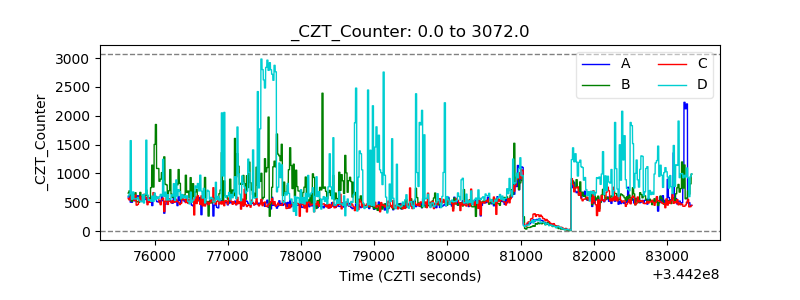 |
| +2.5 Volts monitor |  |
| +5 Volts monitor |  |
| _ROLL_ROT | 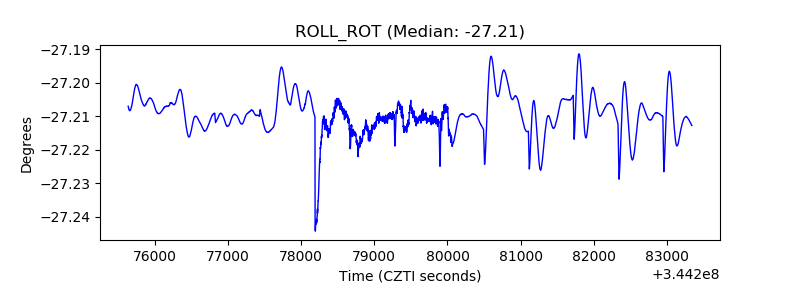 |
| _Roll_DEC | 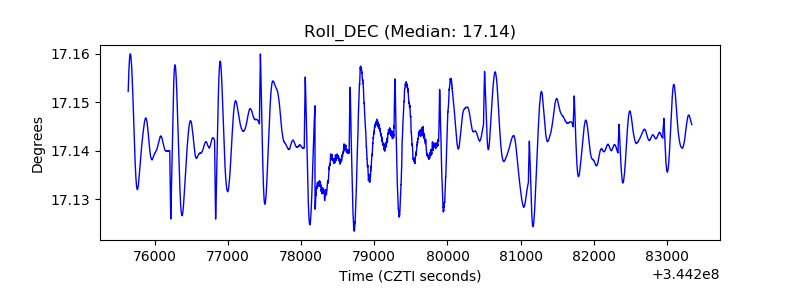 |
| _Roll_RA | 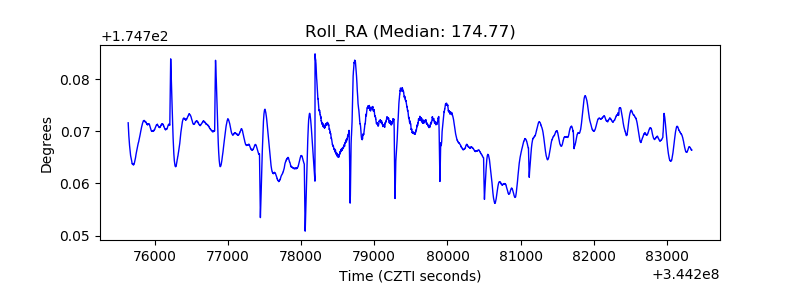 |
| Veto Counter | 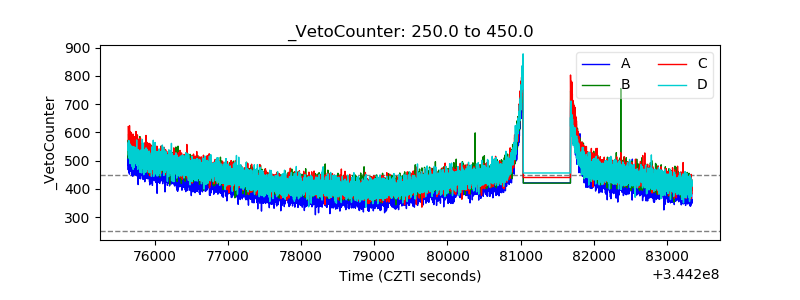 |