| Param | Original file | Final file |
|---|---|---|
| Filename | modeM0/AS1A10_016T01_9000004034_27955cztM0_level2.evt | modeM0/AS1A10_016T01_9000004034_27955cztM0_level2_quad_clean.evt |
| Size (bytes) | 661,466,880 | 79,122,240 |
| Size | 630.8 MB | 75.5 MB |
| Events in quadrant A | 3,862,327 | 480,735 |
| Events in quadrant B | 5,373,793 | 479,145 |
| Events in quadrant C | 3,783,938 | 464,749 |
| Events in quadrant D | 6,505,905 | 449,967 |
| Mode M0 | |||
|---|---|---|---|
| Quadrant | BADHDUFLAG | Total packets | Discarded packets |
| A | 0 | 16064 | 0 |
| B | 0 | 21024 | 0 |
| C | 0 | 15814 | 0 |
| D | 0 | 24656 | 0 |
| Mode M9 | |||
|---|---|---|---|
| Quadrant | BADHDUFLAG | Total packets | Discarded packets |
| A | 0 | 6 | 0 |
| B | 0 | 7 | 0 |
| C | 0 | 7 | 0 |
| D | 0 | 7 | 0 |
| Quadrant | Total seconds | Saturated seconds | Saturation percentage |
|---|---|---|---|
| A | 7496 | 133 | 1.774280% |
| B | 7495 | 391 | 5.216811% |
| C | 7495 | 199 | 2.655103% |
| D | 7495 | 486 | 6.484323% |
Noise dominated data is calculated using 1-second bins in cleaned event files. If a bin has >2000 counts, and if more than 50% of those come from <1% of pixels, then it is considered to be noise-dominated and hence unusable.
| Quadrant | # 1 sec bins | Bins with >0 counts | Bins with >2000 counts | High rate bins dominated by noise | Noise dominated (total time) | Noise dominated (detector-on time) | Marked lightcurve |
|---|---|---|---|---|---|---|---|
| A | 7736 | 7496 | 30 | 30 | 0.39% | 0.40% | 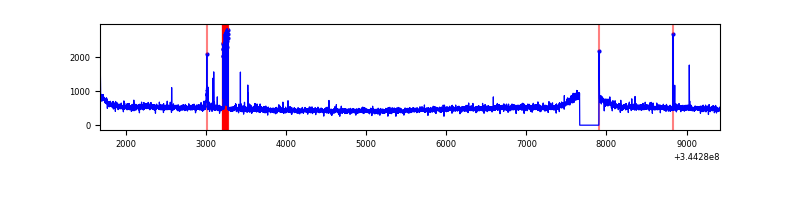 |
| B | 7735 | 7495 | 107 | 107 | 1.38% | 1.43% | 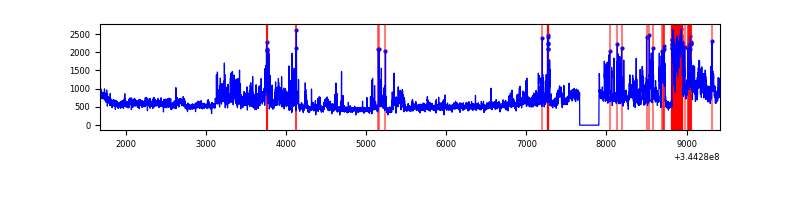 |
| C | 7735 | 7495 | 1 | 1 | 0.01% | 0.01% | 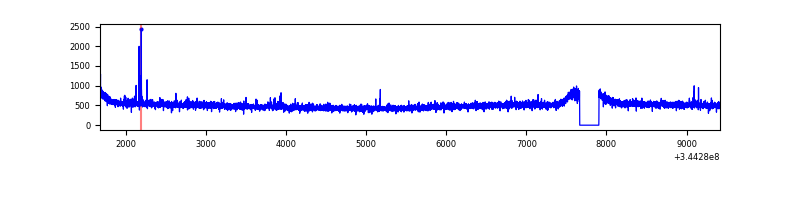 |
| D | 7735 | 7496 | 271 | 271 | 3.50% | 3.62% | 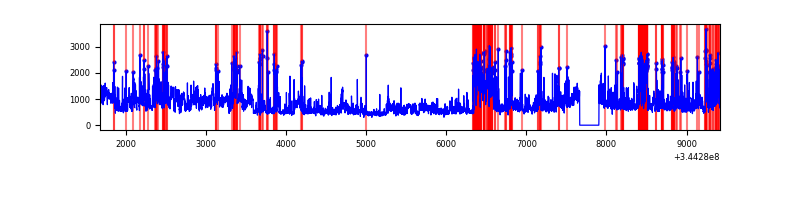 |
Top three noisy pixels from each quadrant. If the there are fewer than three noisy pixels in the level2.evt file, extra rows are filled as -1
| Pixel properties | Quadrant properties | ||||||
|---|---|---|---|---|---|---|---|
| Quadrant | DetID | PixID | Counts | Sigma | Mean | Median | Sigma |
| A | 6 | 16 | 83664 | 424.78 | 963 | 943 | 194.7 |
| A | 13 | 248 | 31738 | 158.14 | 963 | 943 | 194.7 |
| A | 8 | 192 | 14990 | 72.13 | 963 | 943 | 194.7 |
| B | 10 | 245 | 1579740 | 8705.97 | 943 | 917 | 181.3 |
| B | 0 | 230 | 73508 | 400.28 | 943 | 917 | 181.3 |
| B | 12 | 111 | 22151 | 117.09 | 943 | 917 | 181.3 |
| C | 14 | 238 | 149235 | 681.37 | 920 | 926 | 217.7 |
| C | 15 | 208 | 23229 | 102.47 | 920 | 926 | 217.7 |
| C | 3 | 233 | 22170 | 97.6 | 920 | 926 | 217.7 |
| D | 1 | 52 | 1485888 | 6695.52 | 922 | 896 | 221.8 |
| D | 8 | 195 | 555441 | 2500.33 | 922 | 896 | 221.8 |
| D | 7 | 80 | 528955 | 2380.91 | 922 | 896 | 221.8 |
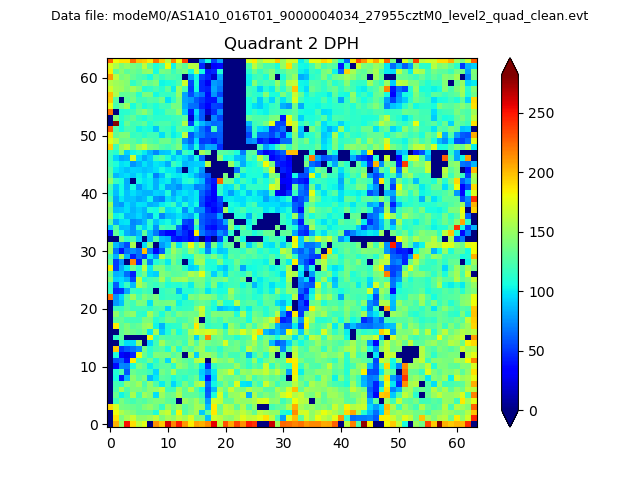
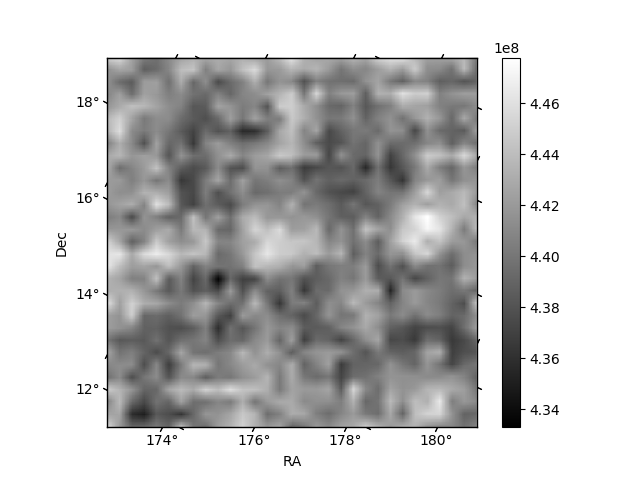
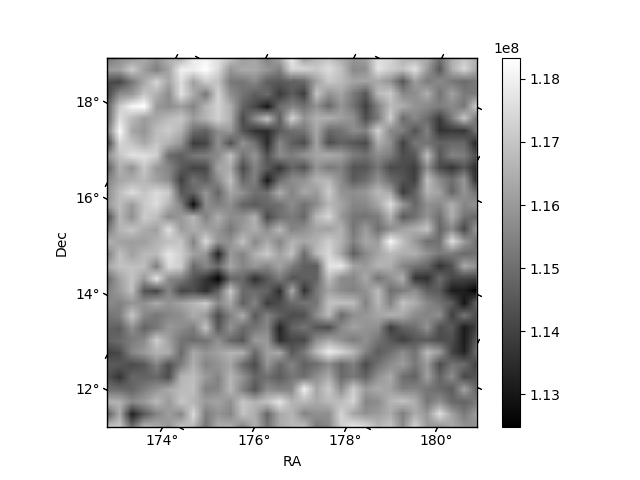
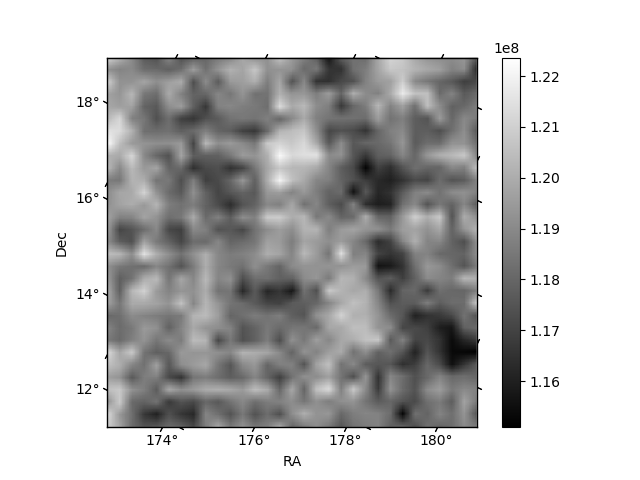
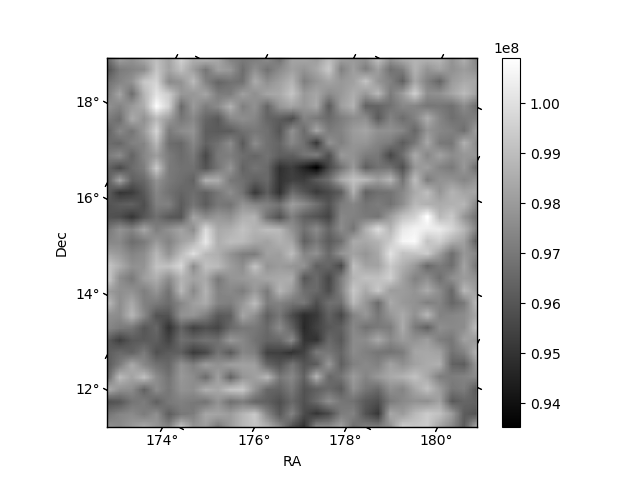
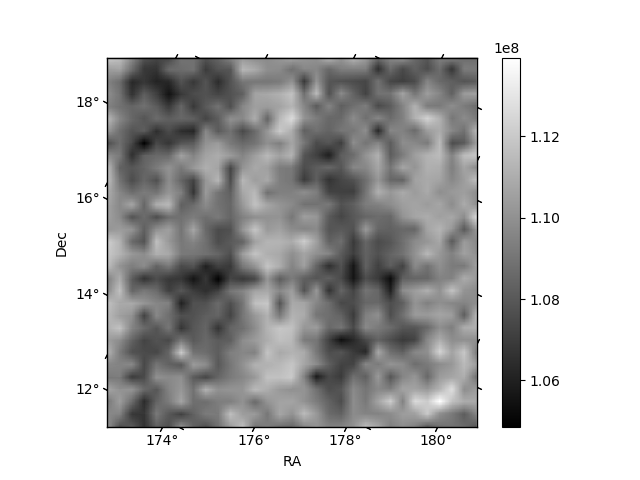
Histogram calculated using DETX and DETY for each event in the final _common_clean file
| Quadrant A | 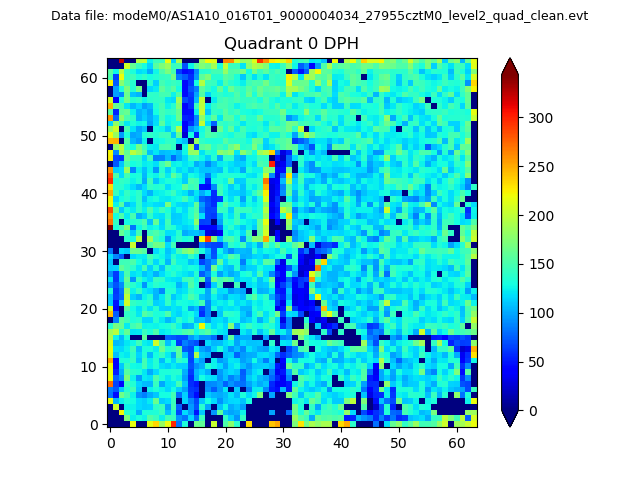 |
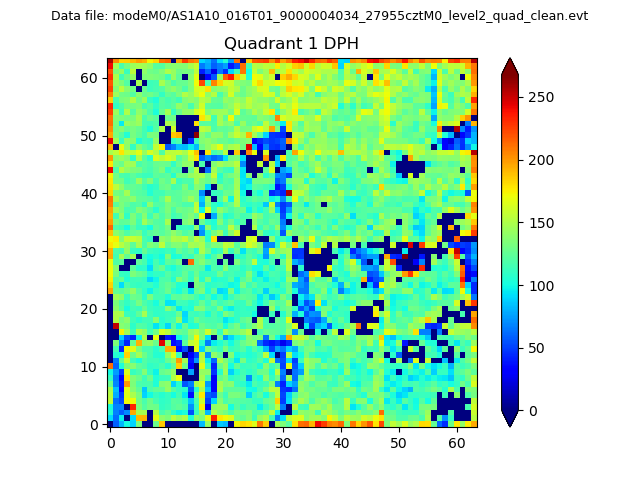 |
Quadrant B |
|---|---|---|---|
| Quadrant D | 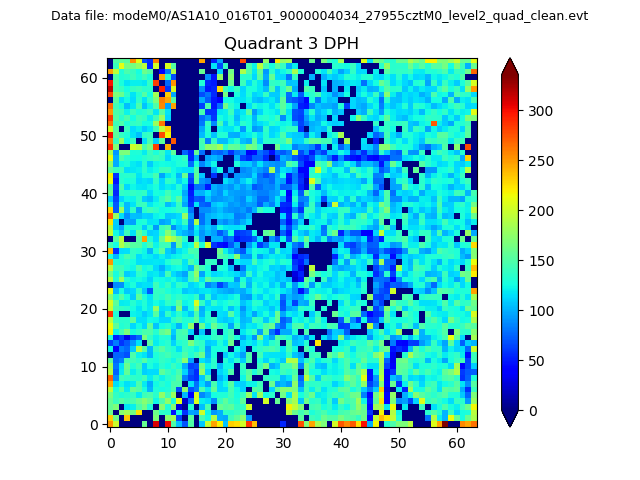 |
 |
Quadrant C |
| Plot type | Count rate plots | Images |
|---|---|---|
| Comparison with Poisson distribution Blue bars denote a histogram of data divided into 1 sec bins. Red curve is a Poisson curve with rate = median count rate of data. |
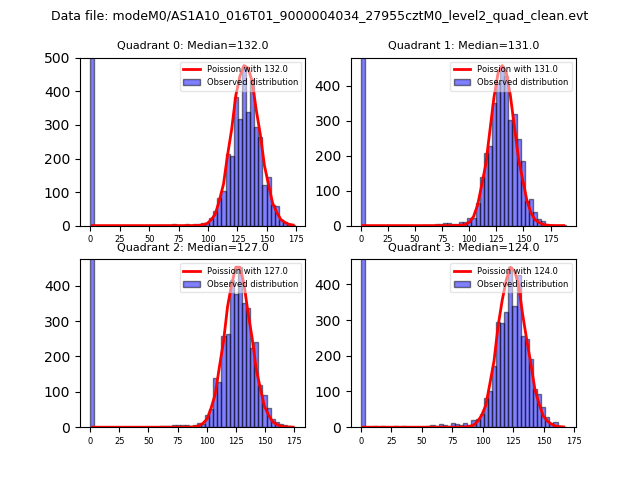 |
 |
| Quadrant-wise count rates Data is divided into 100 sec bins |
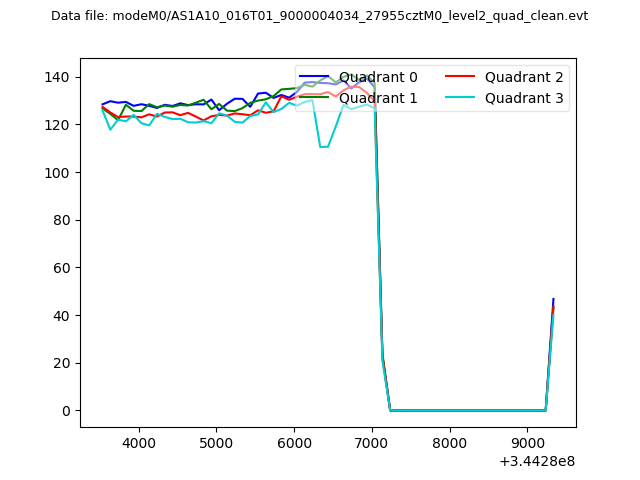 |
|
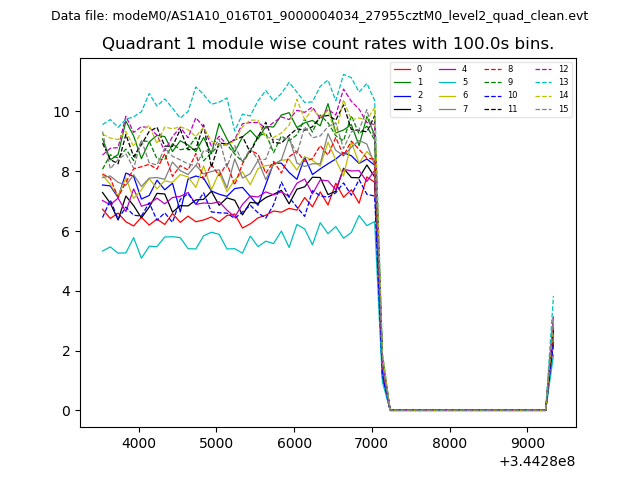
| Module-wise count rates for Quadrant A Data is divided into 100 sec bins |
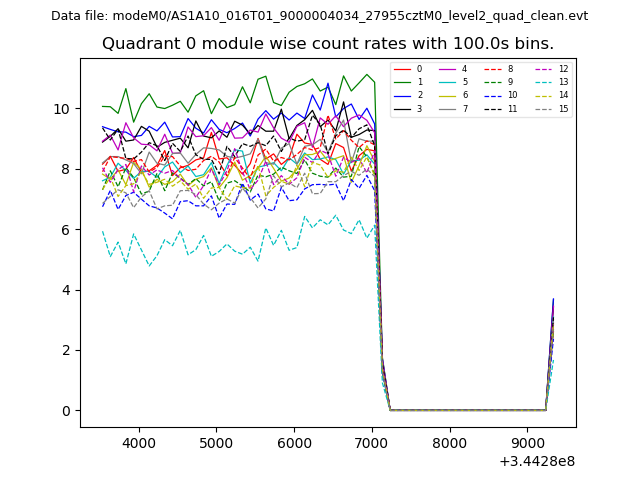 |
 |
| Module-wise count rates for Quadrant B Data is divided into 100 sec bins |
 |
 |
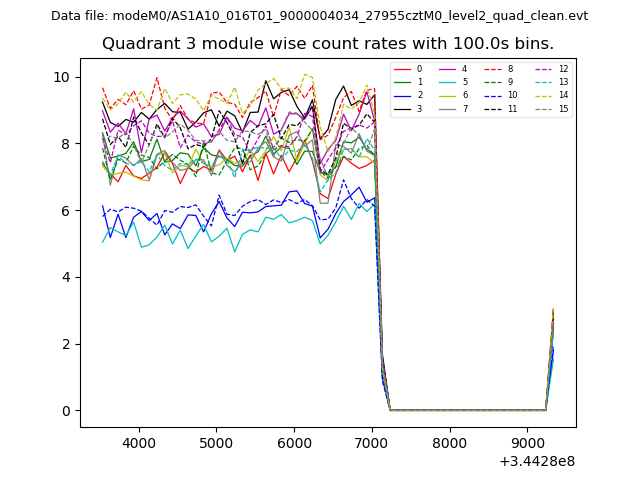
| Module-wise count rates for Quadrant C Data is divided into 100 sec bins |
 |
 |
| Module-wise count rates for Quadrant D Data is divided into 100 sec bins |
 |
 |
| Parameter | Plot |
|---|---|
| CZT HV Monitor | 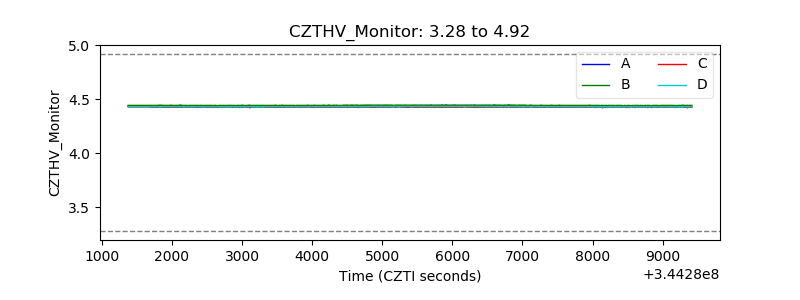 |
| D_VDD | 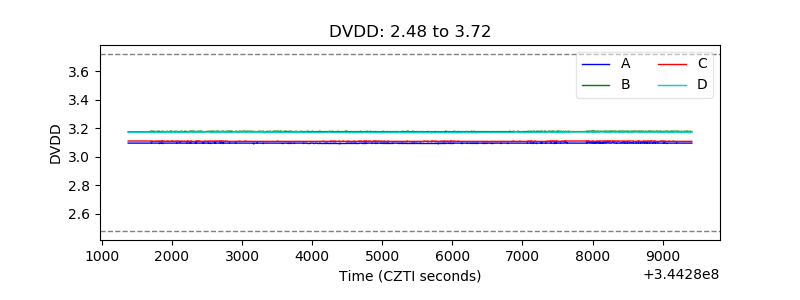 |
| Temperature 1 | 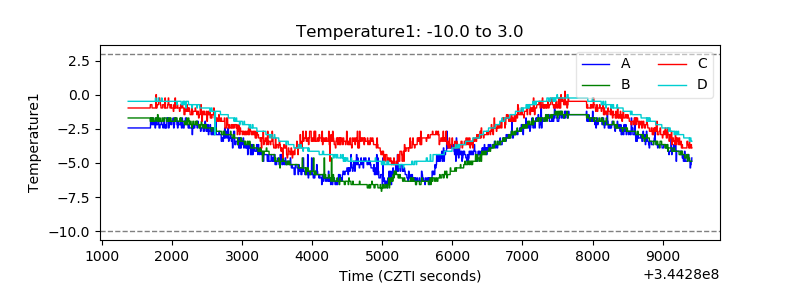 |
| Veto HV Monitor | 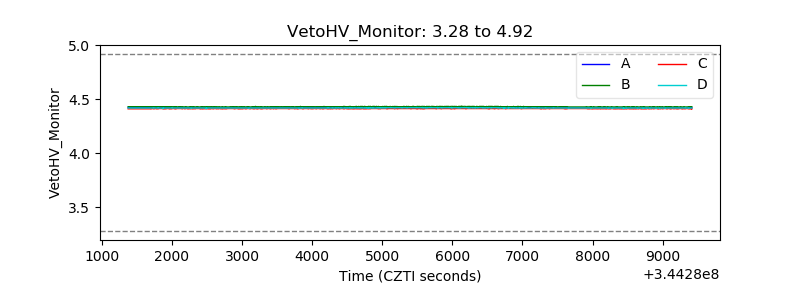 |
| Veto LLD | 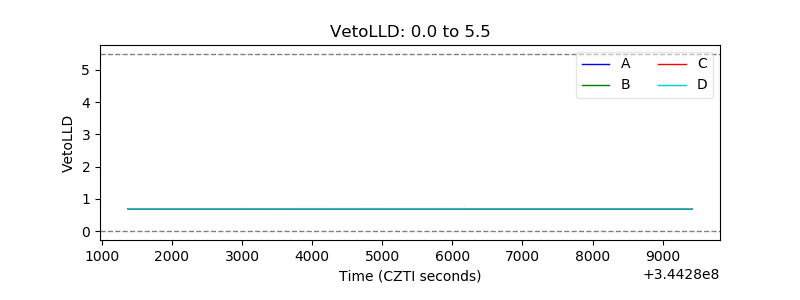 |
| Alpha Counter | 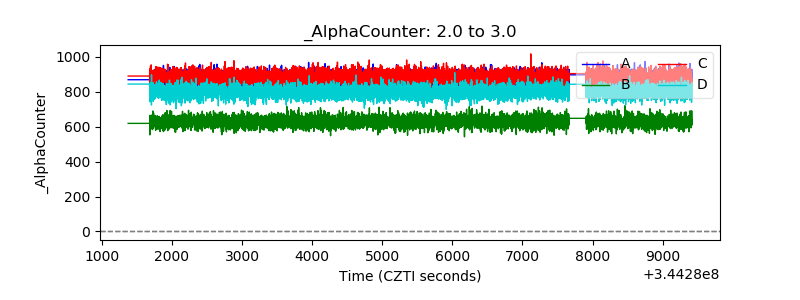 |
| _CPM_Rate | 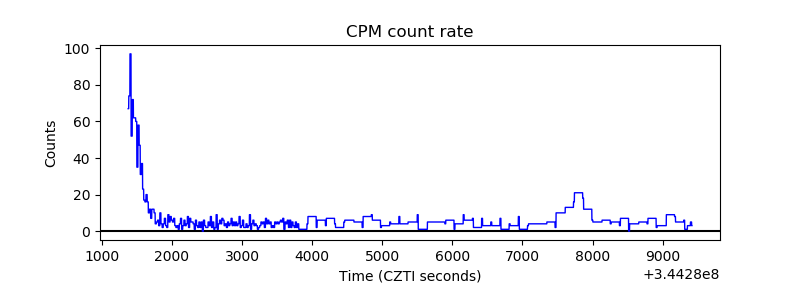 |
| CZT Counter | 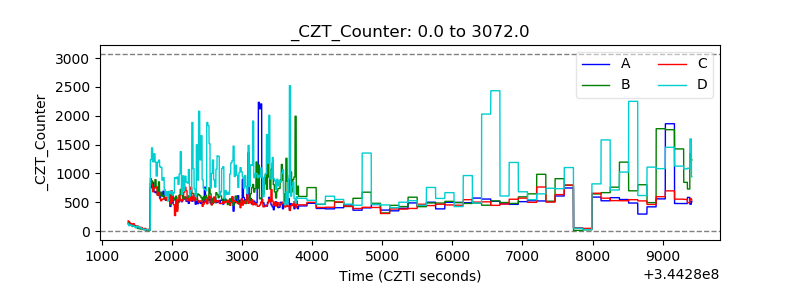 |
| +2.5 Volts monitor |  |
| +5 Volts monitor |  |
| _ROLL_ROT | 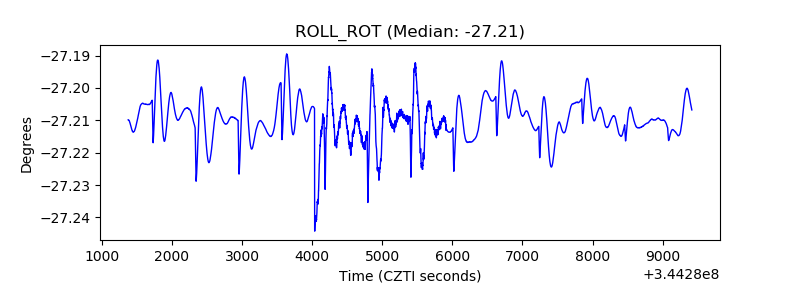 |
| _Roll_DEC | 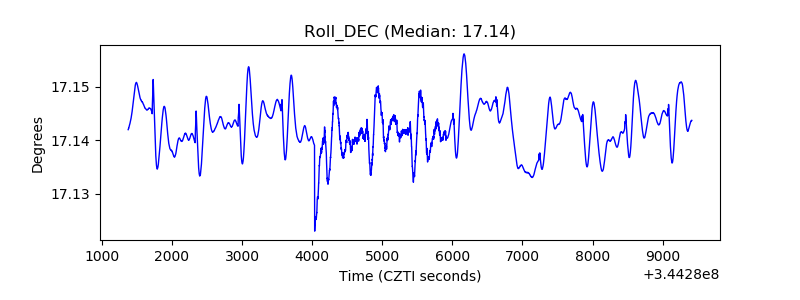 |
| _Roll_RA |  |
| Veto Counter | 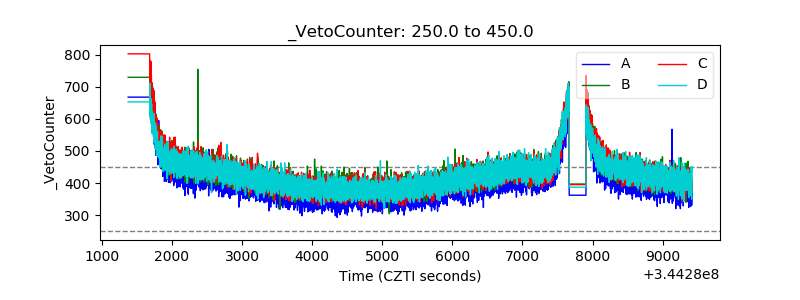 |