| Param | Original file | Final file |
|---|---|---|
| Filename | modeM0/AS1A10_016T01_9000004034_27956cztM0_level2.evt | modeM0/AS1A10_016T01_9000004034_27956cztM0_level2_quad_clean.evt |
| Size (bytes) | 171,924,480 | 12,703,680 |
| Size | 164.0 MB | 12.1 MB |
| Events in quadrant A | 857,141 | 65,991 |
| Events in quadrant B | 1,747,784 | 65,090 |
| Events in quadrant C | 866,000 | 63,760 |
| Events in quadrant D | 1,615,976 | 61,885 |
| Mode M0 | |||
|---|---|---|---|
| Quadrant | BADHDUFLAG | Total packets | Discarded packets |
| A | 0 | 3522 | 0 |
| B | 0 | 6419 | 0 |
| C | 0 | 3535 | 0 |
| D | 0 | 6051 | 0 |
| Quadrant | Total seconds | Saturated seconds | Saturation percentage |
|---|---|---|---|
| A | 1728 | 2 | 0.115741% |
| B | 1728 | 190 | 10.995370% |
| C | 1729 | 20 | 1.156738% |
| D | 1729 | 139 | 8.039329% |
Noise dominated data is calculated using 1-second bins in cleaned event files. If a bin has >2000 counts, and if more than 50% of those come from <1% of pixels, then it is considered to be noise-dominated and hence unusable.
| Quadrant | # 1 sec bins | Bins with >0 counts | Bins with >2000 counts | High rate bins dominated by noise | Noise dominated (total time) | Noise dominated (detector-on time) | Marked lightcurve |
|---|---|---|---|---|---|---|---|
| A | 1728 | 1728 | 1 | 1 | 0.06% | 0.06% |  |
| B | 1728 | 1728 | 91 | 91 | 5.27% | 5.27% |  |
| C | 1729 | 1729 | 0 | 0 | 0.00% | 0.00% |  |
| D | 1729 | 1729 | 127 | 127 | 7.35% | 7.35% |  |
Top three noisy pixels from each quadrant. If the there are fewer than three noisy pixels in the level2.evt file, extra rows are filled as -1
| Pixel properties | Quadrant properties | ||||||
|---|---|---|---|---|---|---|---|
| Quadrant | DetID | PixID | Counts | Sigma | Mean | Median | Sigma |
| A | 13 | 248 | 8067 | 168.07 | 219 | 214 | 46.7 |
| A | 13 | 254 | 3236 | 64.68 | 219 | 214 | 46.7 |
| A | 3 | 137 | 1996 | 38.14 | 219 | 214 | 46.7 |
| B | 10 | 245 | 889553 | 20790.16 | 212 | 207 | 42.8 |
| B | 0 | 230 | 10518 | 241.04 | 212 | 207 | 42.8 |
| B | 12 | 111 | 4918 | 110.13 | 212 | 207 | 42.8 |
| C | 14 | 238 | 34520 | 664.49 | 211 | 211 | 51.6 |
| C | 15 | 208 | 5861 | 109.43 | 211 | 211 | 51.6 |
| C | 13 | 61 | 1423 | 23.47 | 211 | 211 | 51.6 |
| D | 1 | 52 | 409756 | 7722.41 | 209 | 203 | 53.0 |
| D | 8 | 195 | 128470 | 2418.56 | 209 | 203 | 53.0 |
| D | 7 | 80 | 104213 | 1961.18 | 209 | 203 | 53.0 |
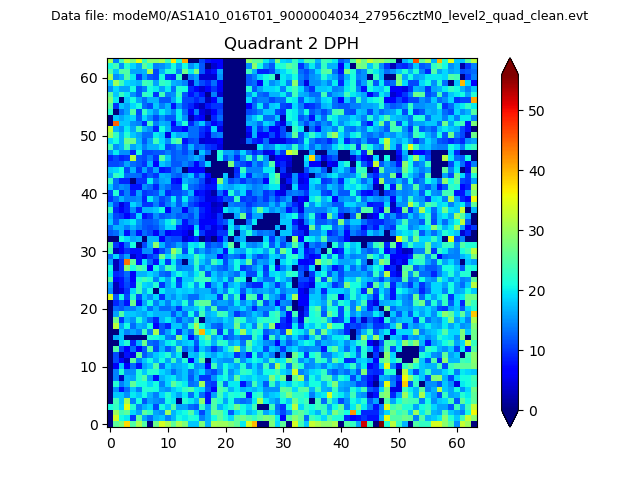
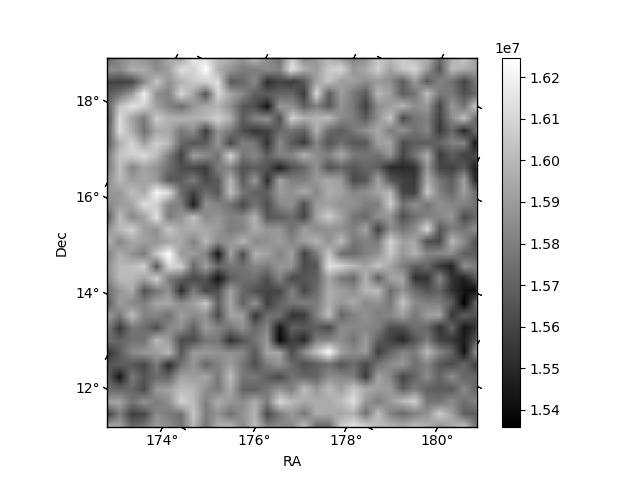
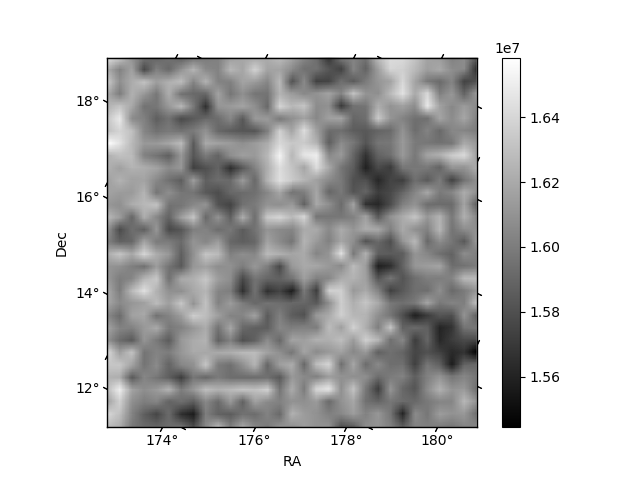
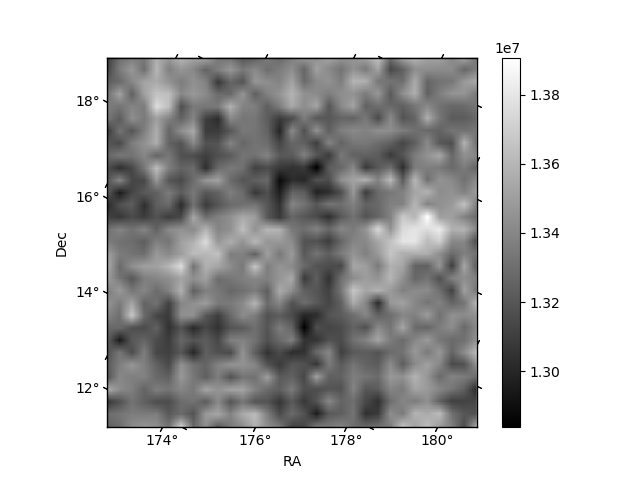
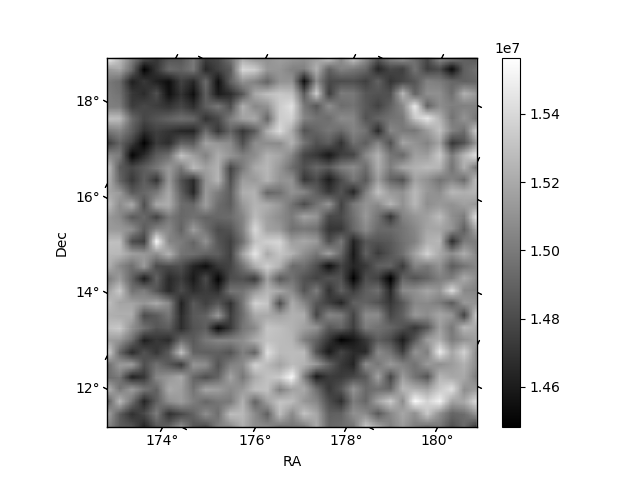
Histogram calculated using DETX and DETY for each event in the final _common_clean file
| Quadrant A | 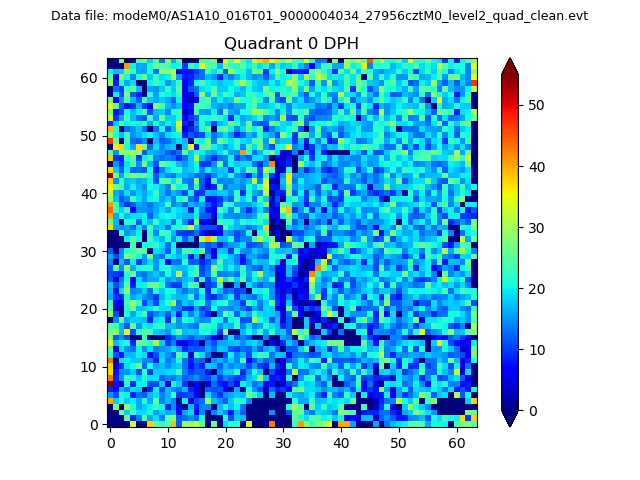 |
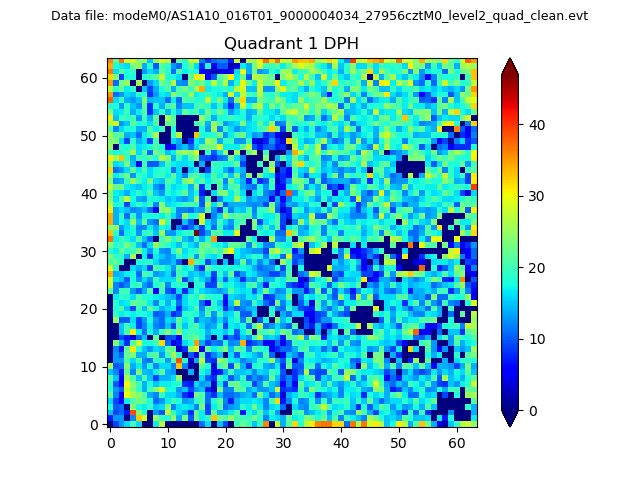 |
Quadrant B |
|---|---|---|---|
| Quadrant D | 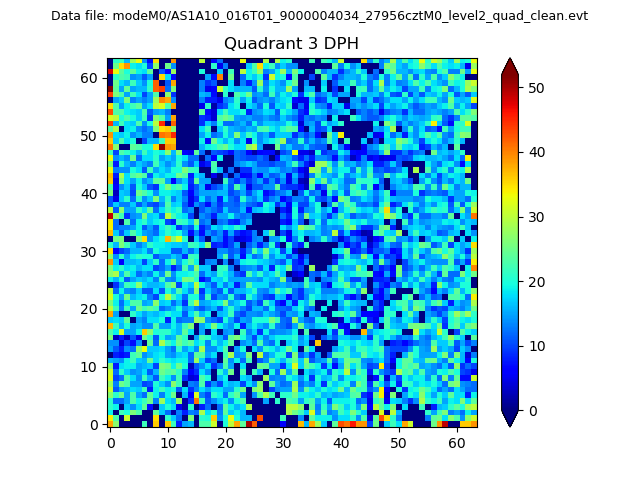 |
 |
Quadrant C |
| Plot type | Count rate plots | Images |
|---|---|---|
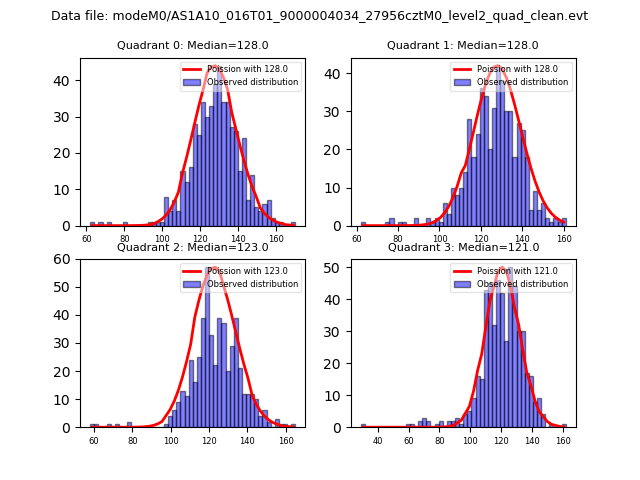
| Comparison with Poisson distribution Blue bars denote a histogram of data divided into 1 sec bins. Red curve is a Poisson curve with rate = median count rate of data. |
 |
 |
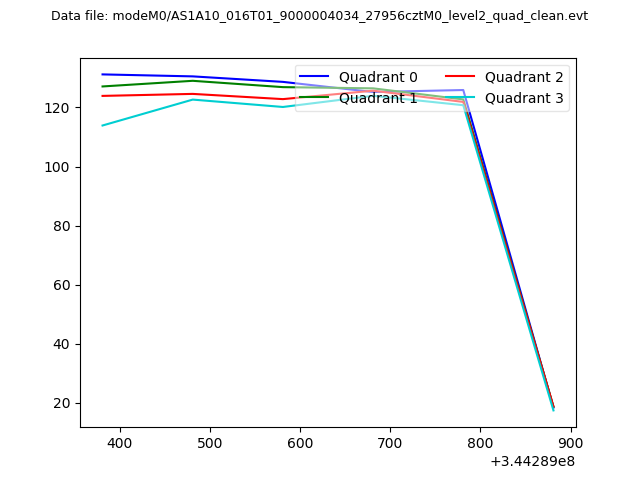
| Quadrant-wise count rates Data is divided into 100 sec bins |
 |
|
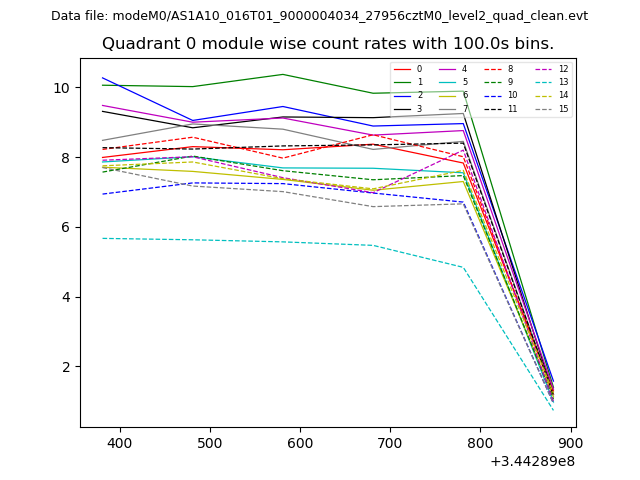
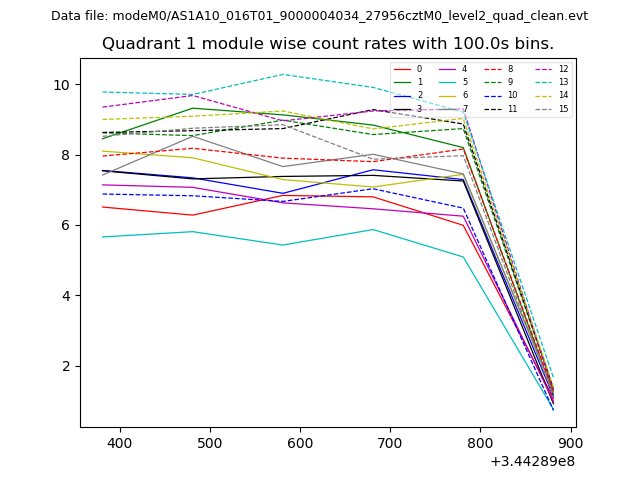
| Module-wise count rates for Quadrant A Data is divided into 100 sec bins |
 |
 |
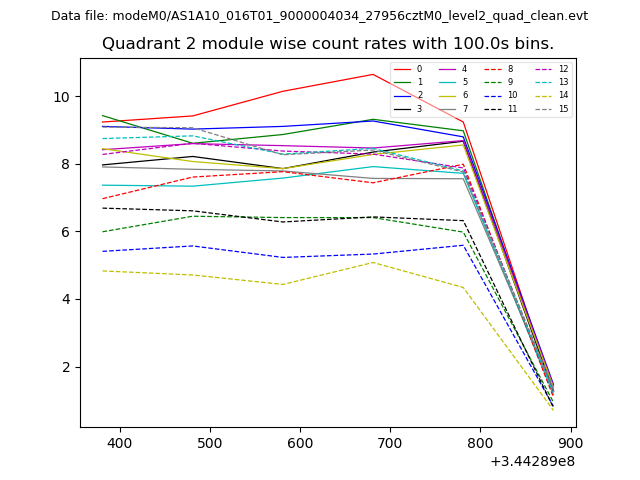
| Module-wise count rates for Quadrant B Data is divided into 100 sec bins |
 |
 |
| Module-wise count rates for Quadrant C Data is divided into 100 sec bins |
 |
 |
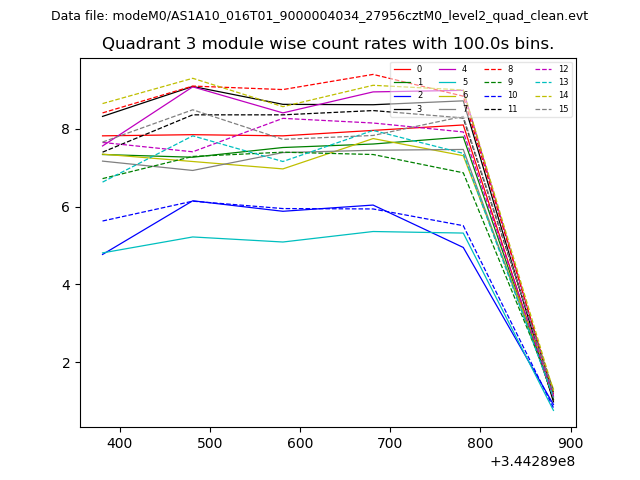
| Module-wise count rates for Quadrant D Data is divided into 100 sec bins |
 |
 |
| Parameter | Plot |
|---|---|
| CZT HV Monitor | 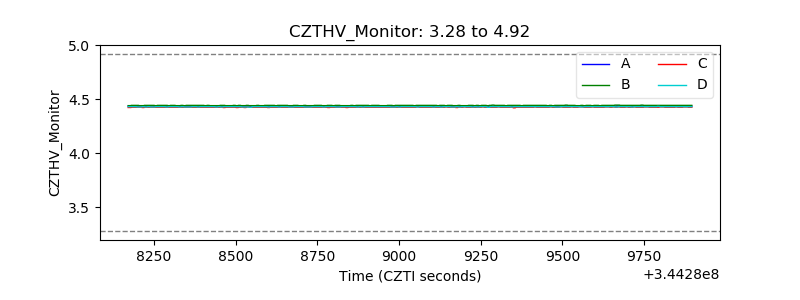 |
| D_VDD | 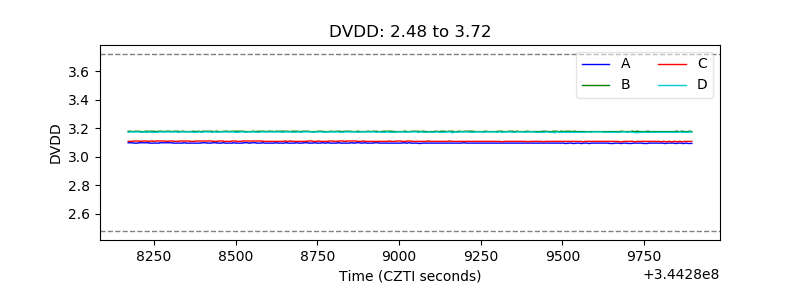 |
| Temperature 1 | 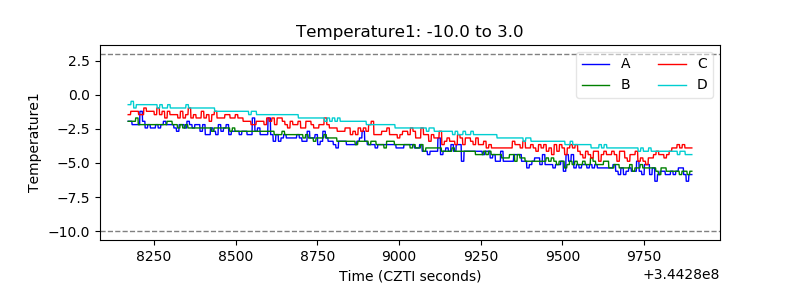 |
| Veto HV Monitor | 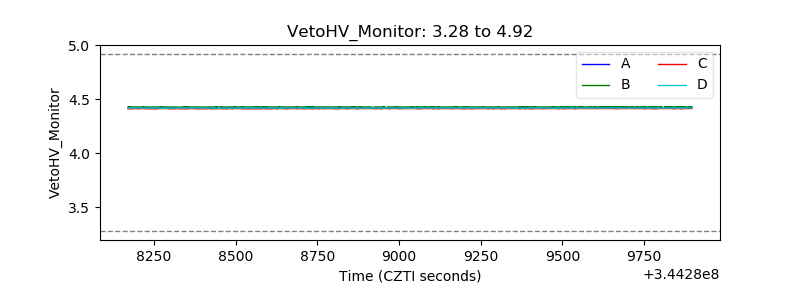 |
| Veto LLD | 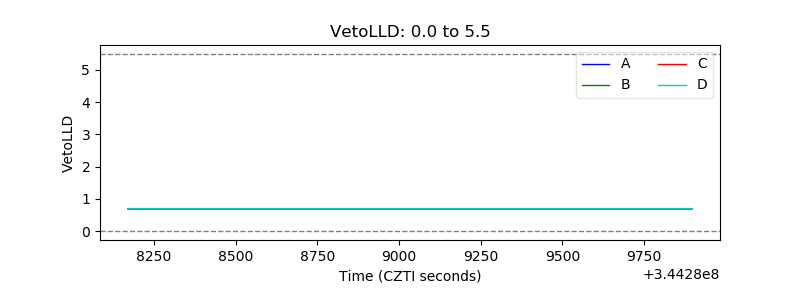 |
| Alpha Counter | 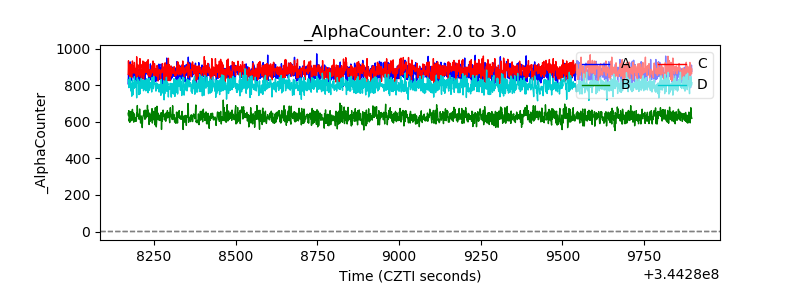 |
| _CPM_Rate | 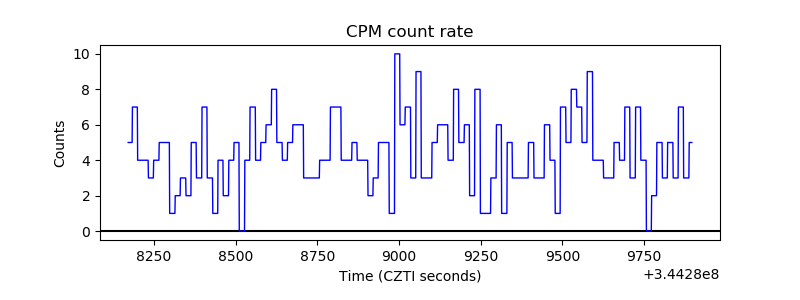 |
| CZT Counter | 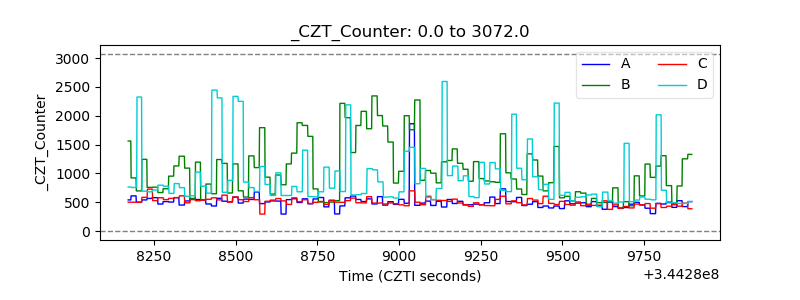 |
| +2.5 Volts monitor |  |
| +5 Volts monitor | 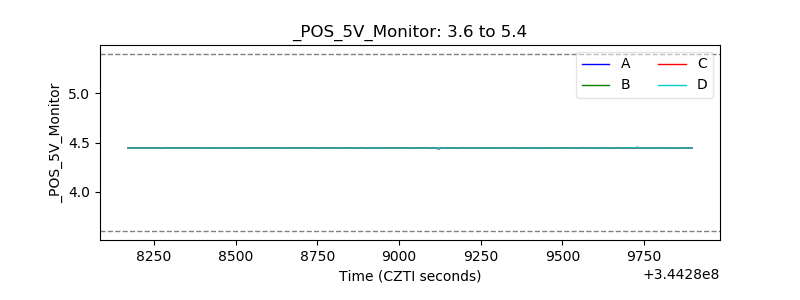 |
| _ROLL_ROT | 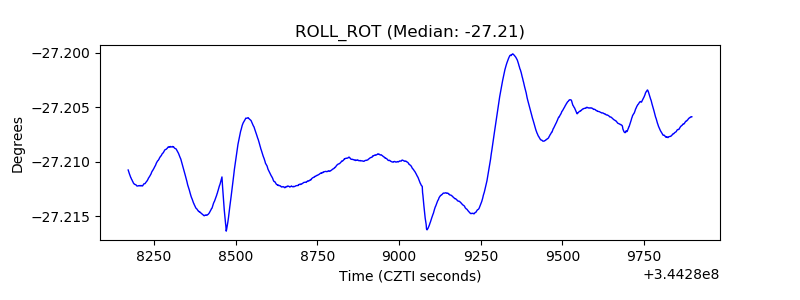 |
| _Roll_DEC | 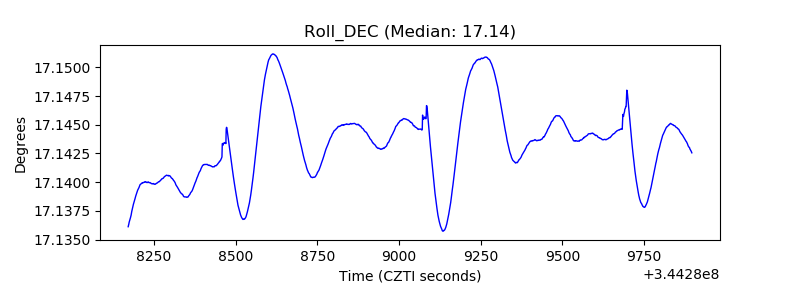 |
| _Roll_RA | 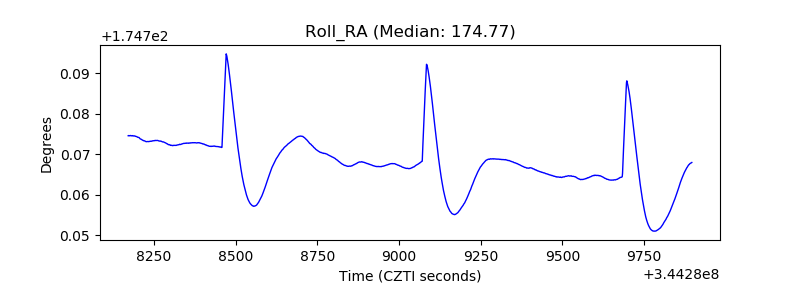 |
| Veto Counter | 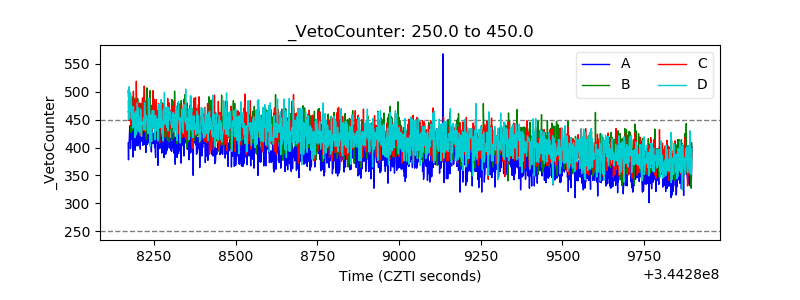 |