| Param | Original file | Final file |
|---|---|---|
| Filename | modeM0/AS1A10_021T02_9000004036cztM0_level2.fits | modeM0/AS1A10_021T02_9000004036cztM0_level2_quad_clean.evt |
| Size (bytes) | 240,439,680 | 252,305,280 |
| Size | 229.3 MB | 240.6 MB |
| Events in quadrant A | 1,477,044 | 1,577,453 |
| Events in quadrant B | 1,403,114 | 1,569,751 |
| Events in quadrant C | 1,444,324 | 1,477,229 |
| Events in quadrant D | 1,201,436 | 1,261,372 |
| Mode M0 | |||
|---|---|---|---|
| Quadrant | BADHDUFLAG | Total packets | Discarded packets |
| A | 0 | 52664 | 0 |
| B | 0 | 60339 | 0 |
| C | 0 | 52930 | 0 |
| D | 0 | 87961 | 0 |
| Mode M9 | |||
|---|---|---|---|
| Quadrant | BADHDUFLAG | Total packets | Discarded packets |
| A | 0 | 19 | 0 |
| B | 0 | 19 | 0 |
| C | 0 | 19 | 0 |
| D | 0 | 19 | 0 |
| Mode SS | |||
|---|---|---|---|
| Quadrant | BADHDUFLAG | Total packets | Discarded packets |
| A | 0 | 518 | 0 |
| B | 0 | 518 | 0 |
| C | 0 | 518 | 0 |
| D | 0 | 518 | 0 |
| Quadrant | Total seconds | Saturated seconds | Saturation percentage |
|---|---|---|---|
| A | 25522 | 209 | 0.818901% |
| B | 25522 | 441 | 1.727921% |
| C | 25522 | 323 | 1.265575% |
| D | 25522 | 2370 | 9.286106% |
Noise dominated data is calculated using 1-second bins in cleaned event files. If a bin has >2000 counts, and if more than 50% of those come from <1% of pixels, then it is considered to be noise-dominated and hence unusable.
| Quadrant | # 1 sec bins | Bins with >0 counts | Bins with >2000 counts | High rate bins dominated by noise | Noise dominated (total time) | Noise dominated (detector-on time) | Marked lightcurve |
|---|---|---|---|---|---|---|---|
| A | 27347 | 25521 | 0 | 0 | 0.00% | 0.00% |  |
| B | 27347 | 25519 | 0 | 0 | 0.00% | 0.00% |  |
| C | 27347 | 25522 | 0 | 0 | 0.00% | 0.00% |  |
| D | 27346 | 25486 | 0 | 0 | 0.00% | 0.00% |  |
Top three noisy pixels from each quadrant. If the there are fewer than three noisy pixels in the level2.evt file, extra rows are filled as -1
| Pixel properties | Quadrant properties | ||||||
|---|---|---|---|---|---|---|---|
| Quadrant | DetID | PixID | Counts | Sigma | Mean | Median | Sigma |
| A | 0 | 29 | 1215 | 8.82 | 384 | 360 | 96.9 |
| A | 7 | 110 | 1163 | 8.28 | 384 | 360 | 96.9 |
| A | 0 | 30 | 1120 | 7.84 | 384 | 360 | 96.9 |
| B | 2 | 9 | 1116 | 10.24 | 371 | 353 | 74.5 |
| B | 2 | 8 | 972 | 8.31 | 371 | 353 | 74.5 |
| B | 3 | 17 | 947 | 7.97 | 371 | 353 | 74.5 |
| C | 1 | 80 | 1078 | 7.45 | 380 | 356 | 96.9 |
| C | 1 | 81 | 1052 | 7.19 | 380 | 356 | 96.9 |
| C | 3 | 126 | 1030 | 6.96 | 380 | 356 | 96.9 |
| D | 4 | 246 | 915 | 6.53 | 343 | 313 | 92.2 |
| D | 15 | 47 | 890 | 6.26 | 343 | 313 | 92.2 |
| D | 3 | 159 | 832 | 5.63 | 343 | 313 | 92.2 |
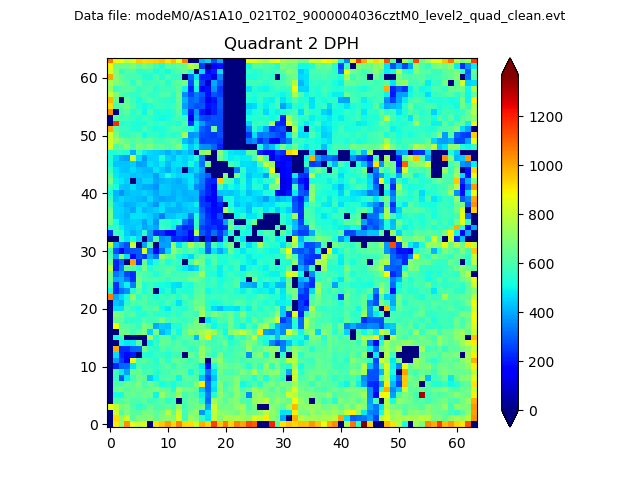
Histogram calculated using DETX and DETY for each event in the final _common_clean file
| Quadrant A |  |
 |
Quadrant B |
|---|---|---|---|
| Quadrant D |  |
 |
Quadrant C |
| Plot type | Count rate plots | Images |
|---|---|---|
| Comparison with Poisson distribution Blue bars denote a histogram of data divided into 1 sec bins. Red curve is a Poisson curve with rate = median count rate of data. |
 |
 |
| Quadrant-wise count rates Data is divided into 100 sec bins |
 |
|
| Module-wise count rates for Quadrant A Data is divided into 100 sec bins |
 |
 |
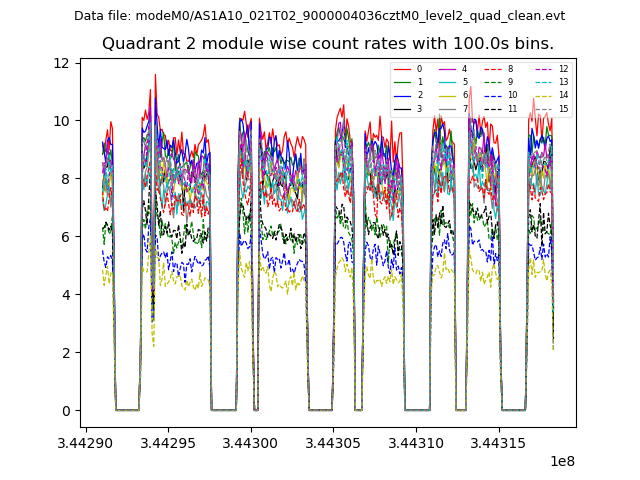
| Module-wise count rates for Quadrant B Data is divided into 100 sec bins |
 |
 |
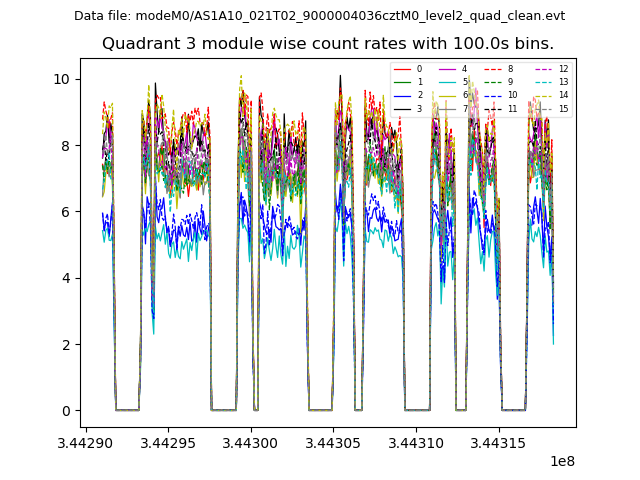
| Module-wise count rates for Quadrant C Data is divided into 100 sec bins |
 |
 |
| Module-wise count rates for Quadrant D Data is divided into 100 sec bins |
 |
 |
| Parameter | Plot |
|---|---|
| CZT HV Monitor |  |
| D_VDD | 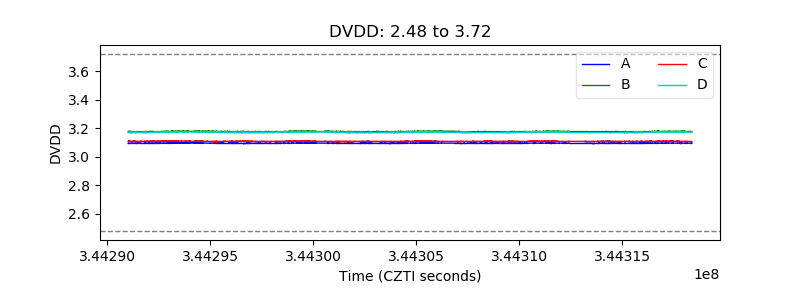 |
| Temperature 1 |  |
| Veto HV Monitor | 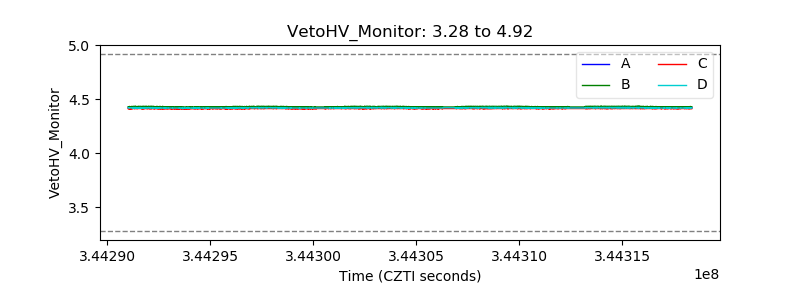 |
| Veto LLD |  |
| Alpha Counter |  |
| _CPM_Rate |  |
| CZT Counter |  |
| +2.5 Volts monitor |  |
| +5 Volts monitor |  |
| _ROLL_ROT |  |
| _Roll_DEC |  |
| _Roll_RA | 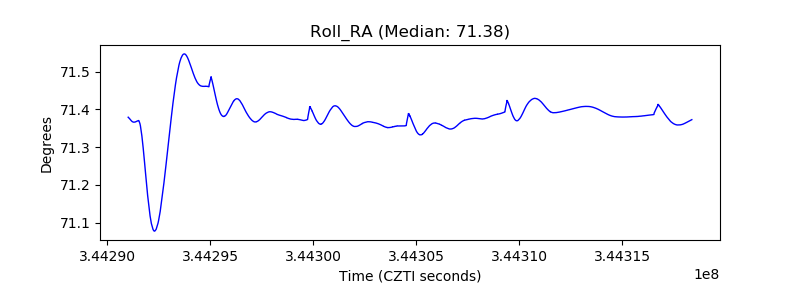 |
| Veto Counter |  |