| Param | Original file | Final file |
|---|---|---|
| Filename | modeM0/AS1A10_021T02_9000004036_27956cztM0_level2.evt | modeM0/AS1A10_021T02_9000004036_27956cztM0_level2_quad_clean.evt |
| Size (bytes) | 414,947,520 | 63,262,080 |
| Size | 395.7 MB | 60.3 MB |
| Events in quadrant A | 2,330,860 | 409,892 |
| Events in quadrant B | 2,837,910 | 405,394 |
| Events in quadrant C | 2,341,153 | 393,251 |
| Events in quadrant D | 4,732,770 | 371,804 |
| Mode M0 | |||
|---|---|---|---|
| Quadrant | BADHDUFLAG | Total packets | Discarded packets |
| A | 0 | 9958 | 0 |
| B | 0 | 11571 | 0 |
| C | 0 | 9960 | 0 |
| D | 0 | 17339 | 0 |
| Mode M9 | |||
|---|---|---|---|
| Quadrant | BADHDUFLAG | Total packets | Discarded packets |
| A | 0 | 2 | 0 |
| B | 0 | 2 | 0 |
| C | 0 | 2 | 0 |
| D | 0 | 2 | 0 |
| Quadrant | Total seconds | Saturated seconds | Saturation percentage |
|---|---|---|---|
| A | 4774 | 54 | 1.131127% |
| B | 4774 | 219 | 4.587348% |
| C | 4774 | 108 | 2.262254% |
| D | 4774 | 448 | 9.384164% |
Noise dominated data is calculated using 1-second bins in cleaned event files. If a bin has >2000 counts, and if more than 50% of those come from <1% of pixels, then it is considered to be noise-dominated and hence unusable.
| Quadrant | # 1 sec bins | Bins with >0 counts | Bins with >2000 counts | High rate bins dominated by noise | Noise dominated (total time) | Noise dominated (detector-on time) | Marked lightcurve |
|---|---|---|---|---|---|---|---|
| A | 4889 | 4776 | 0 | 0 | 0.00% | 0.00% | 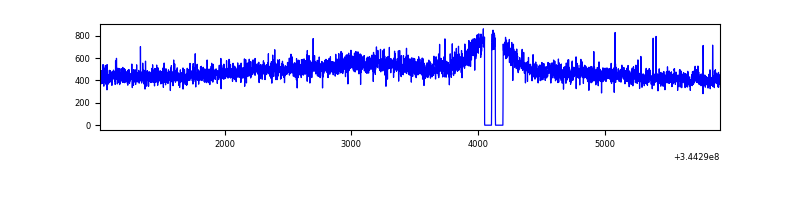 |
| B | 4889 | 4775 | 71 | 71 | 1.45% | 1.49% | 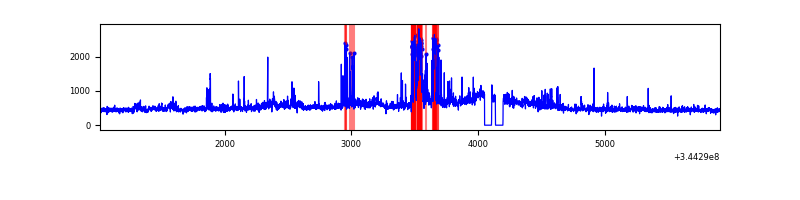 |
| C | 4889 | 4776 | 0 | 0 | 0.00% | 0.00% | 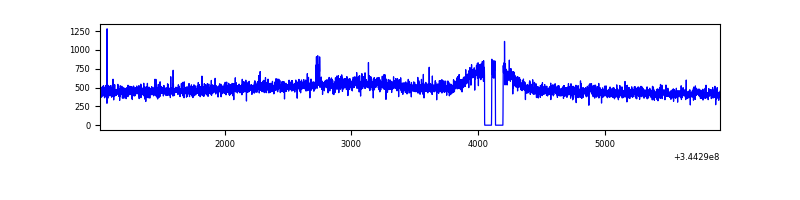 |
| D | 4889 | 4776 | 336 | 336 | 6.87% | 7.04% | 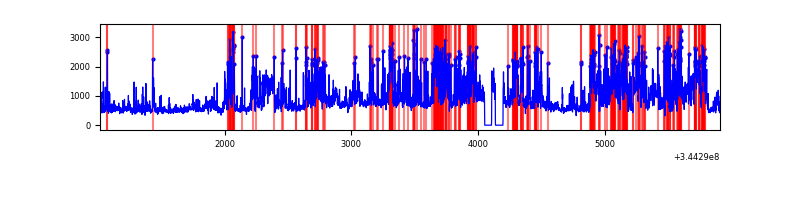 |
Top three noisy pixels from each quadrant. If the there are fewer than three noisy pixels in the level2.evt file, extra rows are filled as -1
| Pixel properties | Quadrant properties | ||||||
|---|---|---|---|---|---|---|---|
| Quadrant | DetID | PixID | Counts | Sigma | Mean | Median | Sigma |
| A | 13 | 254 | 8325 | 62.93 | 600 | 585 | 123.0 |
| A | 6 | 16 | 7566 | 56.76 | 600 | 585 | 123.0 |
| A | 3 | 137 | 5737 | 41.89 | 600 | 585 | 123.0 |
| B | 10 | 245 | 250166 | 2200.7 | 588 | 573 | 113.4 |
| B | 5 | 172 | 203056 | 1785.33 | 588 | 573 | 113.4 |
| B | 0 | 230 | 25220 | 217.32 | 588 | 573 | 113.4 |
| C | 14 | 238 | 91672 | 672.56 | 573 | 573 | 135.5 |
| C | 3 | 233 | 7476 | 50.96 | 573 | 573 | 135.5 |
| C | 2 | 16 | 5852 | 38.97 | 573 | 573 | 135.5 |
| D | 1 | 52 | 1757019 | 12862.58 | 565 | 548 | 136.6 |
| D | 8 | 195 | 343241 | 2509.53 | 565 | 548 | 136.6 |
| D | 2 | 250 | 222053 | 1622.07 | 565 | 548 | 136.6 |
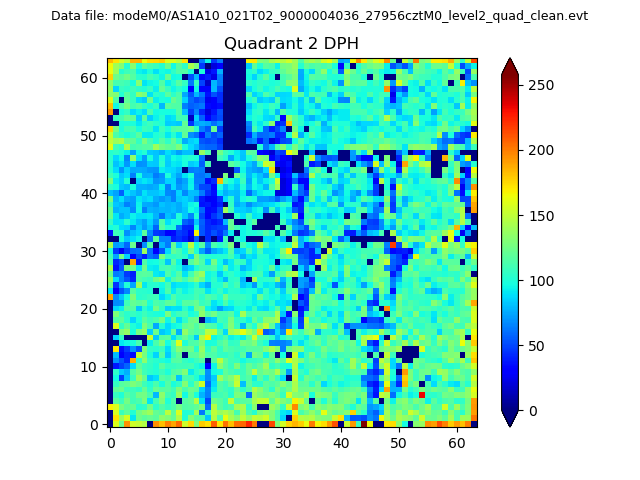
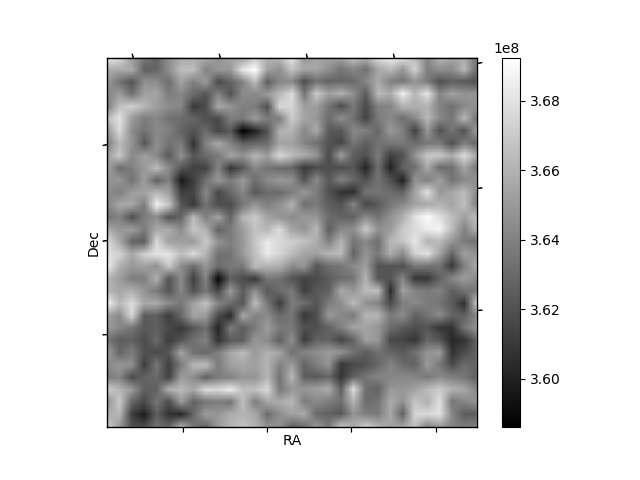
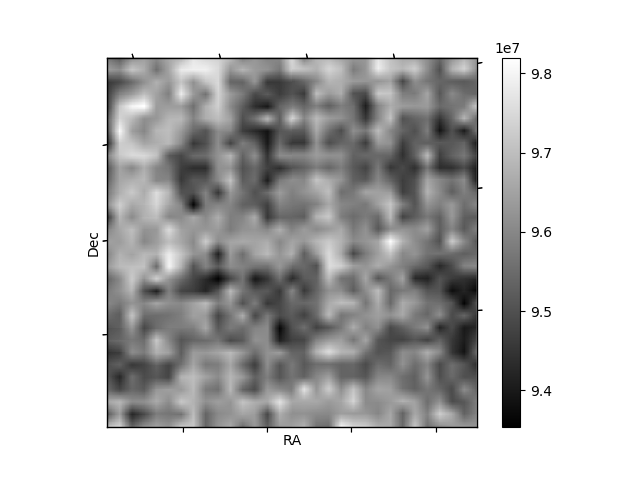
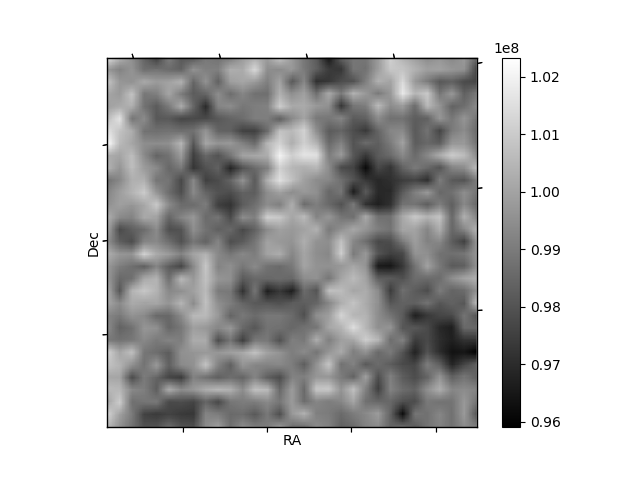
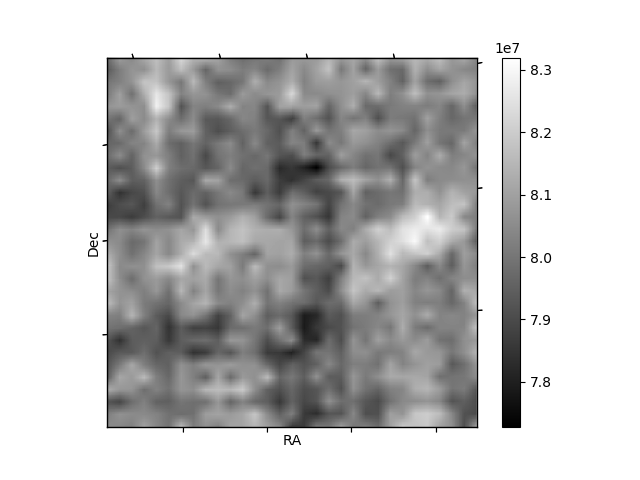
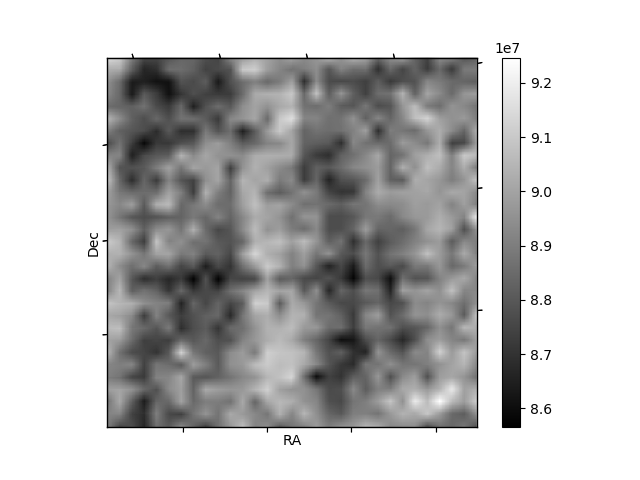
Histogram calculated using DETX and DETY for each event in the final _common_clean file
| Quadrant A | 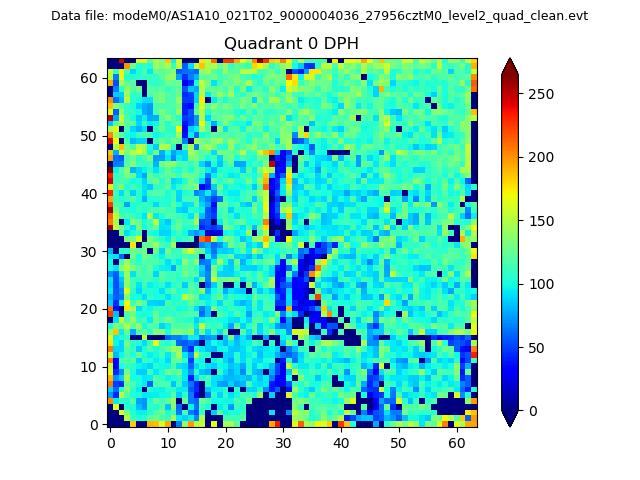 |
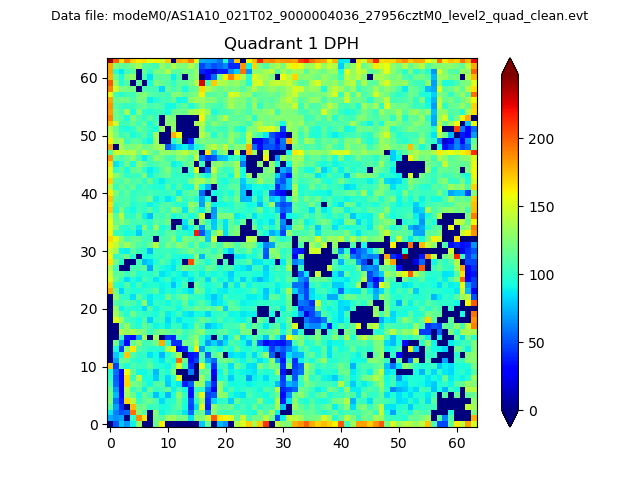 |
Quadrant B |
|---|---|---|---|
| Quadrant D | 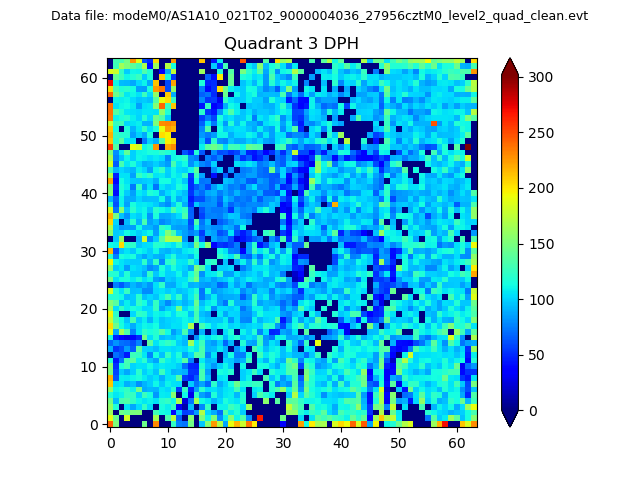 |
 |
Quadrant C |
| Plot type | Count rate plots | Images |
|---|---|---|
| Comparison with Poisson distribution Blue bars denote a histogram of data divided into 1 sec bins. Red curve is a Poisson curve with rate = median count rate of data. |
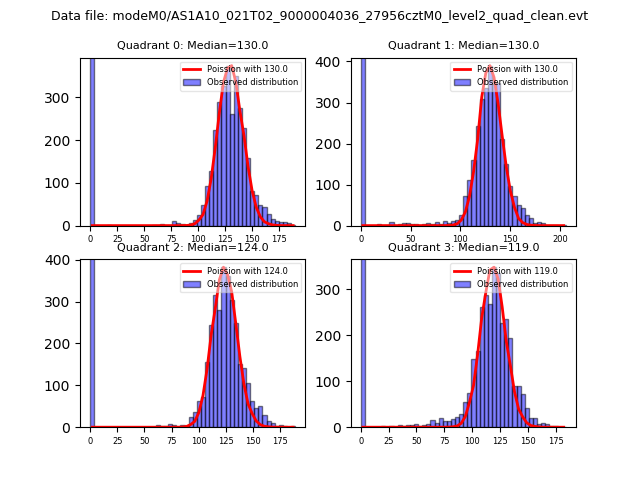 |
 |
| Quadrant-wise count rates Data is divided into 100 sec bins |
 |
|
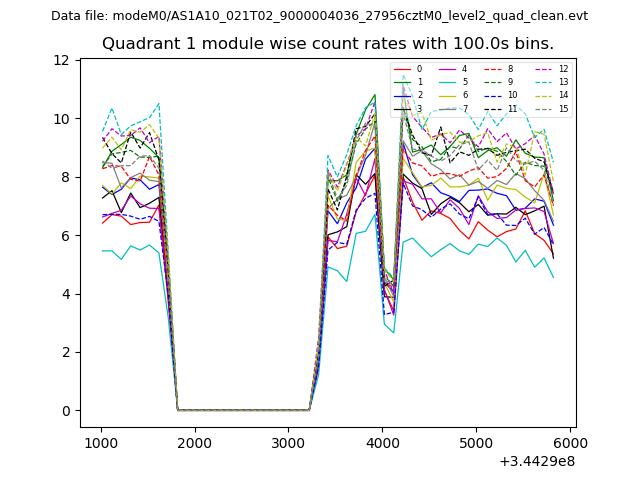
| Module-wise count rates for Quadrant A Data is divided into 100 sec bins |
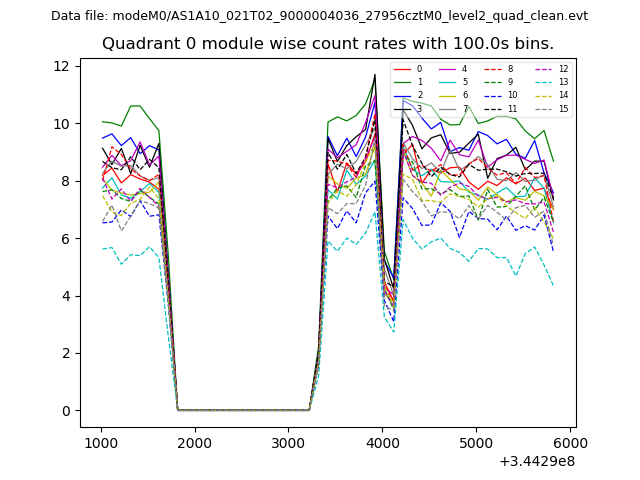 |
 |
| Module-wise count rates for Quadrant B Data is divided into 100 sec bins |
 |
 |
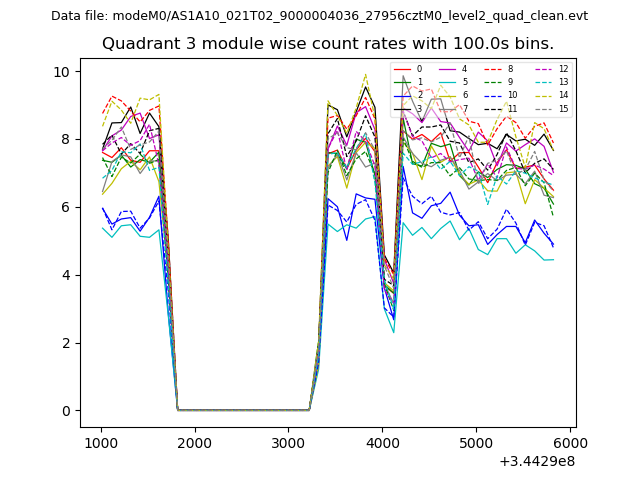
| Module-wise count rates for Quadrant C Data is divided into 100 sec bins |
 |
 |
| Module-wise count rates for Quadrant D Data is divided into 100 sec bins |
 |
 |
| Parameter | Plot |
|---|---|
| CZT HV Monitor | 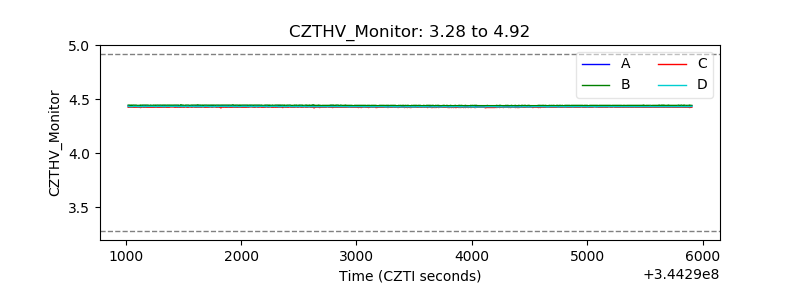 |
| D_VDD | 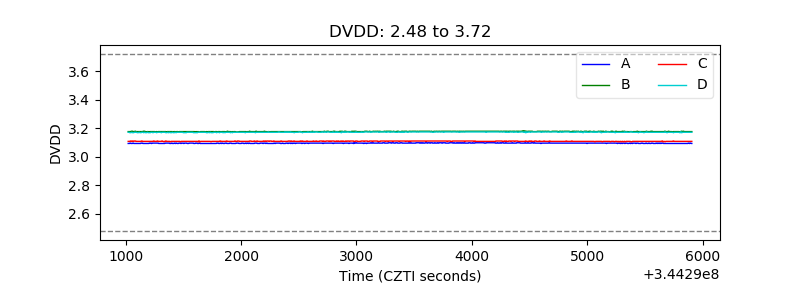 |
| Temperature 1 | 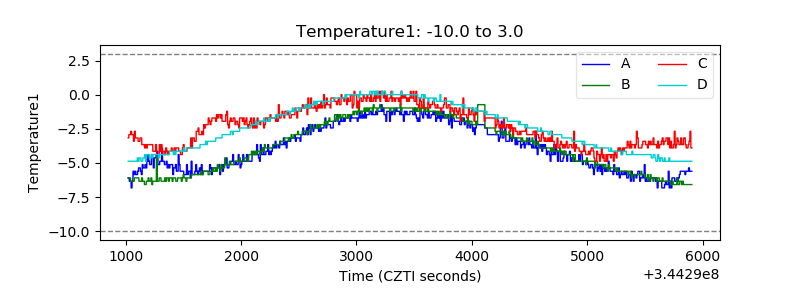 |
| Veto HV Monitor | 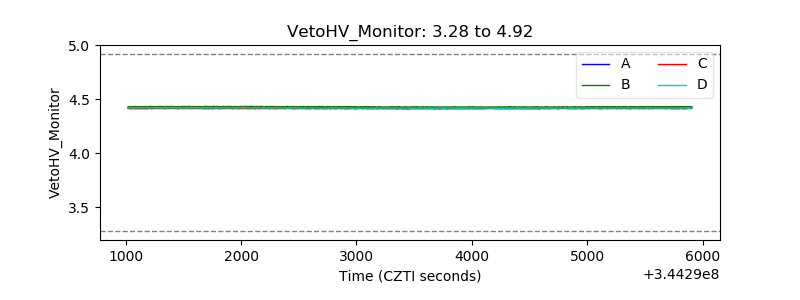 |
| Veto LLD | 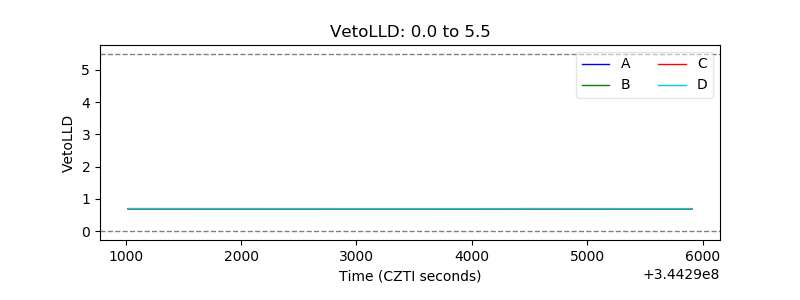 |
| Alpha Counter | 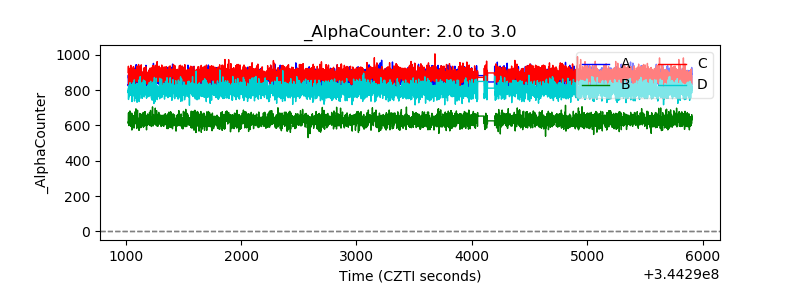 |
| _CPM_Rate | 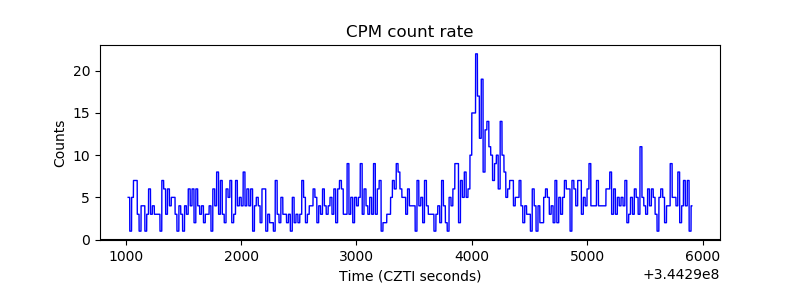 |
| CZT Counter | 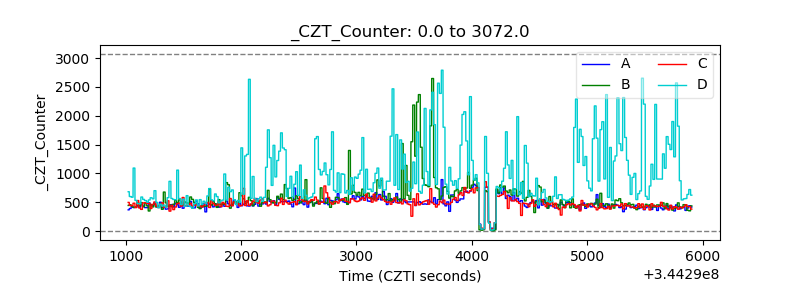 |
| +2.5 Volts monitor | 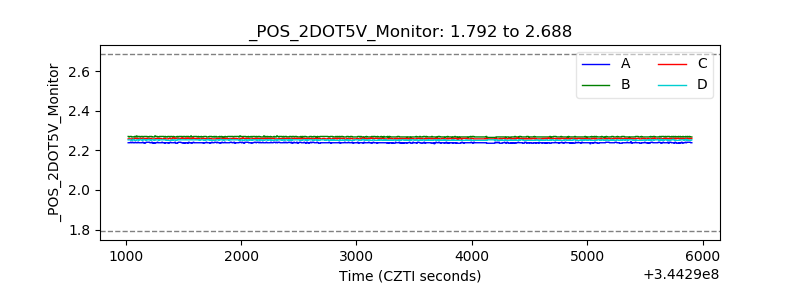 |
| +5 Volts monitor |  |
| _ROLL_ROT | 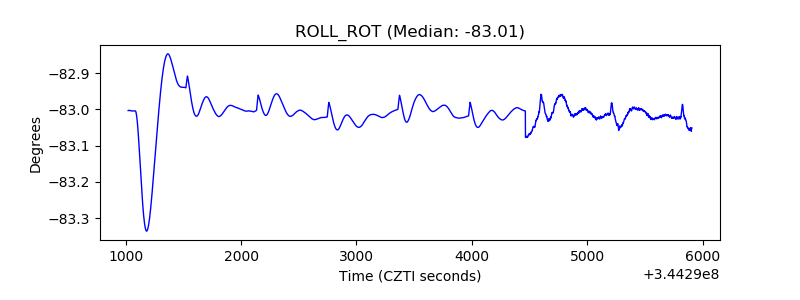 |
| _Roll_DEC | 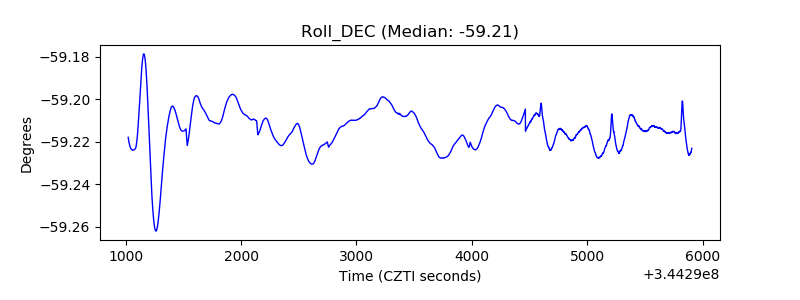 |
| _Roll_RA | 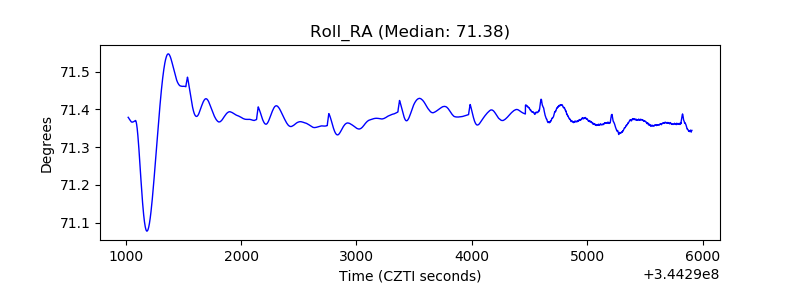 |
| Veto Counter | 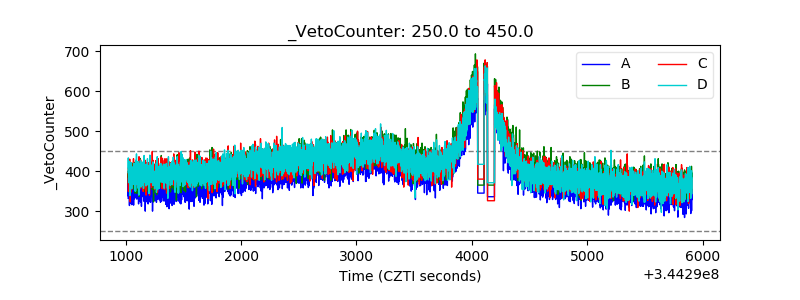 |