| Param | Original file | Final file |
|---|---|---|
| Filename | modeM0/AS1A10_021T02_9000004036_27957cztM0_level2.evt | modeM0/AS1A10_021T02_9000004036_27957cztM0_level2_quad_clean.evt |
| Size (bytes) | 658,805,760 | 124,217,280 |
| Size | 628.3 MB | 118.5 MB |
| Events in quadrant A | 4,018,051 | 825,488 |
| Events in quadrant B | 4,184,228 | 833,818 |
| Events in quadrant C | 3,834,842 | 791,642 |
| Events in quadrant D | 7,368,545 | 750,261 |
| Mode M0 | |||
|---|---|---|---|
| Quadrant | BADHDUFLAG | Total packets | Discarded packets |
| A | 0 | 17383 | 0 |
| B | 0 | 17716 | 0 |
| C | 0 | 16732 | 0 |
| D | 0 | 27449 | 0 |
| Mode M9 | |||
|---|---|---|---|
| Quadrant | BADHDUFLAG | Total packets | Discarded packets |
| A | 0 | 6 | 0 |
| B | 0 | 6 | 0 |
| C | 0 | 6 | 0 |
| D | 0 | 6 | 0 |
| Quadrant | Total seconds | Saturated seconds | Saturation percentage |
|---|---|---|---|
| A | 8069 | 172 | 2.131615% |
| B | 8070 | 178 | 2.205700% |
| C | 8070 | 138 | 1.710037% |
| D | 8070 | 647 | 8.017348% |
Noise dominated data is calculated using 1-second bins in cleaned event files. If a bin has >2000 counts, and if more than 50% of those come from <1% of pixels, then it is considered to be noise-dominated and hence unusable.
| Quadrant | # 1 sec bins | Bins with >0 counts | Bins with >2000 counts | High rate bins dominated by noise | Noise dominated (total time) | Noise dominated (detector-on time) | Marked lightcurve |
|---|---|---|---|---|---|---|---|
| A | 8559 | 8072 | 110 | 110 | 1.29% | 1.36% | 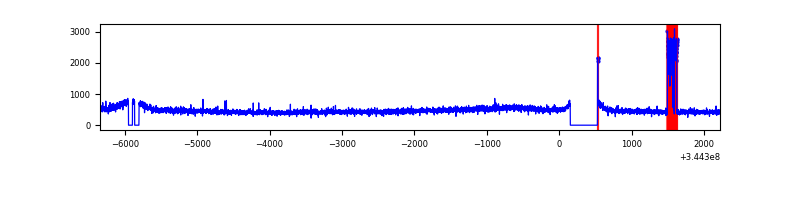 |
| B | 8560 | 8072 | 15 | 15 | 0.18% | 0.19% | 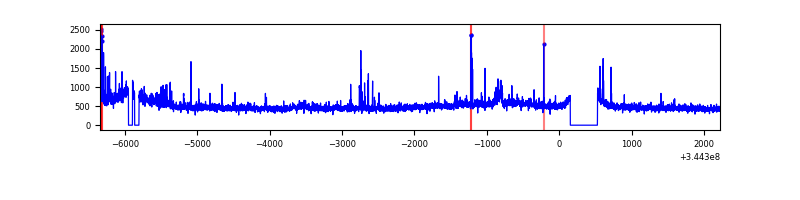 |
| C | 8560 | 8073 | 0 | 0 | 0.00% | 0.00% |  |
| D | 8560 | 8072 | 564 | 564 | 6.59% | 6.99% | 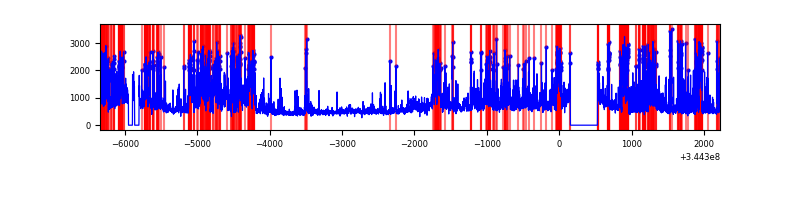 |
Top three noisy pixels from each quadrant. If the there are fewer than three noisy pixels in the level2.evt file, extra rows are filled as -1
| Pixel properties | Quadrant properties | ||||||
|---|---|---|---|---|---|---|---|
| Quadrant | DetID | PixID | Counts | Sigma | Mean | Median | Sigma |
| A | 6 | 16 | 263623 | 1336.19 | 970 | 946 | 196.6 |
| A | 13 | 254 | 13756 | 65.16 | 970 | 946 | 196.6 |
| A | 3 | 137 | 9316 | 42.58 | 970 | 946 | 196.6 |
| B | 10 | 245 | 240908 | 1303.32 | 971 | 946 | 184.1 |
| B | 0 | 230 | 35793 | 189.27 | 971 | 946 | 184.1 |
| B | 5 | 172 | 30683 | 161.51 | 971 | 946 | 184.1 |
| C | 14 | 238 | 149049 | 678.9 | 932 | 935 | 218.2 |
| C | 3 | 233 | 44404 | 199.25 | 932 | 935 | 218.2 |
| C | 2 | 16 | 10049 | 41.78 | 932 | 935 | 218.2 |
| D | 1 | 52 | 2256133 | 10292.47 | 916 | 889 | 219.1 |
| D | 7 | 80 | 647458 | 2950.81 | 916 | 889 | 219.1 |
| D | 8 | 195 | 488599 | 2225.81 | 916 | 889 | 219.1 |
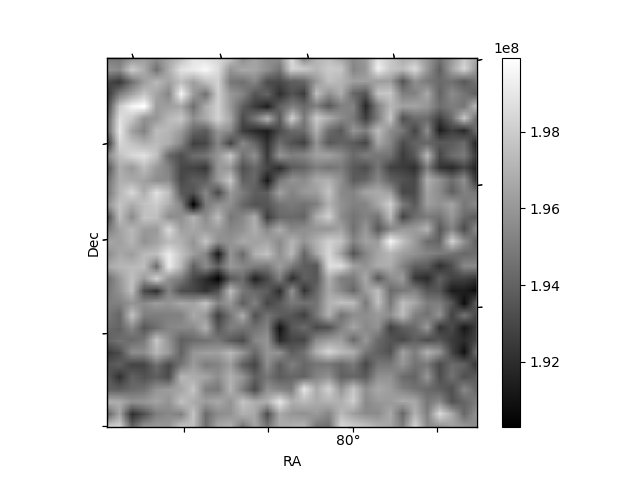
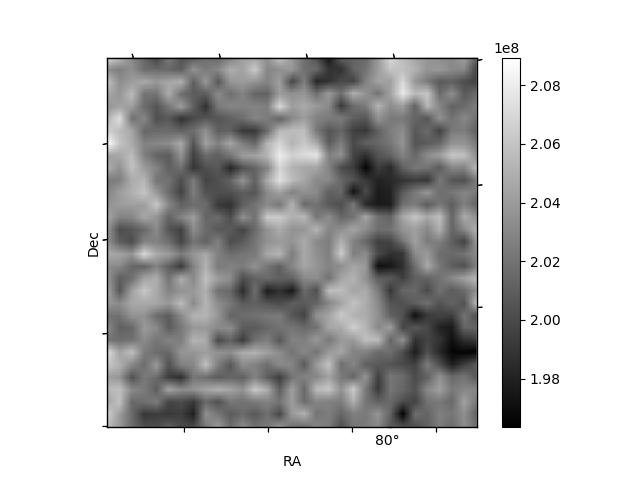
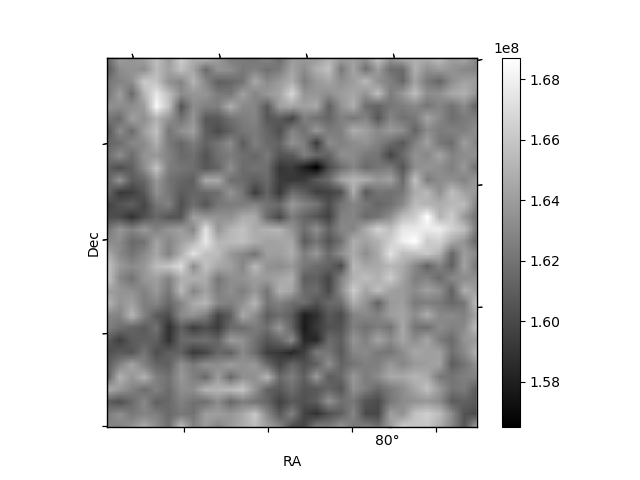
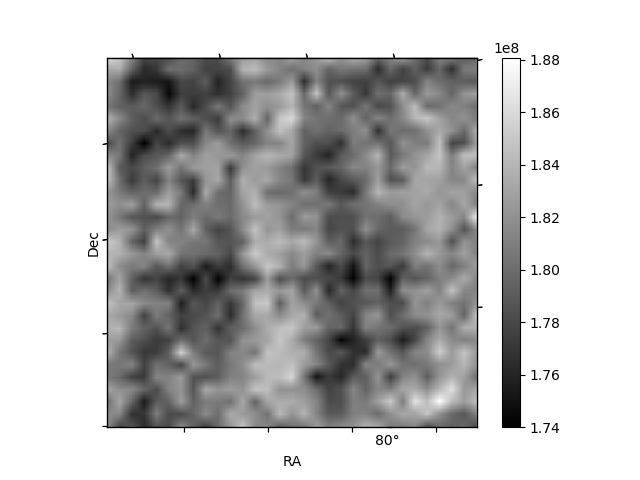
Histogram calculated using DETX and DETY for each event in the final _common_clean file
| Quadrant A |  |
 |
Quadrant B |
|---|---|---|---|
| Quadrant D | 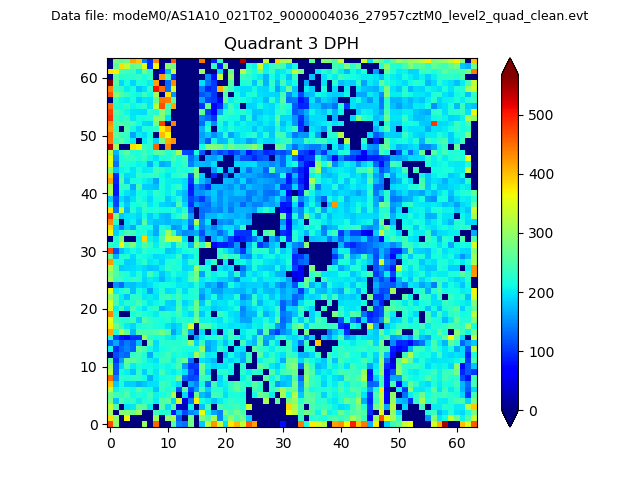 |
 |
Quadrant C |
| Plot type | Count rate plots | Images |
|---|---|---|
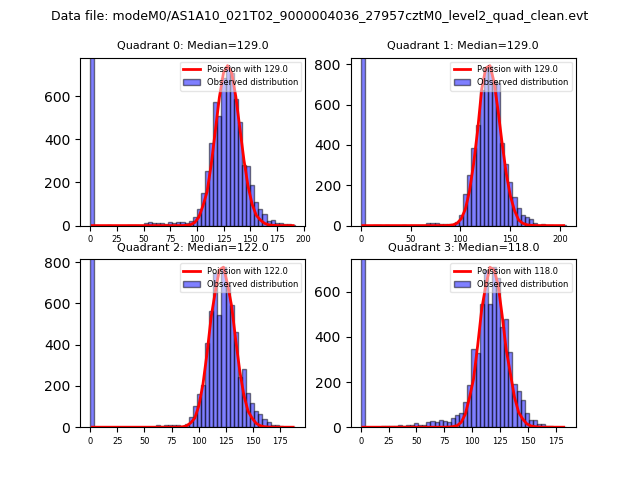
| Comparison with Poisson distribution Blue bars denote a histogram of data divided into 1 sec bins. Red curve is a Poisson curve with rate = median count rate of data. |
 |
 |
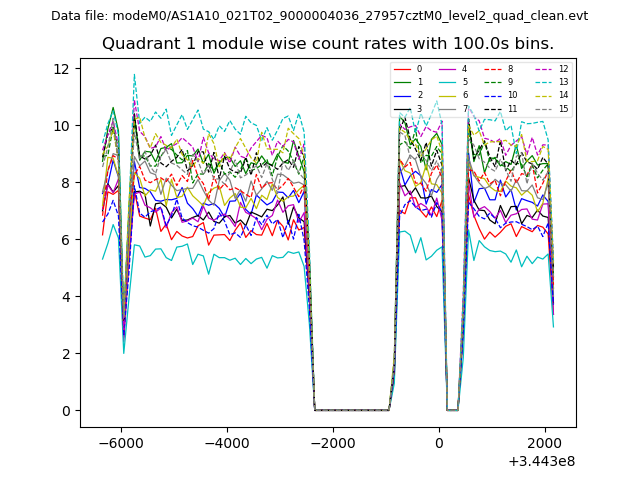
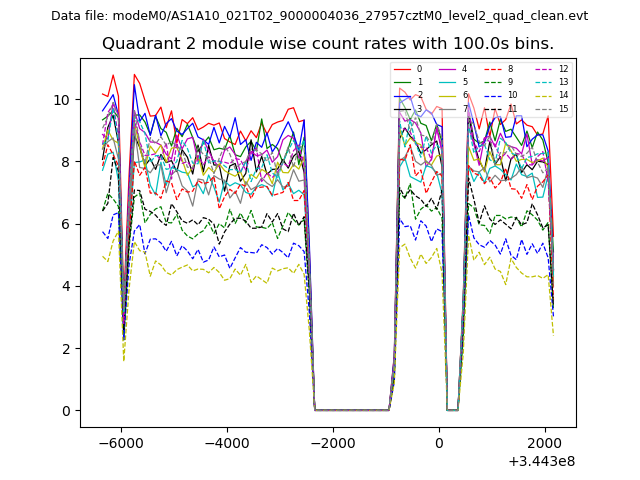
| Quadrant-wise count rates Data is divided into 100 sec bins |
 |
|
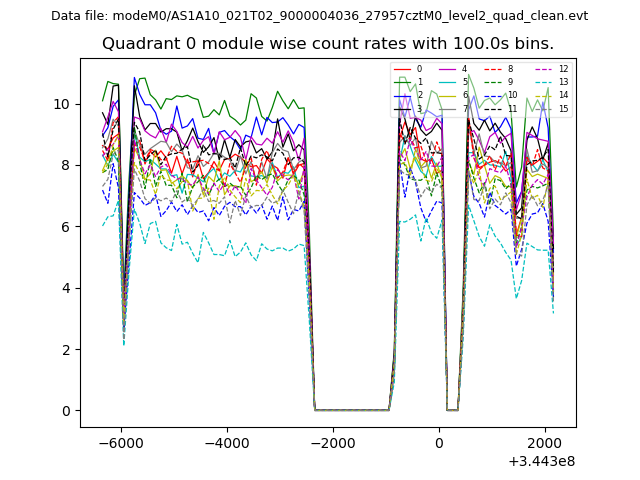
| Module-wise count rates for Quadrant A Data is divided into 100 sec bins |
 |
 |
| Module-wise count rates for Quadrant B Data is divided into 100 sec bins |
 |
 |
| Module-wise count rates for Quadrant C Data is divided into 100 sec bins |
 |
 |
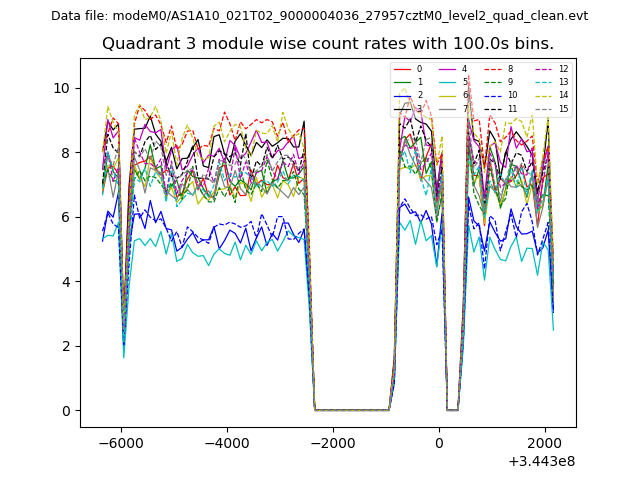
| Module-wise count rates for Quadrant D Data is divided into 100 sec bins |
 |
 |
| Parameter | Plot |
|---|---|
| CZT HV Monitor | 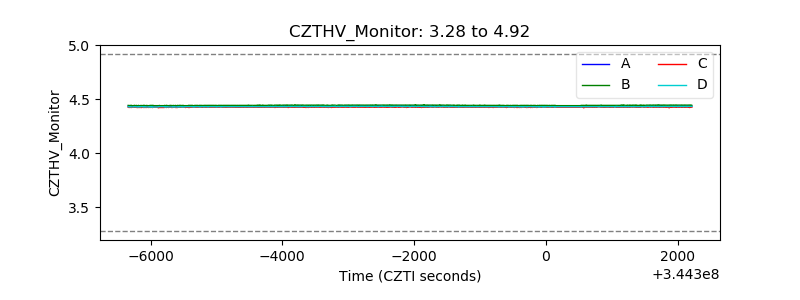 |
| D_VDD | 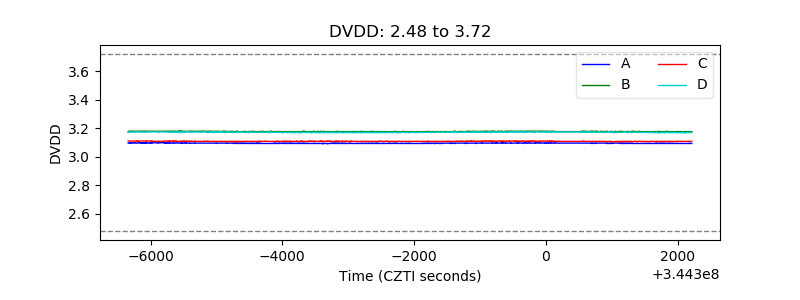 |
| Temperature 1 | 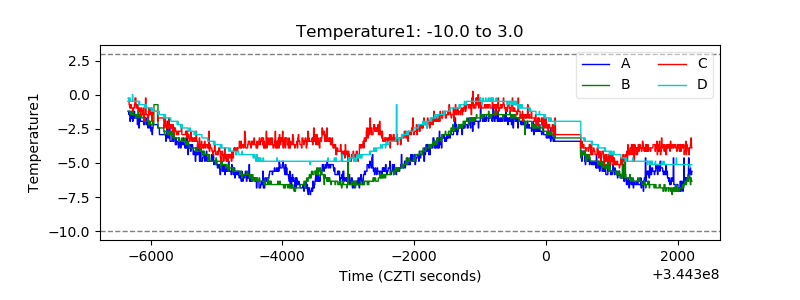 |
| Veto HV Monitor | 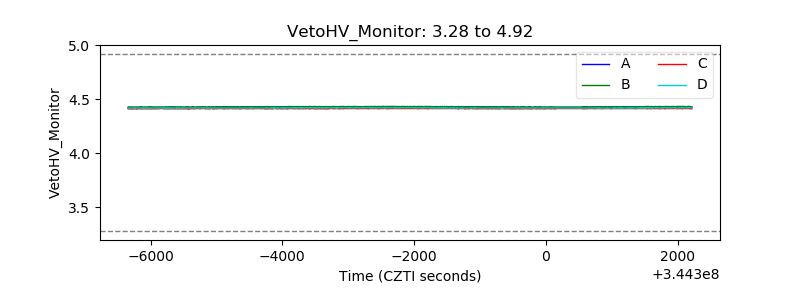 |
| Veto LLD | 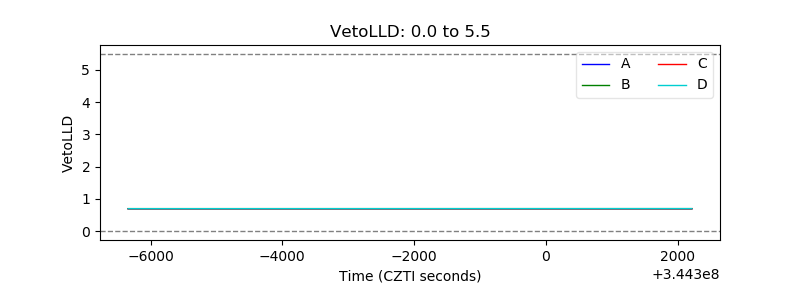 |
| Alpha Counter | 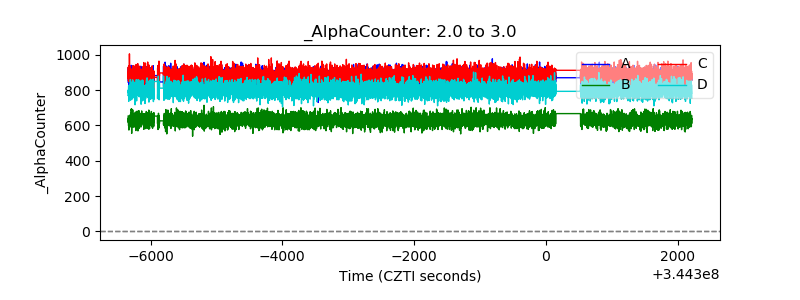 |
| _CPM_Rate | 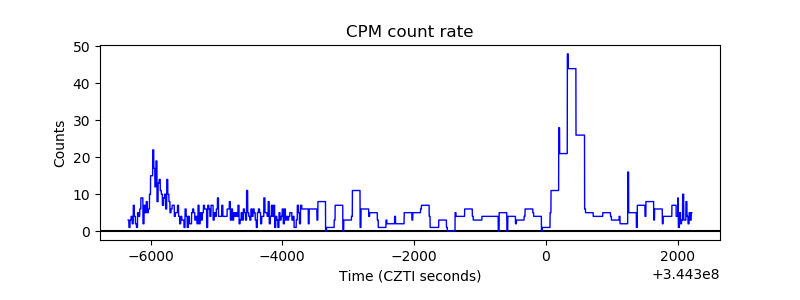 |
| CZT Counter | 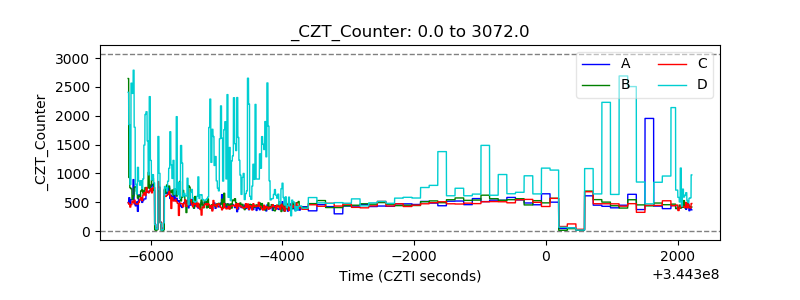 |
| +2.5 Volts monitor |  |
| +5 Volts monitor | 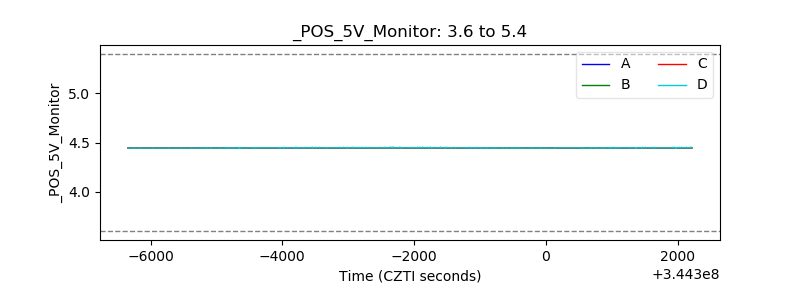 |
| _ROLL_ROT | 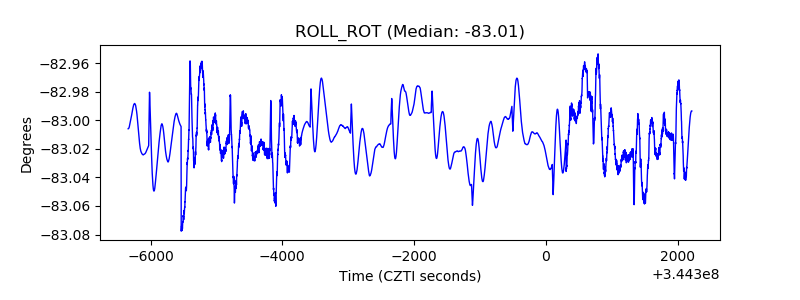 |
| _Roll_DEC | 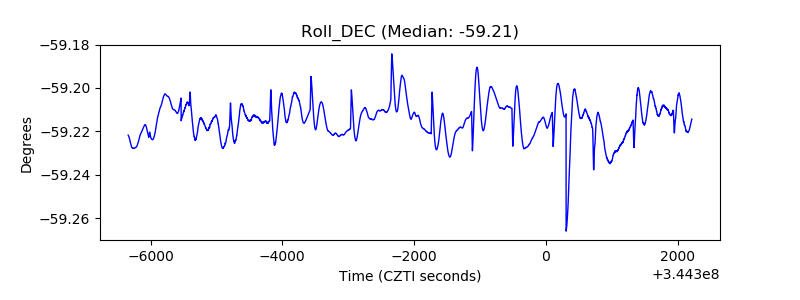 |
| _Roll_RA | 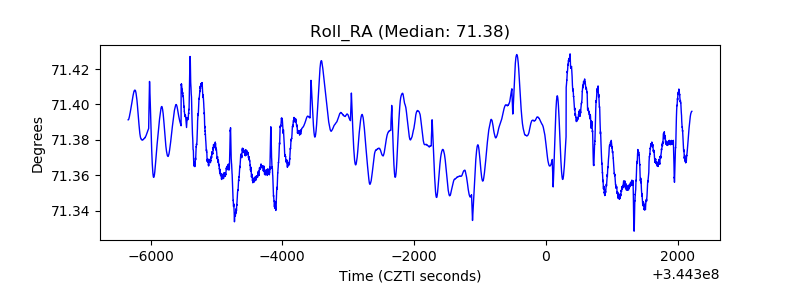 |
| Veto Counter | 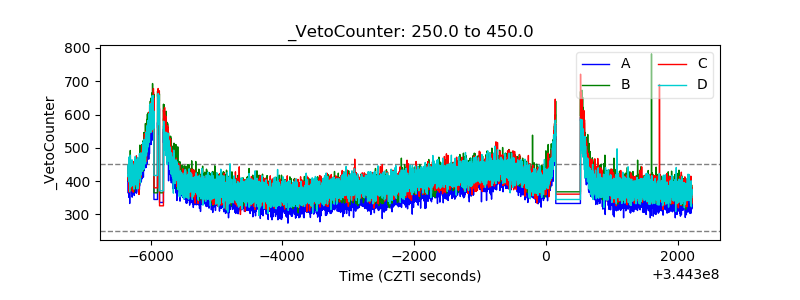 |