| Param | Original file | Final file |
|---|---|---|
| Filename | modeM0/AS1A10_021T02_9000004036_27959cztM0_level2.evt | modeM0/AS1A10_021T02_9000004036_27959cztM0_level2_quad_clean.evt |
| Size (bytes) | 1,140,439,680 | 192,801,600 |
| Size | 1.1 GB | 183.9 MB |
| Events in quadrant A | 6,332,256 | 1,277,808 |
| Events in quadrant B | 7,902,957 | 1,284,349 |
| Events in quadrant C | 6,503,241 | 1,225,683 |
| Events in quadrant D | 12,909,186 | 1,139,163 |
| Mode M0 | |||
|---|---|---|---|
| Quadrant | BADHDUFLAG | Total packets | Discarded packets |
| A | 0 | 27497 | 0 |
| B | 0 | 32152 | 0 |
| C | 0 | 27672 | 0 |
| D | 0 | 47414 | 0 |
| Mode M9 | |||
|---|---|---|---|
| Quadrant | BADHDUFLAG | Total packets | Discarded packets |
| A | 0 | 17 | 0 |
| B | 0 | 17 | 0 |
| C | 0 | 17 | 0 |
| D | 0 | 17 | 0 |
| Quadrant | Total seconds | Saturated seconds | Saturation percentage |
|---|---|---|---|
| A | 13202 | 145 | 1.098318% |
| B | 13203 | 187 | 1.416345% |
| C | 13202 | 168 | 1.272534% |
| D | 13202 | 1403 | 10.627178% |
Noise dominated data is calculated using 1-second bins in cleaned event files. If a bin has >2000 counts, and if more than 50% of those come from <1% of pixels, then it is considered to be noise-dominated and hence unusable.
| Quadrant | # 1 sec bins | Bins with >0 counts | Bins with >2000 counts | High rate bins dominated by noise | Noise dominated (total time) | Noise dominated (detector-on time) | Marked lightcurve |
|---|---|---|---|---|---|---|---|
| A | 14912 | 13205 | 110 | 110 | 0.74% | 0.83% | 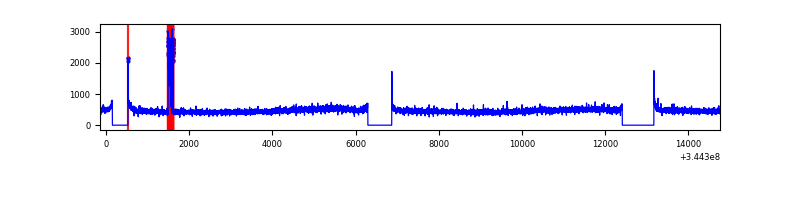 |
| B | 14913 | 13205 | 21 | 21 | 0.14% | 0.16% | 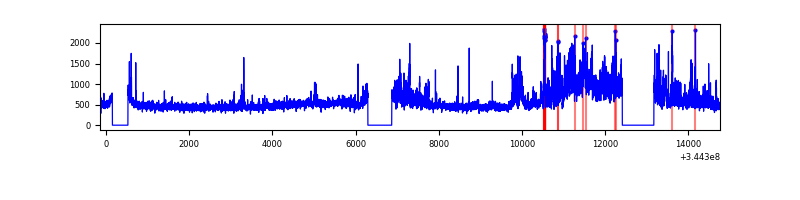 |
| C | 14912 | 13205 | 28 | 28 | 0.19% | 0.21% | 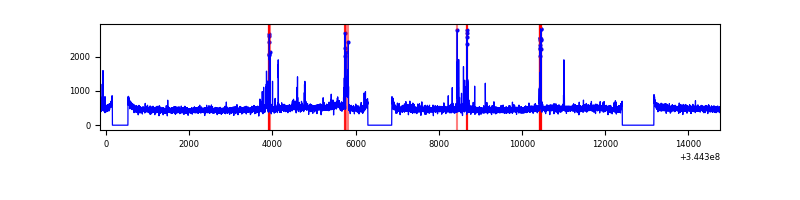 |
| D | 14912 | 13202 | 1317 | 1317 | 8.83% | 9.98% | 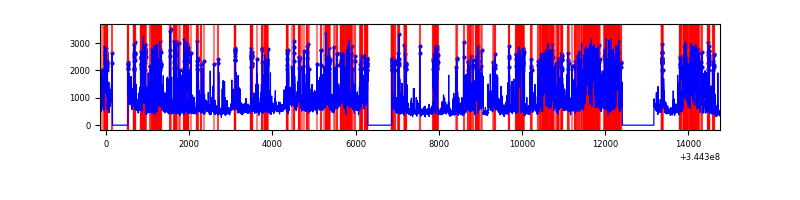 |
Top three noisy pixels from each quadrant. If the there are fewer than three noisy pixels in the level2.evt file, extra rows are filled as -1
| Pixel properties | Quadrant properties | ||||||
|---|---|---|---|---|---|---|---|
| Quadrant | DetID | PixID | Counts | Sigma | Mean | Median | Sigma |
| A | 6 | 16 | 258097 | 811.3 | 1570 | 1537 | 316.2 |
| A | 13 | 254 | 21881 | 64.33 | 1570 | 1537 | 316.2 |
| A | 8 | 192 | 19277 | 56.1 | 1570 | 1537 | 316.2 |
| B | 10 | 245 | 1661474 | 5598.98 | 1565 | 1522 | 296.5 |
| B | 12 | 111 | 37022 | 119.74 | 1565 | 1522 | 296.5 |
| B | 11 | 111 | 33275 | 107.1 | 1565 | 1522 | 296.5 |
| C | 14 | 238 | 243260 | 679.99 | 1519 | 1527 | 355.5 |
| C | 2 | 16 | 175498 | 489.38 | 1519 | 1527 | 355.5 |
| C | 15 | 208 | 82408 | 227.52 | 1519 | 1527 | 355.5 |
| D | 1 | 52 | 3484826 | 9922.05 | 1469 | 1428 | 351.1 |
| D | 7 | 80 | 2203884 | 6273.44 | 1469 | 1428 | 351.1 |
| D | 8 | 195 | 591683 | 1681.27 | 1469 | 1428 | 351.1 |
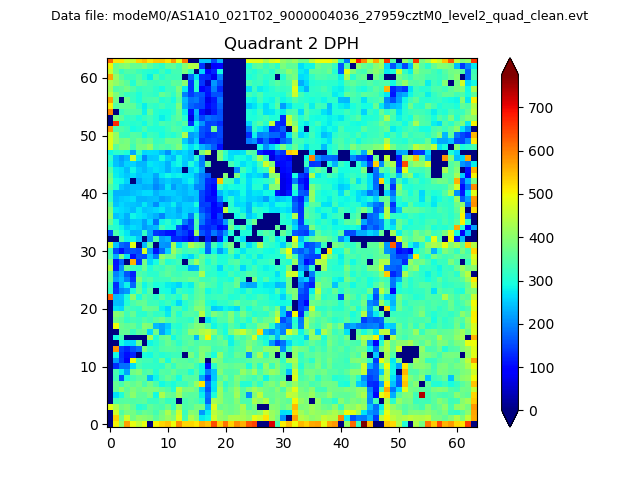
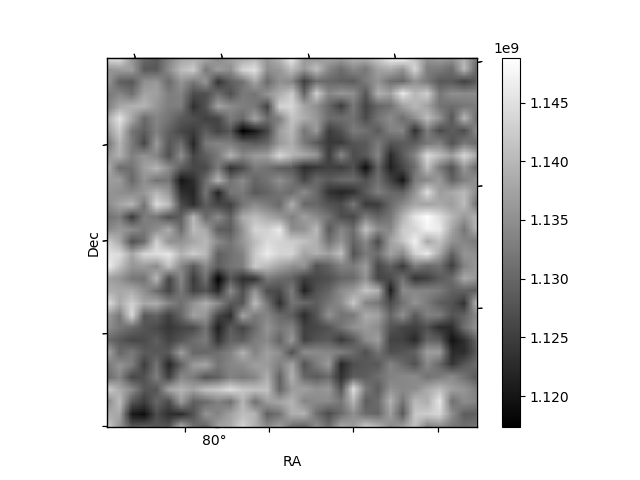
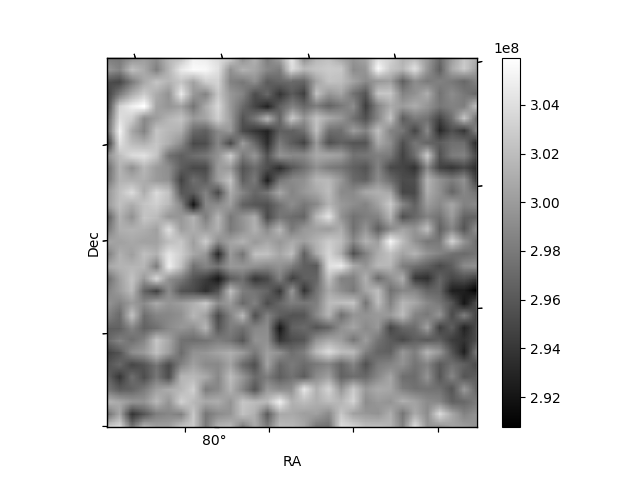
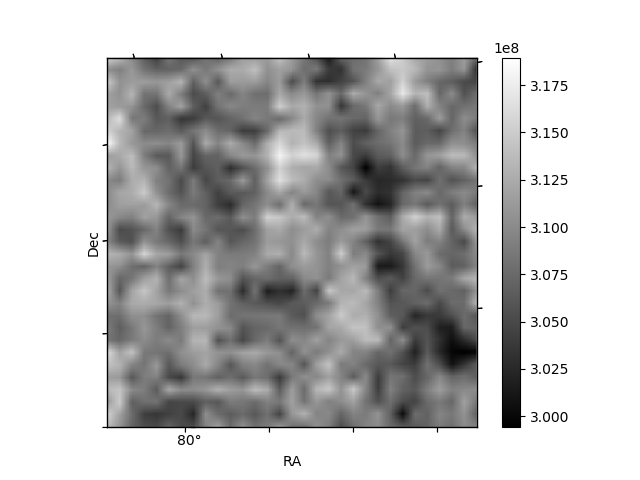
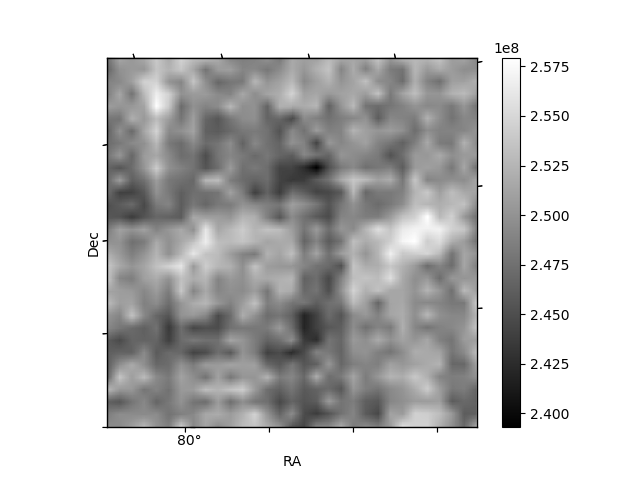
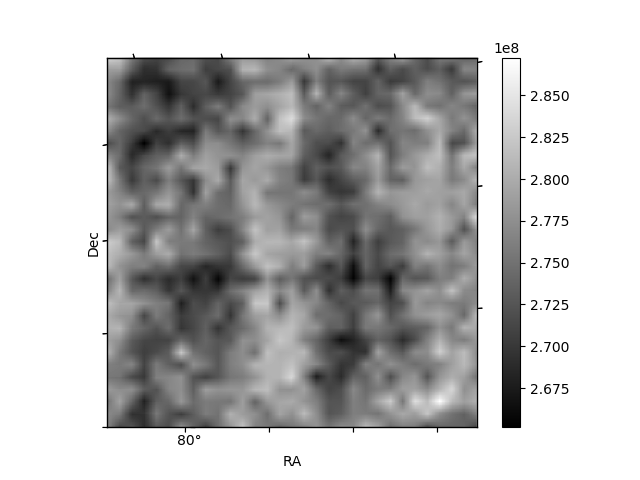
Histogram calculated using DETX and DETY for each event in the final _common_clean file
| Quadrant A | 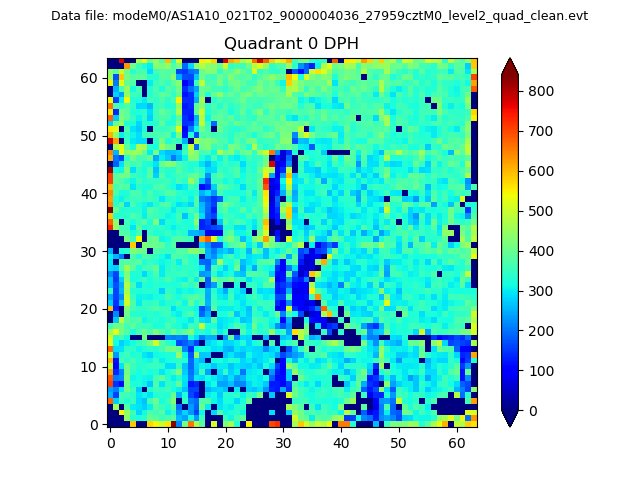 |
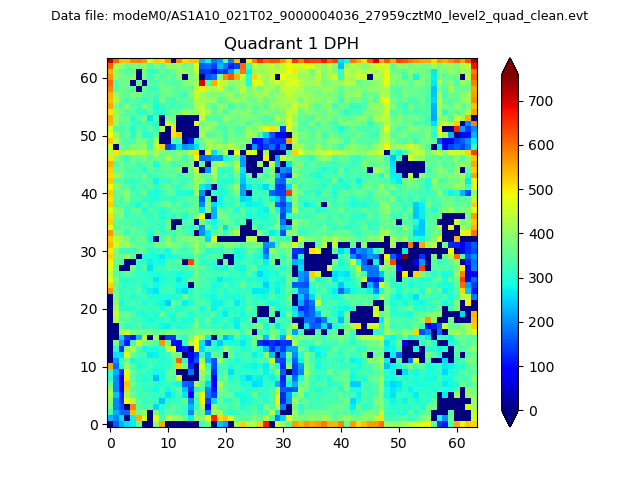 |
Quadrant B |
|---|---|---|---|
| Quadrant D | 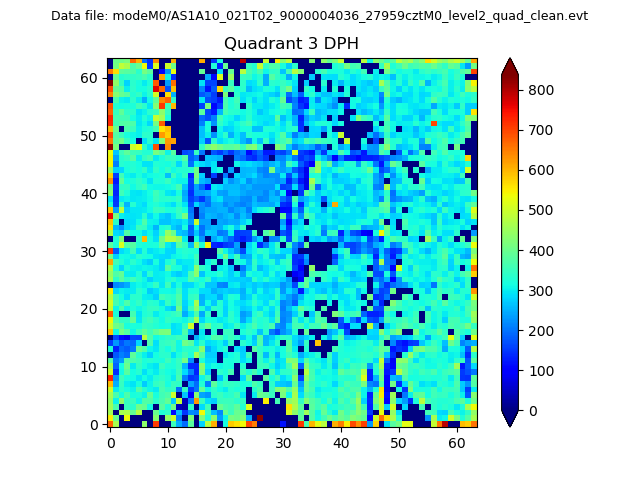 |
 |
Quadrant C |
| Plot type | Count rate plots | Images |
|---|---|---|
| Comparison with Poisson distribution Blue bars denote a histogram of data divided into 1 sec bins. Red curve is a Poisson curve with rate = median count rate of data. |
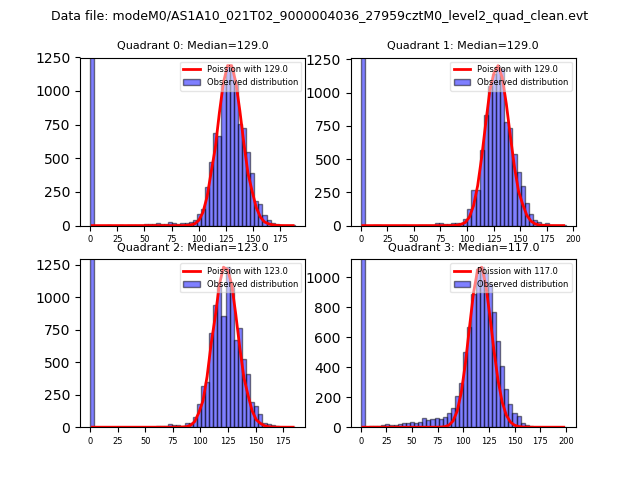 |
 |
| Quadrant-wise count rates Data is divided into 100 sec bins |
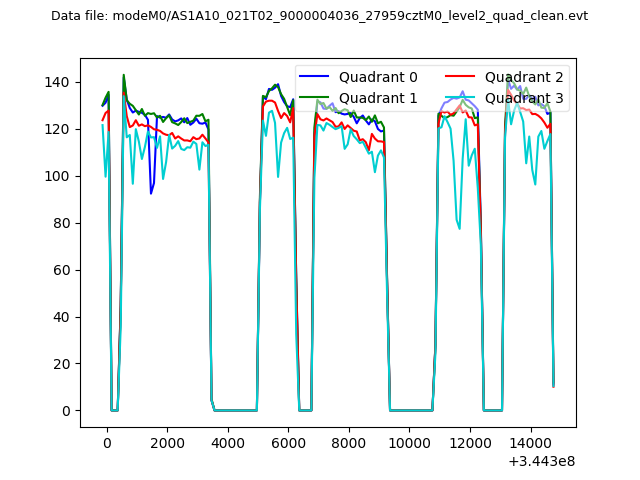 |
|
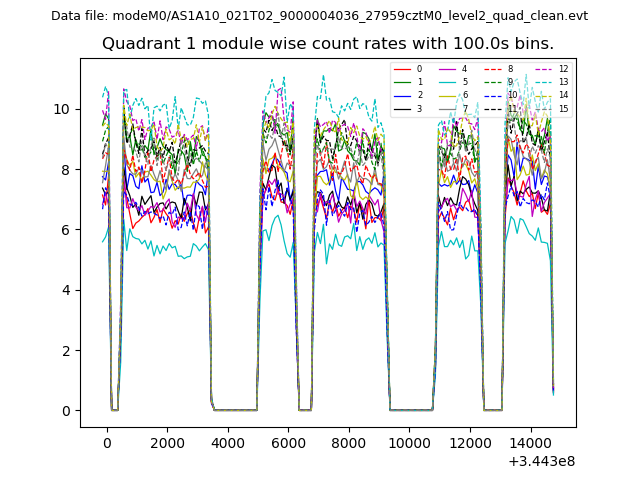
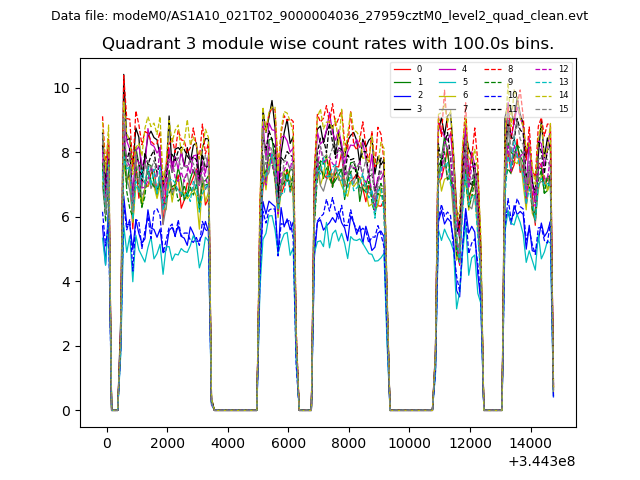
| Module-wise count rates for Quadrant A Data is divided into 100 sec bins |
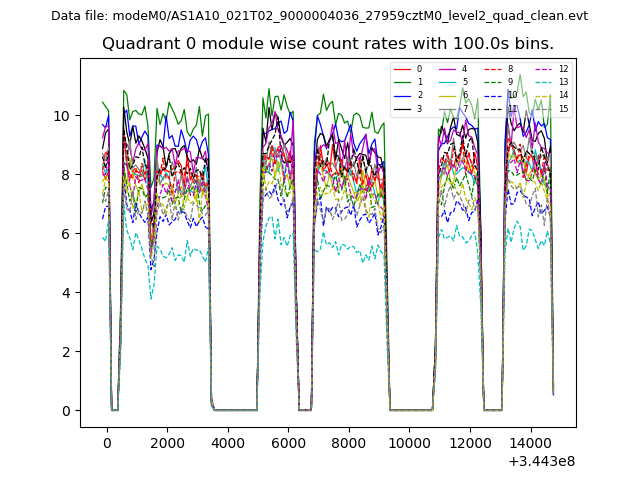 |
 |
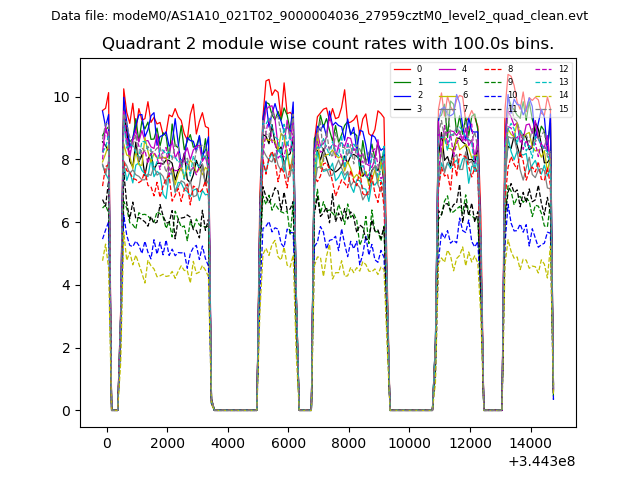
| Module-wise count rates for Quadrant B Data is divided into 100 sec bins |
 |
 |
| Module-wise count rates for Quadrant C Data is divided into 100 sec bins |
 |
 |
| Module-wise count rates for Quadrant D Data is divided into 100 sec bins |
 |
 |
| Parameter | Plot |
|---|---|
| CZT HV Monitor | 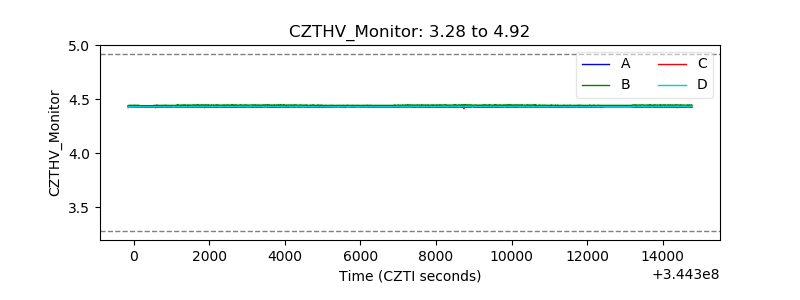 |
| D_VDD | 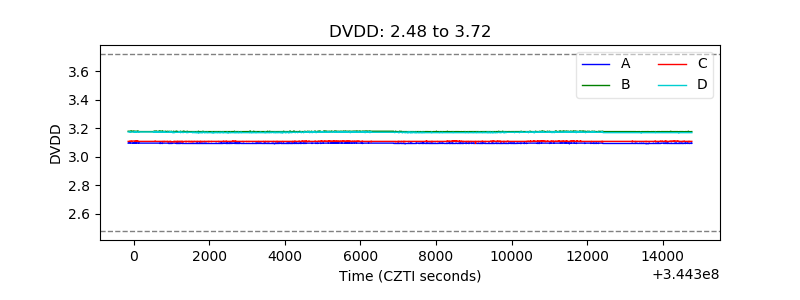 |
| Temperature 1 | 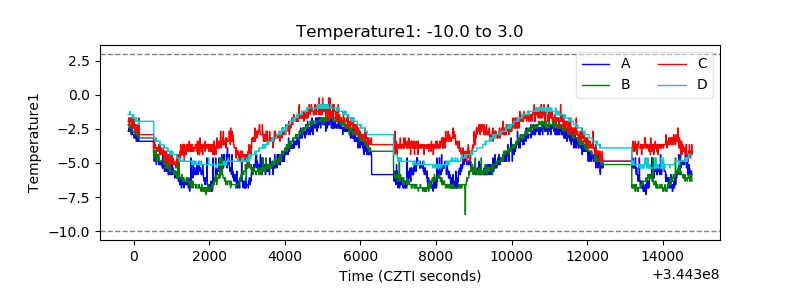 |
| Veto HV Monitor | 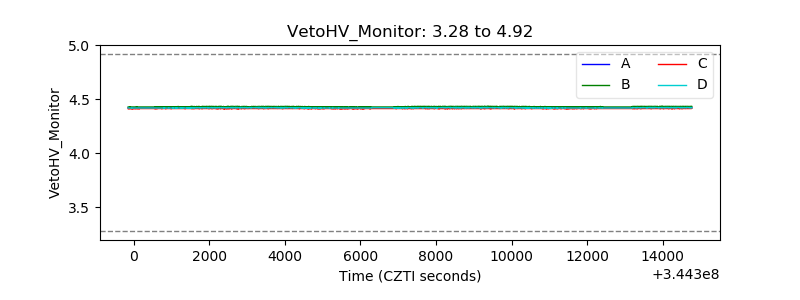 |
| Veto LLD | 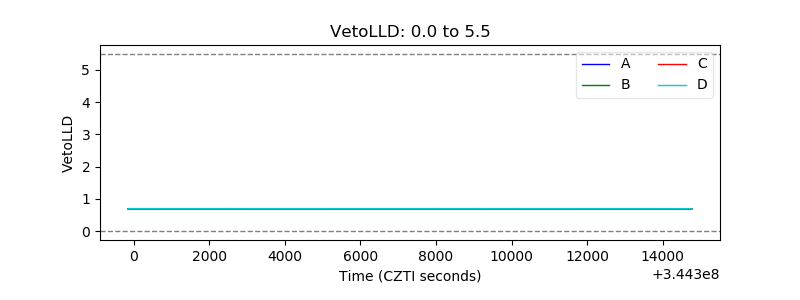 |
| Alpha Counter | 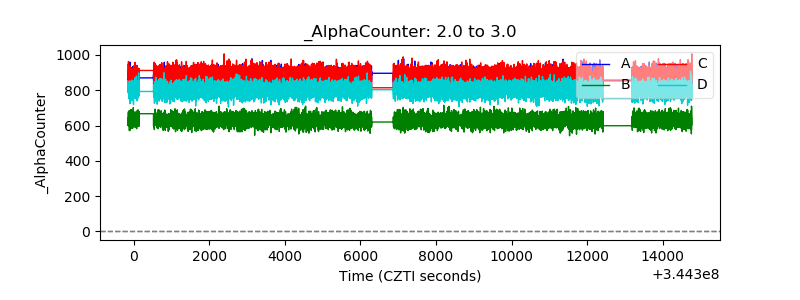 |
| _CPM_Rate | 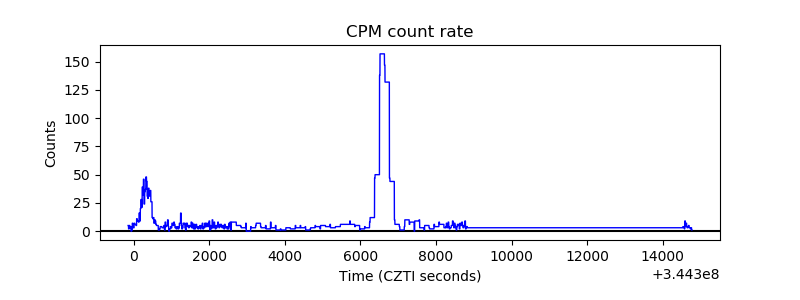 |
| CZT Counter | 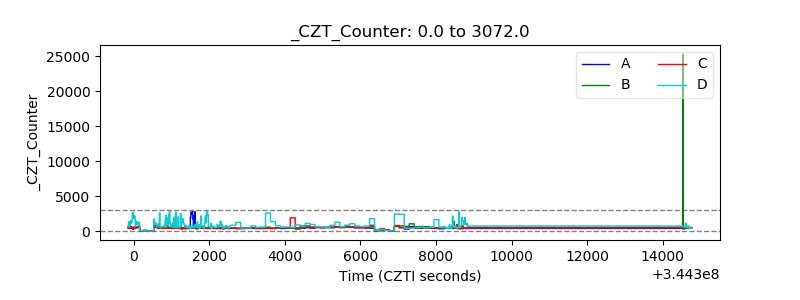 |
| +2.5 Volts monitor |  |
| +5 Volts monitor |  |
| _ROLL_ROT | 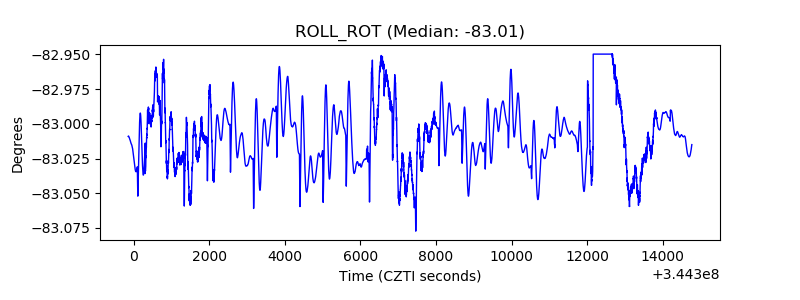 |
| _Roll_DEC | 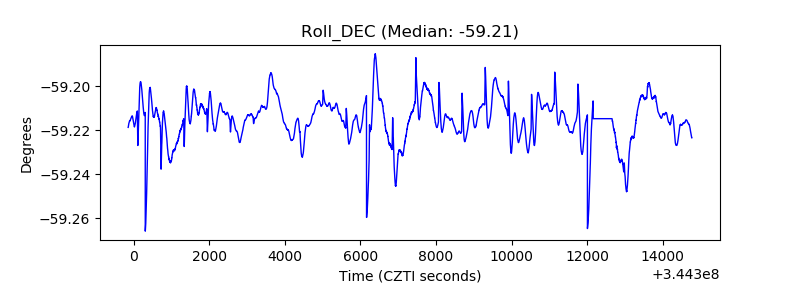 |
| _Roll_RA | 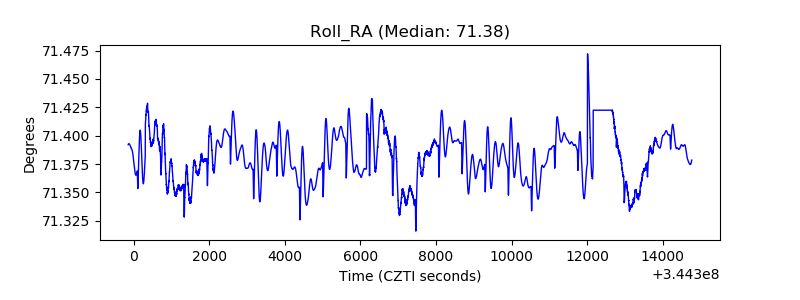 |
| Veto Counter | 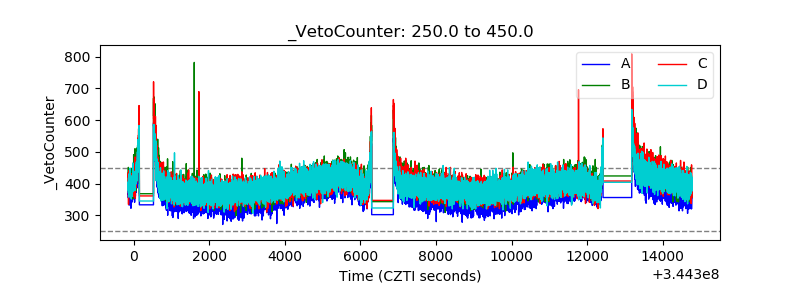 |