| Param | Original file | Final file |
|---|---|---|
| Filename | modeM0/AS1A10_021T02_9000004036_27960cztM0_level2.evt | modeM0/AS1A10_021T02_9000004036_27960cztM0_level2_quad_clean.evt |
| Size (bytes) | 432,843,840 | 71,147,520 |
| Size | 412.8 MB | 67.9 MB |
| Events in quadrant A | 2,377,447 | 466,890 |
| Events in quadrant B | 2,999,097 | 467,270 |
| Events in quadrant C | 2,426,829 | 448,120 |
| Events in quadrant D | 4,953,245 | 408,637 |
| Mode M0 | |||
|---|---|---|---|
| Quadrant | BADHDUFLAG | Total packets | Discarded packets |
| A | 0 | 10453 | 0 |
| B | 0 | 12235 | 0 |
| C | 0 | 10470 | 0 |
| D | 0 | 18162 | 0 |
| Mode M9 | |||
|---|---|---|---|
| Quadrant | BADHDUFLAG | Total packets | Discarded packets |
| A | 0 | 3 | 0 |
| B | 0 | 4 | 0 |
| C | 0 | 4 | 0 |
| D | 0 | 4 | 0 |
| Quadrant | Total seconds | Saturated seconds | Saturation percentage |
|---|---|---|---|
| A | 5189 | 11 | 0.211987% |
| B | 5189 | 42 | 0.809405% |
| C | 5189 | 39 | 0.751590% |
| D | 5189 | 598 | 11.524378% |
Noise dominated data is calculated using 1-second bins in cleaned event files. If a bin has >2000 counts, and if more than 50% of those come from <1% of pixels, then it is considered to be noise-dominated and hence unusable.
| Quadrant | # 1 sec bins | Bins with >0 counts | Bins with >2000 counts | High rate bins dominated by noise | Noise dominated (total time) | Noise dominated (detector-on time) | Marked lightcurve |
|---|---|---|---|---|---|---|---|
| A | 5189 | 5189 | 0 | 0 | 0.00% | 0.00% | 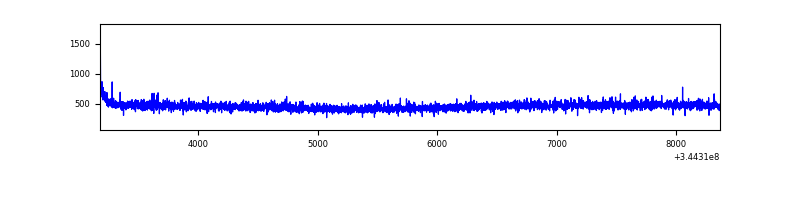 |
| B | 5189 | 5189 | 9 | 9 | 0.17% | 0.17% | 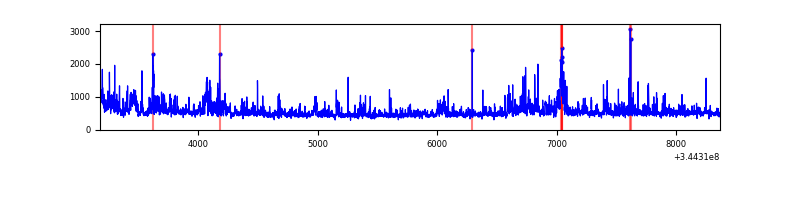 |
| C | 5189 | 5189 | 0 | 0 | 0.00% | 0.00% | 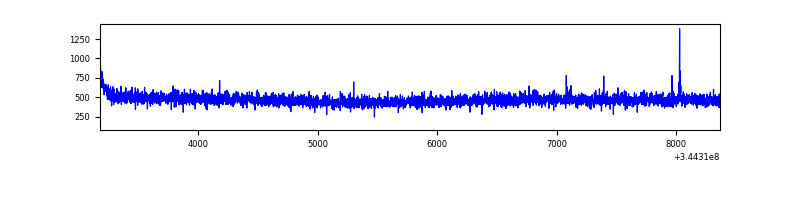 |
| D | 5189 | 5189 | 567 | 567 | 10.93% | 10.93% | 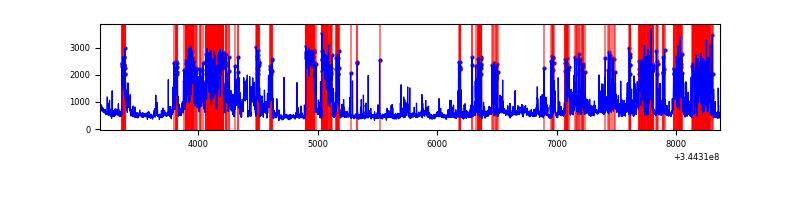 |
Top three noisy pixels from each quadrant. If the there are fewer than three noisy pixels in the level2.evt file, extra rows are filled as -1
| Pixel properties | Quadrant properties | ||||||
|---|---|---|---|---|---|---|---|
| Quadrant | DetID | PixID | Counts | Sigma | Mean | Median | Sigma |
| A | 13 | 254 | 8777 | 65.69 | 615 | 601 | 124.5 |
| A | 3 | 137 | 5895 | 42.53 | 615 | 601 | 124.5 |
| A | 0 | 226 | 5123 | 36.33 | 615 | 601 | 124.5 |
| B | 10 | 245 | 553044 | 4711.53 | 611 | 596 | 117.3 |
| B | 0 | 190 | 19126 | 158.03 | 611 | 596 | 117.3 |
| B | 12 | 111 | 14452 | 118.17 | 611 | 596 | 117.3 |
| C | 14 | 238 | 95893 | 683.91 | 594 | 598 | 139.3 |
| C | 3 | 233 | 8585 | 57.32 | 594 | 598 | 139.3 |
| C | 10 | 22 | 5446 | 34.79 | 594 | 598 | 139.3 |
| D | 7 | 80 | 1319095 | 9599.29 | 574 | 558 | 137.4 |
| D | 1 | 52 | 1244265 | 9054.51 | 574 | 558 | 137.4 |
| D | 12 | 233 | 84727 | 612.77 | 574 | 558 | 137.4 |
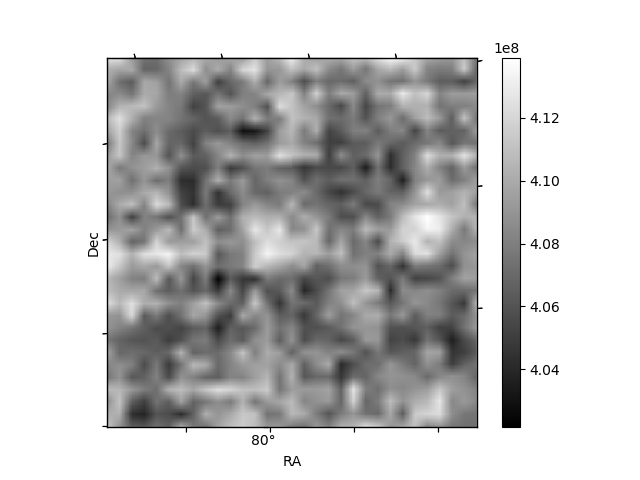
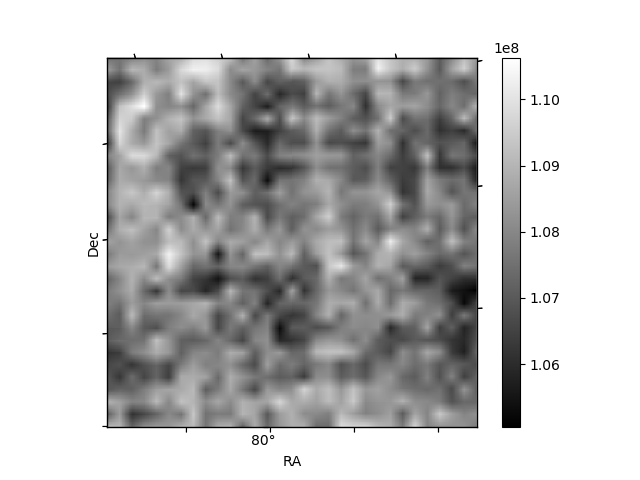
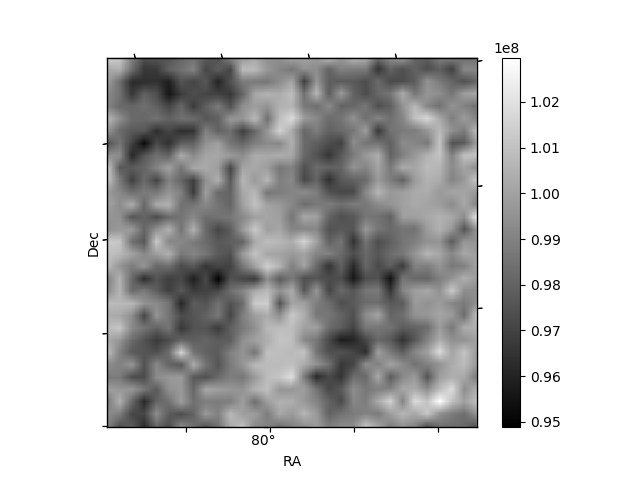
Histogram calculated using DETX and DETY for each event in the final _common_clean file
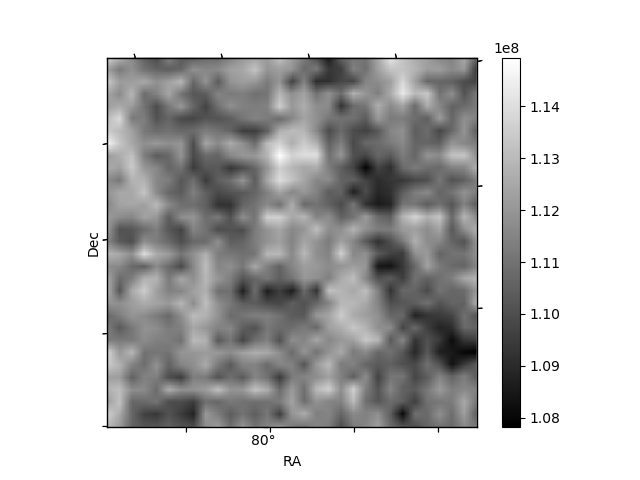
| Quadrant A | 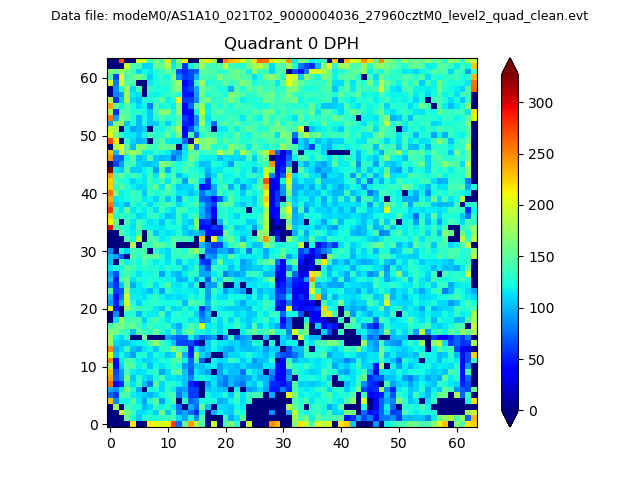 |
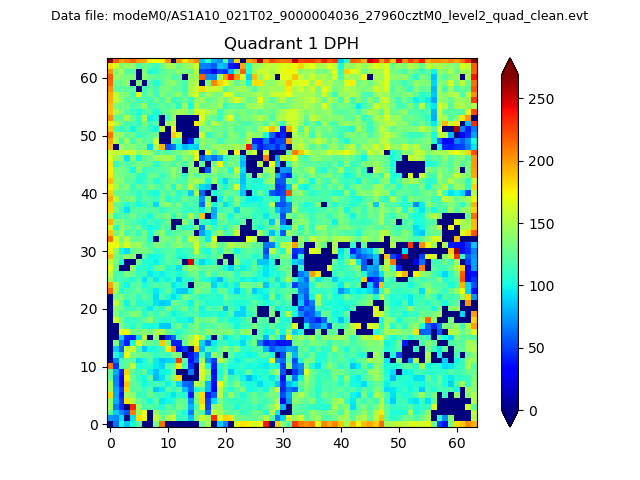 |
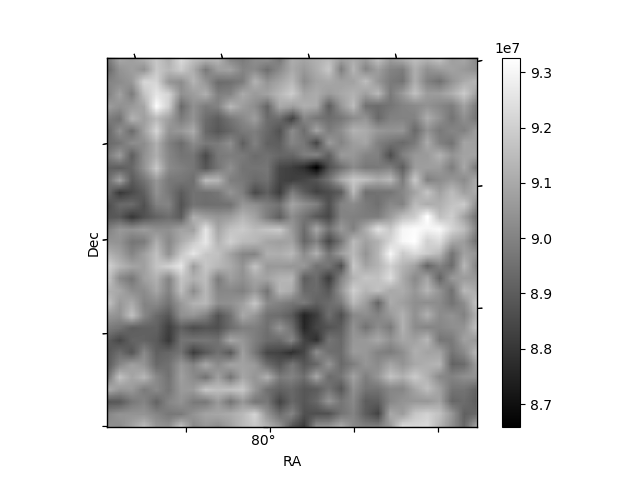
Quadrant B |
|---|---|---|---|
| Quadrant D | 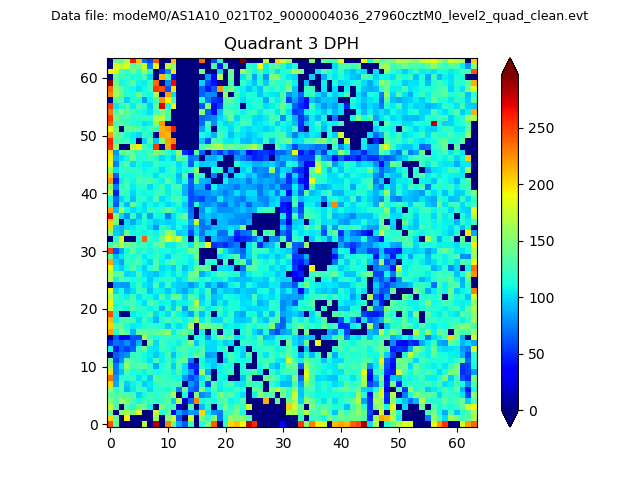 |
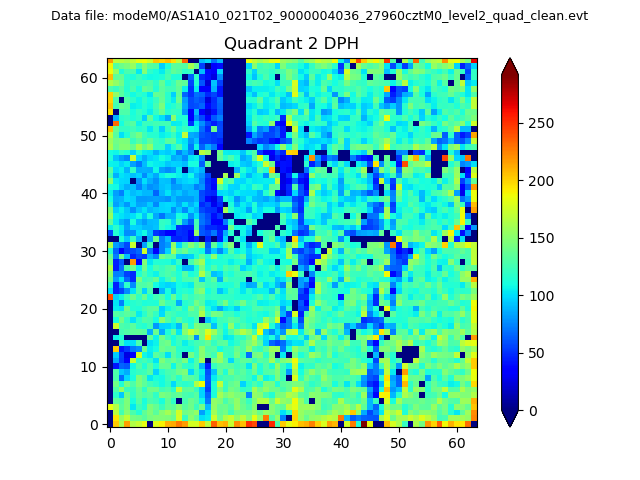 |
Quadrant C |
| Plot type | Count rate plots | Images |
|---|---|---|
| Comparison with Poisson distribution Blue bars denote a histogram of data divided into 1 sec bins. Red curve is a Poisson curve with rate = median count rate of data. |
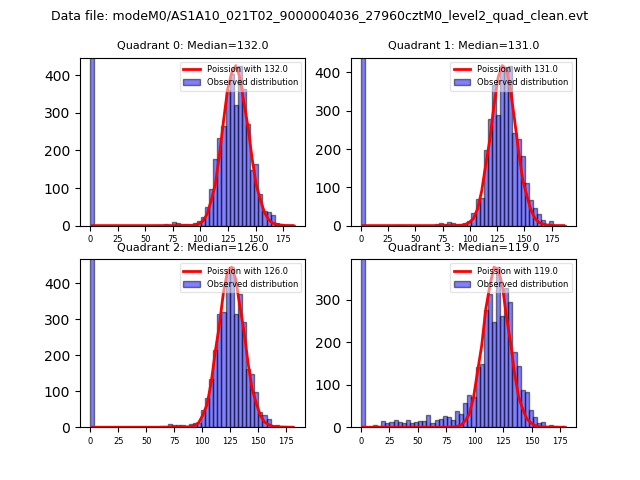 |
 |
| Quadrant-wise count rates Data is divided into 100 sec bins |
 |
|
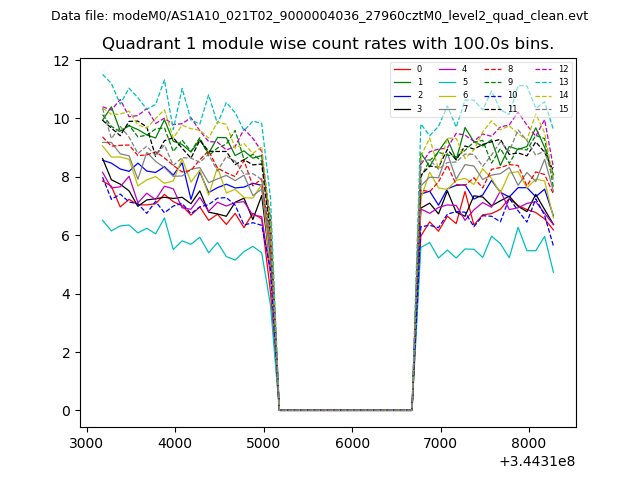
| Module-wise count rates for Quadrant A Data is divided into 100 sec bins |
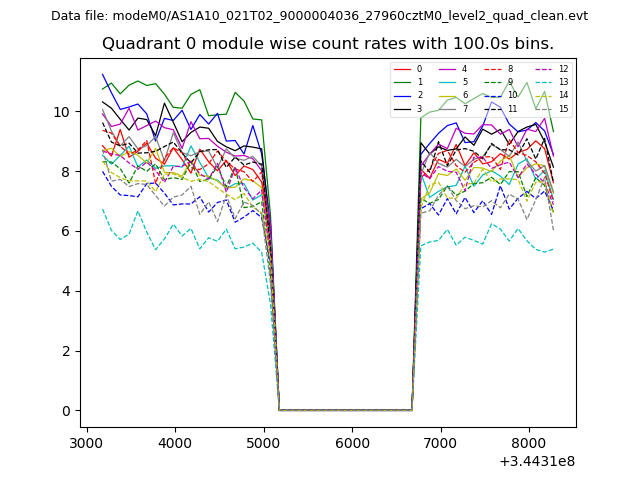 |
 |
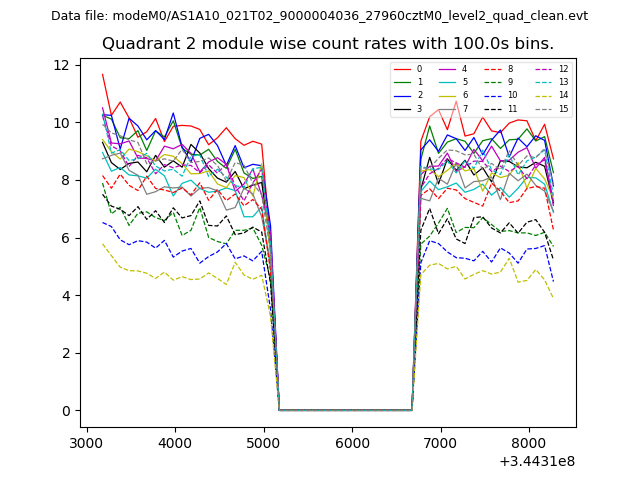
| Module-wise count rates for Quadrant B Data is divided into 100 sec bins |
 |
 |
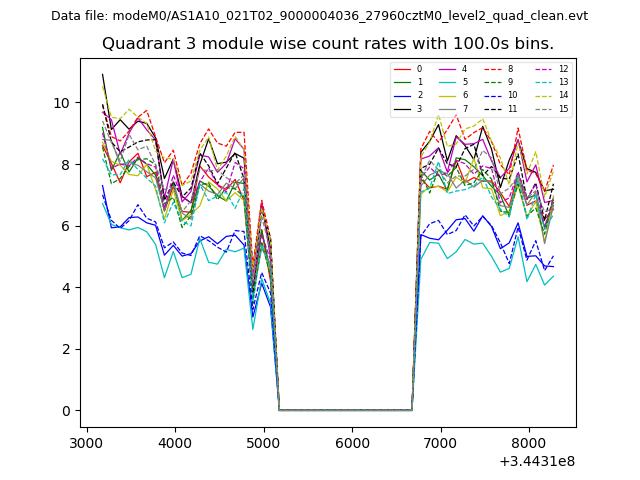
| Module-wise count rates for Quadrant C Data is divided into 100 sec bins |
 |
 |
| Module-wise count rates for Quadrant D Data is divided into 100 sec bins |
 |
 |
| Parameter | Plot |
|---|---|
| CZT HV Monitor | 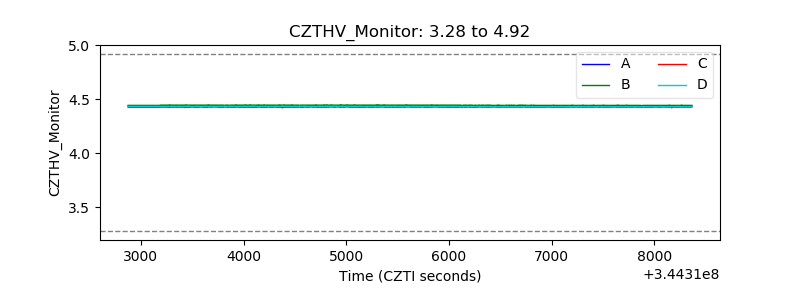 |
| D_VDD | 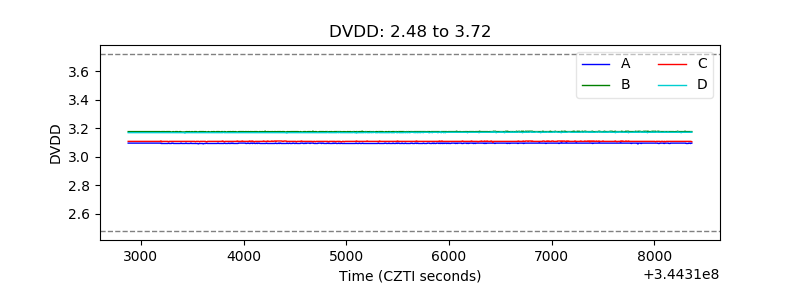 |
| Temperature 1 | 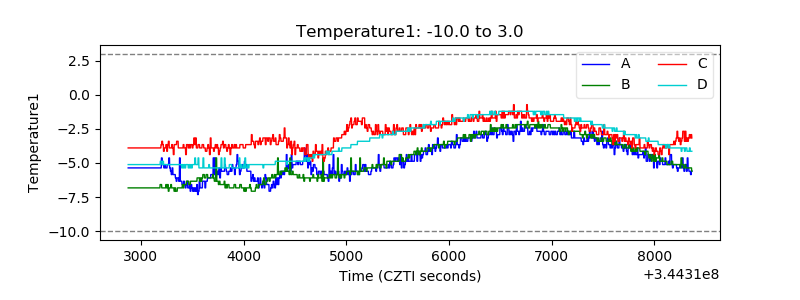 |
| Veto HV Monitor | 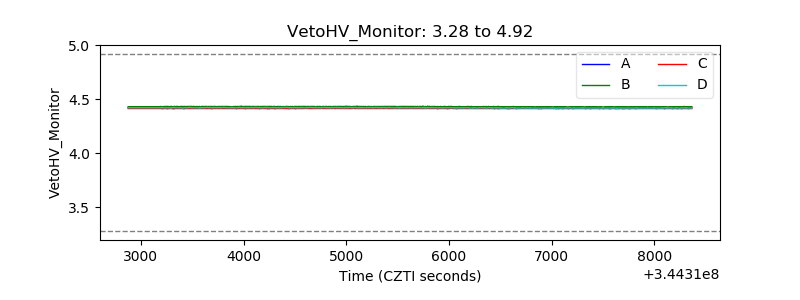 |
| Veto LLD | 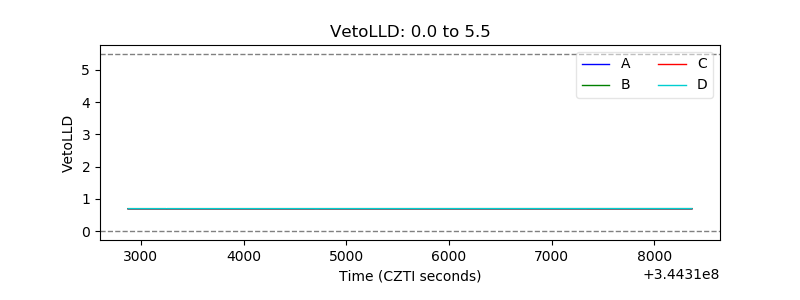 |
| Alpha Counter |  |
| _CPM_Rate | 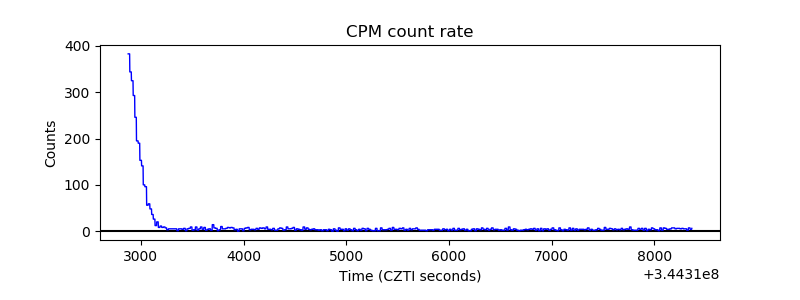 |
| CZT Counter | 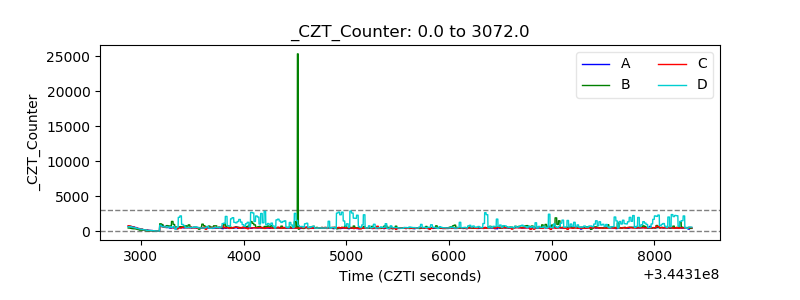 |
| +2.5 Volts monitor |  |
| +5 Volts monitor |  |
| _ROLL_ROT | 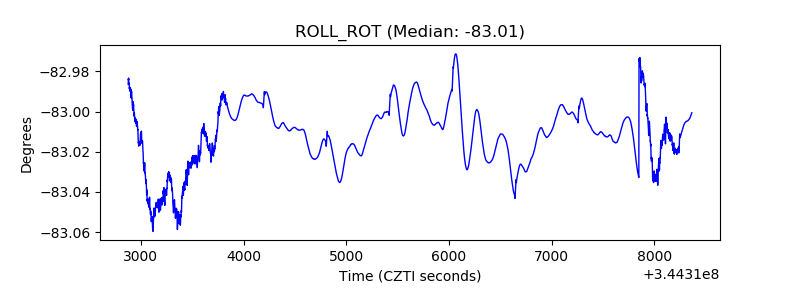 |
| _Roll_DEC | 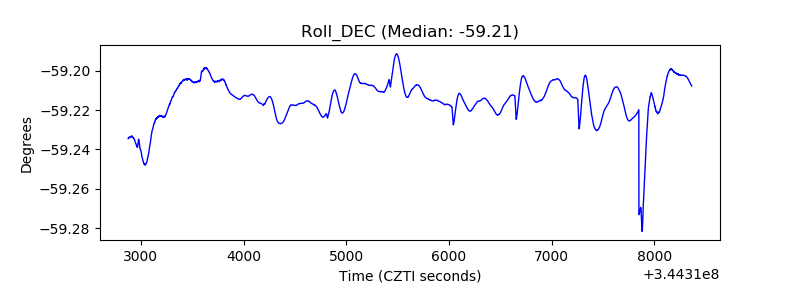 |
| _Roll_RA | 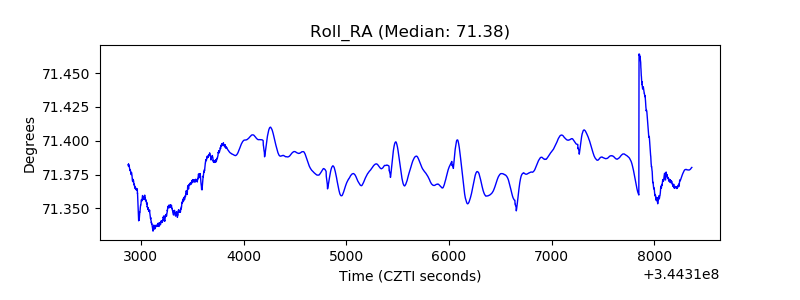 |
| Veto Counter | 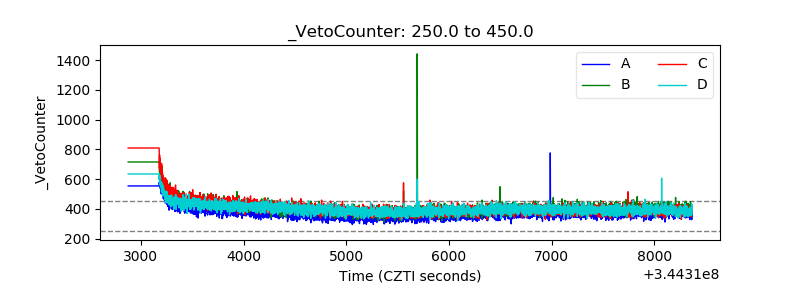 |