| Param | Original file | Final file |
|---|---|---|
| Filename | modeM0/AS1A10_021T03_9000004038cztM0_level2.fits | modeM0/AS1A10_021T03_9000004038cztM0_level2_quad_clean.evt |
| Size (bytes) | 364,288,320 | 147,018,240 |
| Size | 347.4 MB | 140.2 MB |
| Events in quadrant A | 2,350,226 | 584,112 |
| Events in quadrant B | 2,221,828 | 575,664 |
| Events in quadrant C | 2,294,112 | 553,159 |
| Events in quadrant D | 1,892,388 | 462,928 |
| Mode M0 | |||
|---|---|---|---|
| Quadrant | BADHDUFLAG | Total packets | Discarded packets |
| A | 0 | 70960 | 0 |
| B | 0 | 78340 | 0 |
| C | 0 | 73724 | 0 |
| D | 0 | 125195 | 0 |
| Mode M9 | |||
|---|---|---|---|
| Quadrant | BADHDUFLAG | Total packets | Discarded packets |
| A | 0 | 74 | 0 |
| B | 0 | 74 | 0 |
| C | 0 | 74 | 0 |
| D | 0 | 74 | 0 |
| Mode SS | |||
|---|---|---|---|
| Quadrant | BADHDUFLAG | Total packets | Discarded packets |
| A | 0 | 674 | 0 |
| B | 0 | 674 | 0 |
| C | 0 | 674 | 0 |
| D | 0 | 674 | 0 |
| Quadrant | Total seconds | Saturated seconds | Saturation percentage |
|---|---|---|---|
| A | 33081 | 461 | 1.393549% |
| B | 33081 | 571 | 1.726066% |
| C | 33081 | 674 | 2.037423% |
| D | 33081 | 4169 | 12.602400% |
Noise dominated data is calculated using 1-second bins in cleaned event files. If a bin has >2000 counts, and if more than 50% of those come from <1% of pixels, then it is considered to be noise-dominated and hence unusable.
| Quadrant | # 1 sec bins | Bins with >0 counts | Bins with >2000 counts | High rate bins dominated by noise | Noise dominated (total time) | Noise dominated (detector-on time) | Marked lightcurve |
|---|---|---|---|---|---|---|---|
| A | 40360 | 33074 | 0 | 0 | 0.00% | 0.00% |  |
| B | 40360 | 33074 | 0 | 0 | 0.00% | 0.00% |  |
| C | 40360 | 33073 | 0 | 0 | 0.00% | 0.00% |  |
| D | 40360 | 33012 | 0 | 0 | 0.00% | 0.00% |  |
Top three noisy pixels from each quadrant. If the there are fewer than three noisy pixels in the level2.evt file, extra rows are filled as -1
| Pixel properties | Quadrant properties | ||||||
|---|---|---|---|---|---|---|---|
| Quadrant | DetID | PixID | Counts | Sigma | Mean | Median | Sigma |
| A | 0 | 29 | 2222 | 11.04 | 613 | 580 | 148.8 |
| A | 0 | 30 | 1812 | 8.28 | 613 | 580 | 148.8 |
| A | 7 | 110 | 1809 | 8.26 | 613 | 580 | 148.8 |
| B | 2 | 9 | 1701 | 9.79 | 587 | 565 | 116.0 |
| B | 5 | 128 | 1489 | 7.96 | 587 | 565 | 116.0 |
| B | 3 | 80 | 1476 | 7.85 | 587 | 565 | 116.0 |
| C | 1 | 81 | 1721 | 7.53 | 606 | 573 | 152.5 |
| C | 1 | 80 | 1673 | 7.21 | 606 | 573 | 152.5 |
| C | 12 | 241 | 1554 | 6.43 | 606 | 573 | 152.5 |
| D | 15 | 47 | 1326 | 5.93 | 540 | 499 | 139.5 |
| D | 7 | 3 | 1302 | 5.76 | 540 | 499 | 139.5 |
| D | 11 | 66 | 1282 | 5.61 | 540 | 499 | 139.5 |
Histogram calculated using DETX and DETY for each event in the final _common_clean file
| Quadrant A |  |
 |
Quadrant B |
|---|---|---|---|
| Quadrant D |  |
 |
Quadrant C |
| Plot type | Count rate plots | Images |
|---|---|---|
| Comparison with Poisson distribution Blue bars denote a histogram of data divided into 1 sec bins. Red curve is a Poisson curve with rate = median count rate of data. |
 |
 |
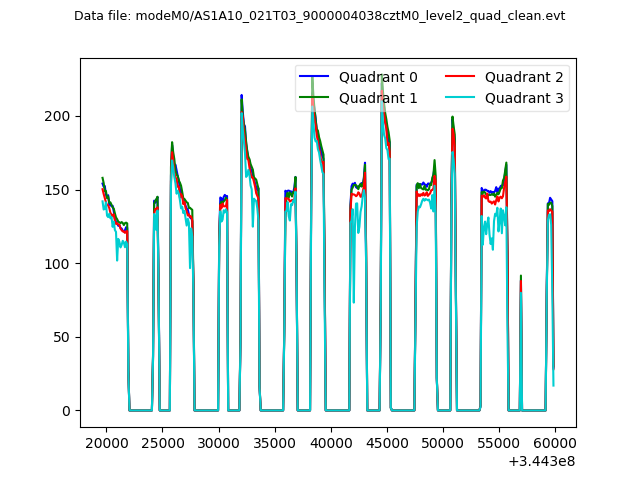
| Quadrant-wise count rates Data is divided into 100 sec bins |
 |
|
| Module-wise count rates for Quadrant A Data is divided into 100 sec bins |
 |
 |
| Module-wise count rates for Quadrant B Data is divided into 100 sec bins |
 |
 |
| Module-wise count rates for Quadrant C Data is divided into 100 sec bins |
 |
 |
| Module-wise count rates for Quadrant D Data is divided into 100 sec bins |
 |
 |
| Parameter | Plot |
|---|---|
| CZT HV Monitor |  |
| D_VDD |  |
| Temperature 1 |  |
| Veto HV Monitor |  |
| Veto LLD |  |
| Alpha Counter |  |
| _CPM_Rate |  |
| CZT Counter |  |
| +2.5 Volts monitor |  |
| +5 Volts monitor |  |
| _ROLL_ROT |  |
| _Roll_DEC |  |
| _Roll_RA |  |
| Veto Counter |  |