| Param | Original file | Final file |
|---|---|---|
| Filename | modeM0/AS1A10_021T03_9000004038_27960cztM0_level2.evt | modeM0/AS1A10_021T03_9000004038_27960cztM0_level2_quad_clean.evt |
| Size (bytes) | 120,049,920 | 32,417,280 |
| Size | 114.5 MB | 30.9 MB |
| Events in quadrant A | 744,110 | 221,462 |
| Events in quadrant B | 757,398 | 223,846 |
| Events in quadrant C | 753,145 | 215,659 |
| Events in quadrant D | 1,272,931 | 205,617 |
| Mode M0 | |||
|---|---|---|---|
| Quadrant | BADHDUFLAG | Total packets | Discarded packets |
| A | 0 | 3177 | 0 |
| B | 0 | 3192 | 0 |
| C | 0 | 3199 | 0 |
| D | 0 | 4802 | 0 |
| Mode M9 | |||
|---|---|---|---|
| Quadrant | BADHDUFLAG | Total packets | Discarded packets |
| A | 0 | 1 | 0 |
| B | 0 | 1 | 0 |
| C | 0 | 1 | 0 |
| D | 0 | 1 | 0 |
| Quadrant | Total seconds | Saturated seconds | Saturation percentage |
|---|---|---|---|
| A | 1555 | 5 | 0.321543% |
| B | 1555 | 1 | 0.064309% |
| C | 1555 | 5 | 0.321543% |
| D | 1554 | 79 | 5.083655% |
Noise dominated data is calculated using 1-second bins in cleaned event files. If a bin has >2000 counts, and if more than 50% of those come from <1% of pixels, then it is considered to be noise-dominated and hence unusable.
| Quadrant | # 1 sec bins | Bins with >0 counts | Bins with >2000 counts | High rate bins dominated by noise | Noise dominated (total time) | Noise dominated (detector-on time) | Marked lightcurve |
|---|---|---|---|---|---|---|---|
| A | 1555 | 1555 | 2 | 2 | 0.13% | 0.13% | 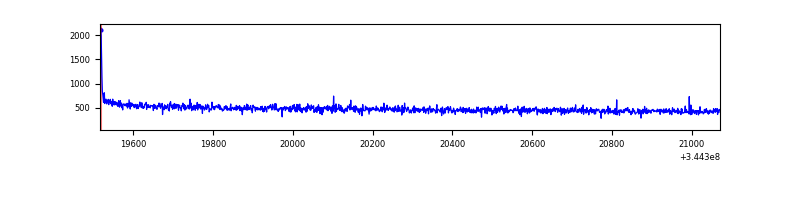 |
| B | 1555 | 1555 | 0 | 0 | 0.00% | 0.00% | 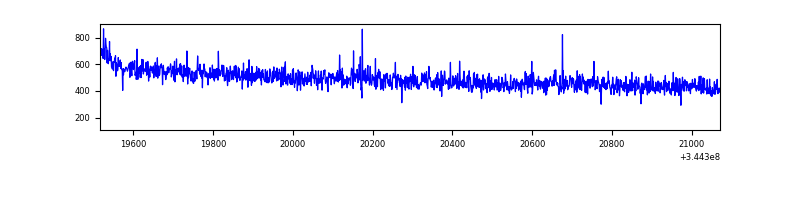 |
| C | 1555 | 1555 | 0 | 0 | 0.00% | 0.00% | 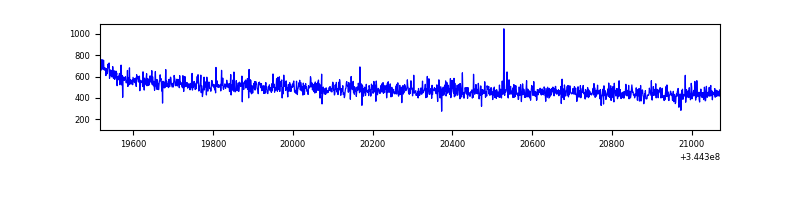 |
| D | 1554 | 1554 | 73 | 73 | 4.70% | 4.70% | 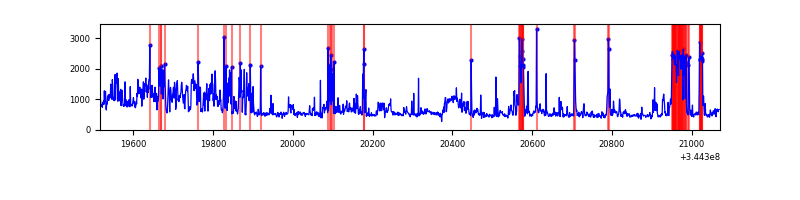 |
Top three noisy pixels from each quadrant. If the there are fewer than three noisy pixels in the level2.evt file, extra rows are filled as -1
| Pixel properties | Quadrant properties | ||||||
|---|---|---|---|---|---|---|---|
| Quadrant | DetID | PixID | Counts | Sigma | Mean | Median | Sigma |
| A | 8 | 192 | 6411 | 155.07 | 191 | 188 | 40.1 |
| A | 13 | 254 | 2594 | 59.96 | 191 | 188 | 40.1 |
| A | 3 | 137 | 1796 | 40.07 | 191 | 188 | 40.1 |
| B | 12 | 111 | 4541 | 113.77 | 192 | 188 | 38.3 |
| B | 11 | 111 | 3835 | 95.31 | 192 | 188 | 38.3 |
| B | 14 | 111 | 3796 | 94.3 | 192 | 188 | 38.3 |
| C | 14 | 238 | 29091 | 646.15 | 184 | 185 | 44.7 |
| C | 3 | 233 | 2096 | 42.72 | 184 | 185 | 44.7 |
| C | 2 | 16 | 1517 | 29.77 | 184 | 185 | 44.7 |
| D | 1 | 52 | 340090 | 7808.25 | 179 | 174 | 43.5 |
| D | 7 | 80 | 223334 | 5126.23 | 179 | 174 | 43.5 |
| D | 8 | 195 | 27102 | 618.57 | 179 | 174 | 43.5 |
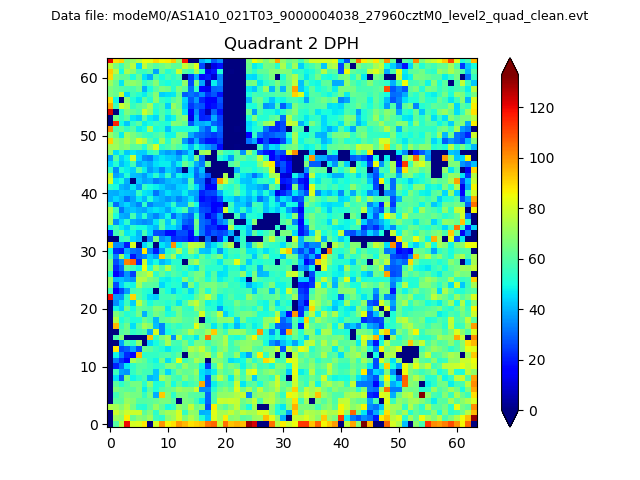
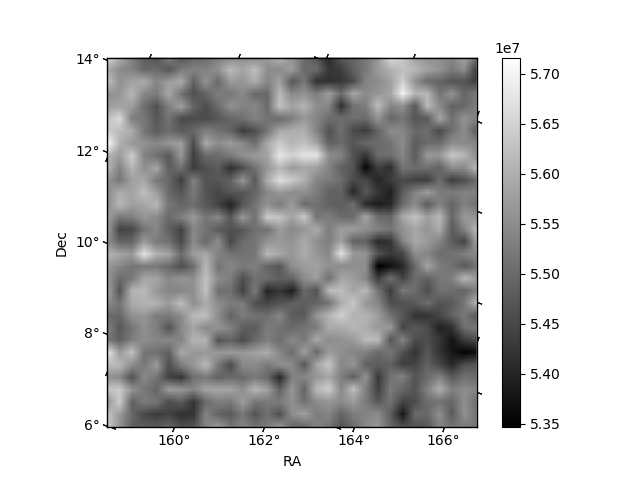
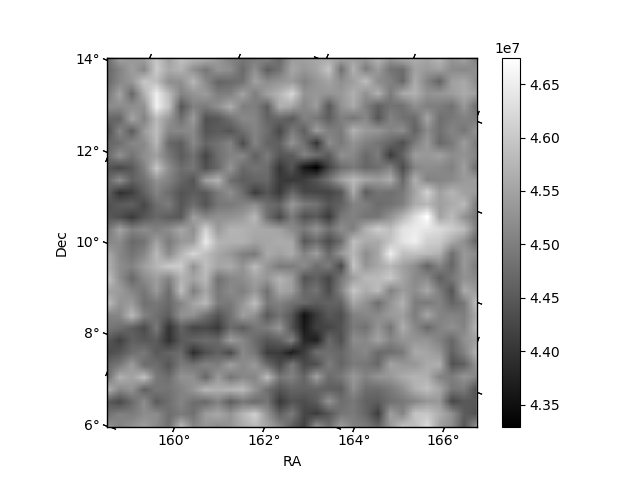
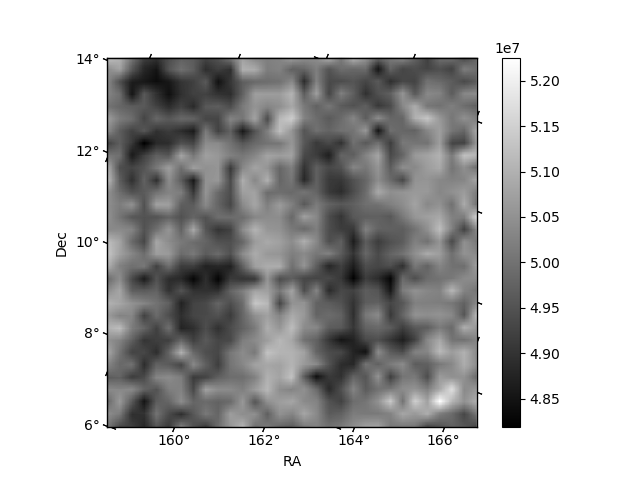
Histogram calculated using DETX and DETY for each event in the final _common_clean file
| Quadrant A | 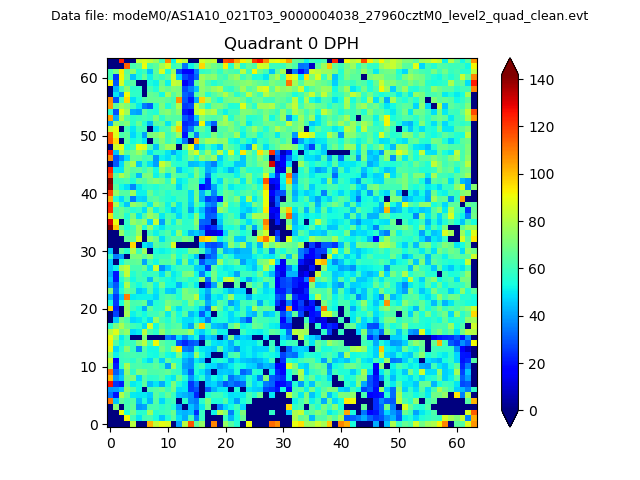 |
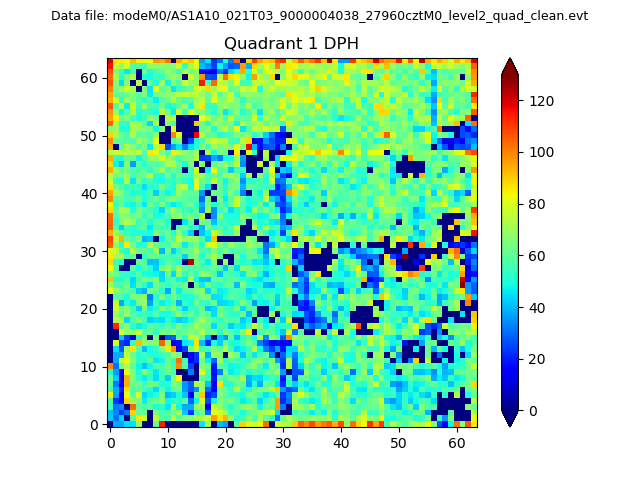 |
Quadrant B |
|---|---|---|---|
| Quadrant D | 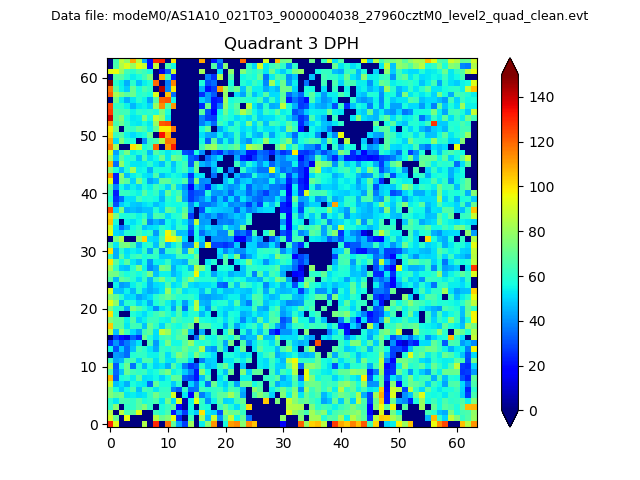 |
 |
Quadrant C |
| Plot type | Count rate plots | Images |
|---|---|---|
| Comparison with Poisson distribution Blue bars denote a histogram of data divided into 1 sec bins. Red curve is a Poisson curve with rate = median count rate of data. |
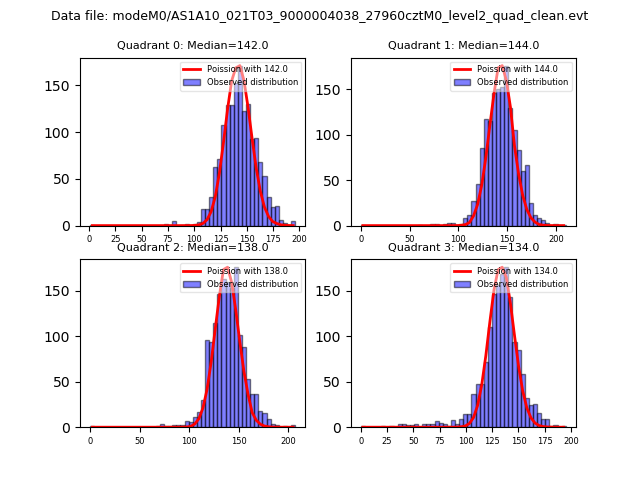 |
 |
| Quadrant-wise count rates Data is divided into 100 sec bins |
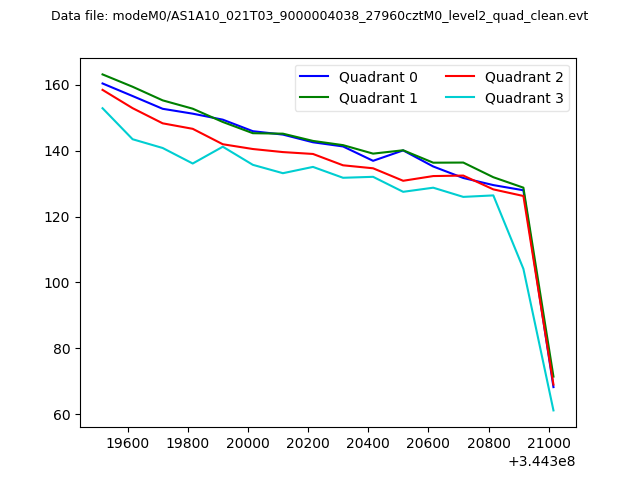 |
|
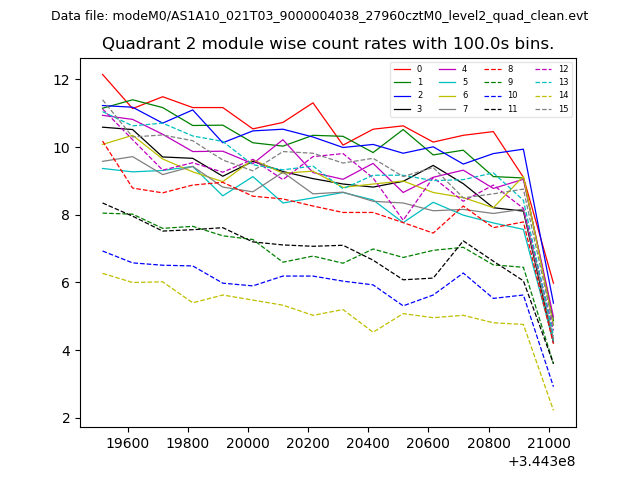
| Module-wise count rates for Quadrant A Data is divided into 100 sec bins |
 |
 |
| Module-wise count rates for Quadrant B Data is divided into 100 sec bins |
 |
 |
| Module-wise count rates for Quadrant C Data is divided into 100 sec bins |
 |
 |
| Module-wise count rates for Quadrant D Data is divided into 100 sec bins |
 |
 |
| Parameter | Plot |
|---|---|
| CZT HV Monitor | 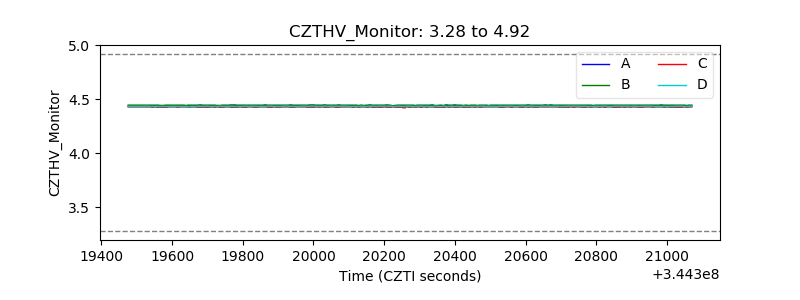 |
| D_VDD | 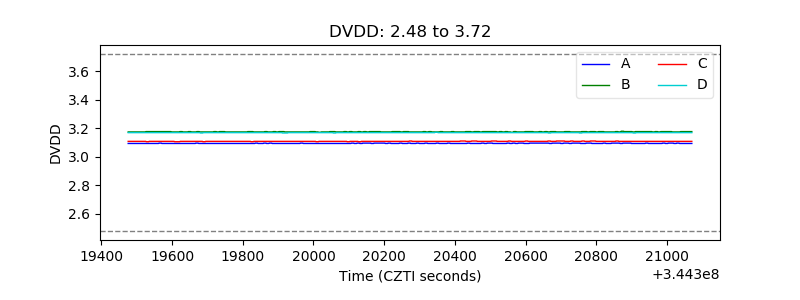 |
| Temperature 1 | 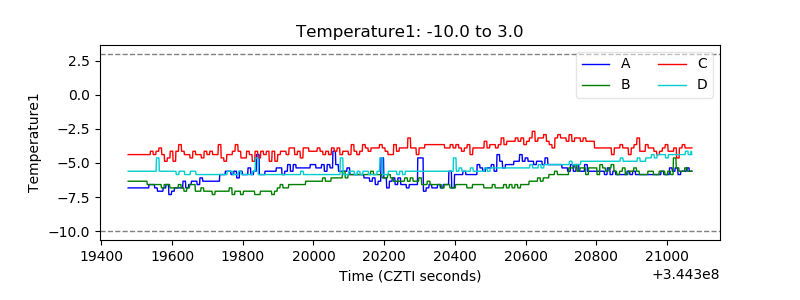 |
| Veto HV Monitor | 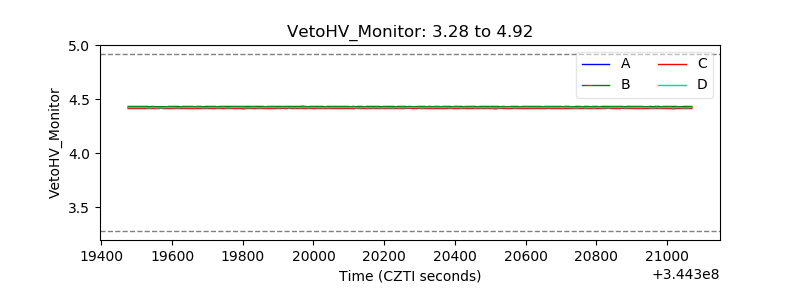 |
| Veto LLD | 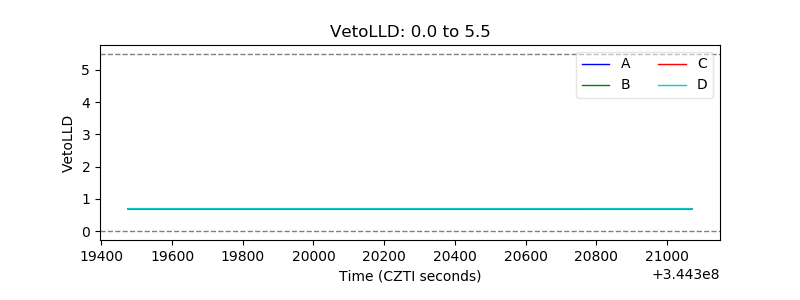 |
| Alpha Counter | 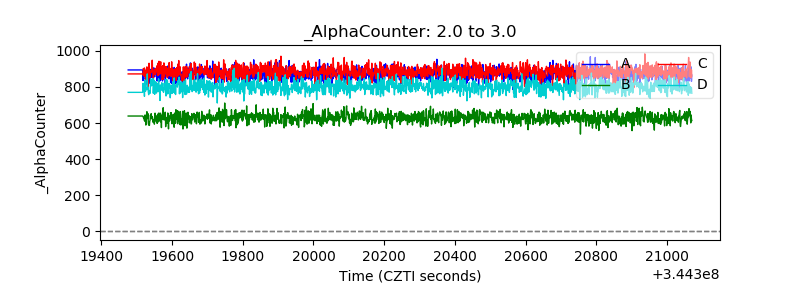 |
| _CPM_Rate | 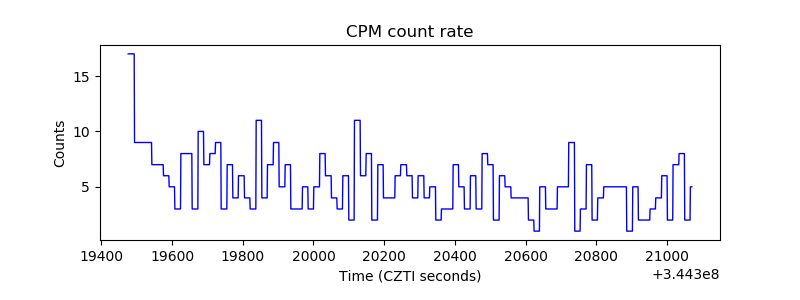 |
| CZT Counter | 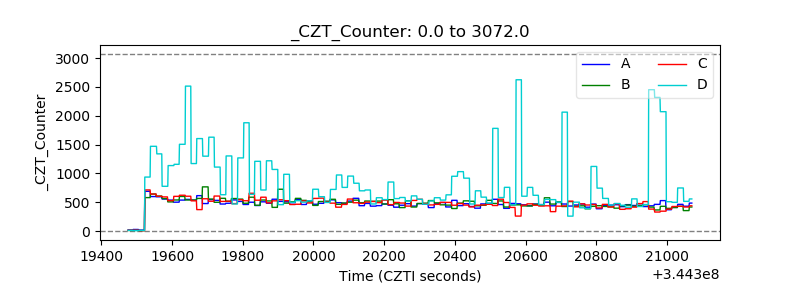 |
| +2.5 Volts monitor |  |
| +5 Volts monitor |  |
| _ROLL_ROT |  |
| _Roll_DEC | 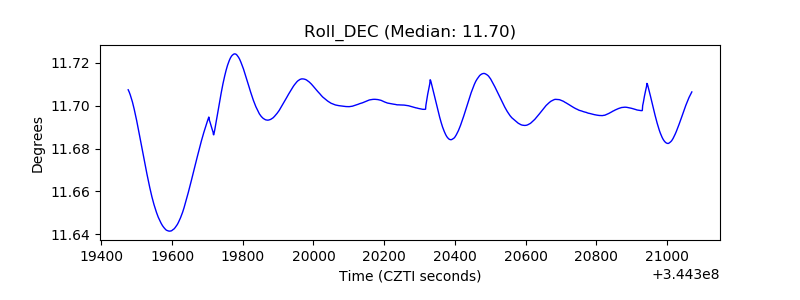 |
| _Roll_RA | 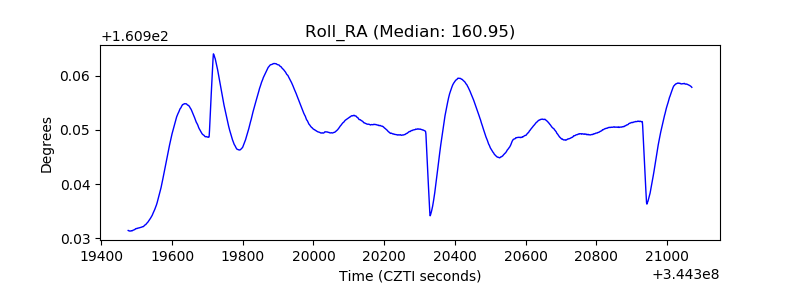 |
| Veto Counter |  |