| Param | Original file | Final file |
|---|---|---|
| Filename | modeM0/AS1A10_021T03_9000004038_27961cztM0_level2.evt | modeM0/AS1A10_021T03_9000004038_27961cztM0_level2_quad_clean.evt |
| Size (bytes) | 518,711,040 | 94,590,720 |
| Size | 494.7 MB | 90.2 MB |
| Events in quadrant A | 3,201,517 | 613,298 |
| Events in quadrant B | 3,336,460 | 622,277 |
| Events in quadrant C | 3,255,283 | 599,043 |
| Events in quadrant D | 5,471,215 | 572,773 |
| Mode M0 | |||
|---|---|---|---|
| Quadrant | BADHDUFLAG | Total packets | Discarded packets |
| A | 0 | 13473 | 0 |
| B | 0 | 13861 | 0 |
| C | 0 | 13599 | 0 |
| D | 0 | 20660 | 0 |
| Mode M9 | |||
|---|---|---|---|
| Quadrant | BADHDUFLAG | Total packets | Discarded packets |
| A | 0 | 10 | 0 |
| B | 0 | 10 | 0 |
| C | 0 | 10 | 0 |
| D | 0 | 10 | 0 |
| Quadrant | Total seconds | Saturated seconds | Saturation percentage |
|---|---|---|---|
| A | 6550 | 41 | 0.625954% |
| B | 6550 | 48 | 0.732824% |
| C | 6551 | 64 | 0.976950% |
| D | 6551 | 516 | 7.876660% |
Noise dominated data is calculated using 1-second bins in cleaned event files. If a bin has >2000 counts, and if more than 50% of those come from <1% of pixels, then it is considered to be noise-dominated and hence unusable.
| Quadrant | # 1 sec bins | Bins with >0 counts | Bins with >2000 counts | High rate bins dominated by noise | Noise dominated (total time) | Noise dominated (detector-on time) | Marked lightcurve |
|---|---|---|---|---|---|---|---|
| A | 7610 | 6550 | 0 | 0 | 0.00% | 0.00% | 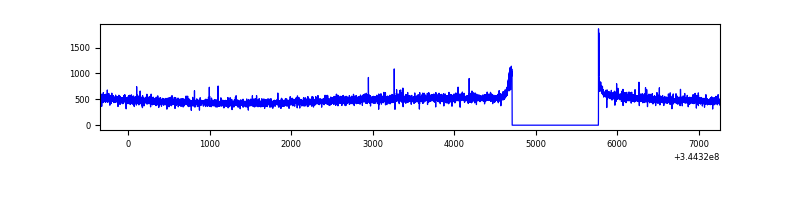 |
| B | 7610 | 6550 | 1 | 1 | 0.01% | 0.02% | 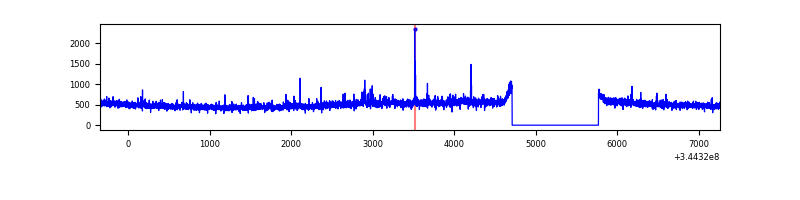 |
| C | 7611 | 6551 | 0 | 0 | 0.00% | 0.00% | 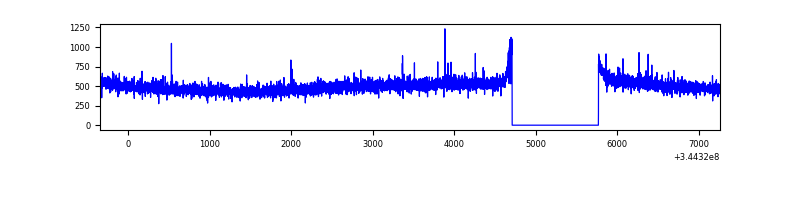 |
| D | 7611 | 6551 | 409 | 409 | 5.37% | 6.24% | 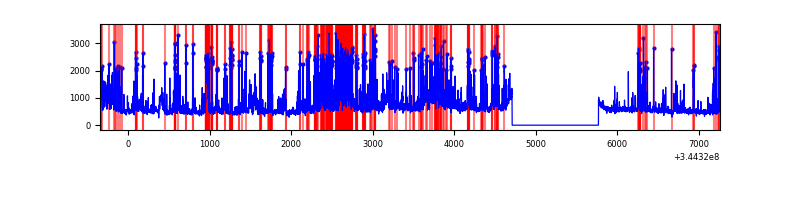 |
Top three noisy pixels from each quadrant. If the there are fewer than three noisy pixels in the level2.evt file, extra rows are filled as -1
| Pixel properties | Quadrant properties | ||||||
|---|---|---|---|---|---|---|---|
| Quadrant | DetID | PixID | Counts | Sigma | Mean | Median | Sigma |
| A | 13 | 254 | 11138 | 62.57 | 828 | 811 | 165.0 |
| A | 3 | 137 | 7664 | 41.52 | 828 | 811 | 165.0 |
| A | 0 | 226 | 7113 | 38.18 | 828 | 811 | 165.0 |
| B | 10 | 245 | 95684 | 609.94 | 819 | 800 | 155.6 |
| B | 12 | 111 | 19127 | 117.81 | 819 | 800 | 155.6 |
| B | 11 | 111 | 17163 | 105.19 | 819 | 800 | 155.6 |
| C | 14 | 238 | 126970 | 675.5 | 795 | 801 | 186.8 |
| C | 2 | 16 | 16792 | 85.62 | 795 | 801 | 186.8 |
| C | 3 | 233 | 10397 | 51.38 | 795 | 801 | 186.8 |
| D | 1 | 52 | 1861843 | 10137.83 | 778 | 759 | 183.6 |
| D | 7 | 80 | 398095 | 2164.4 | 778 | 759 | 183.6 |
| D | 8 | 195 | 121205 | 656.1 | 778 | 759 | 183.6 |
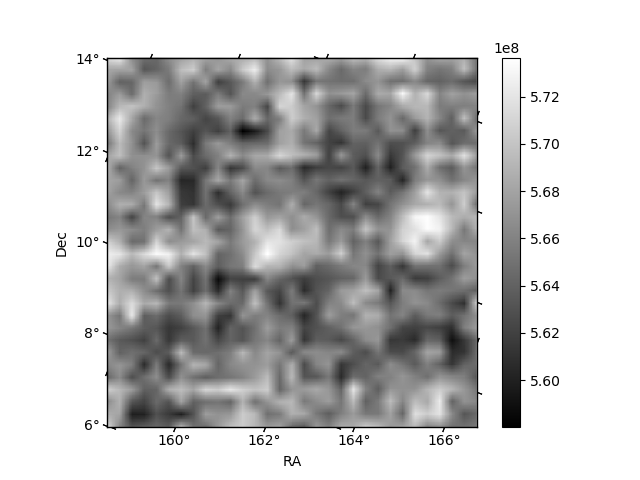
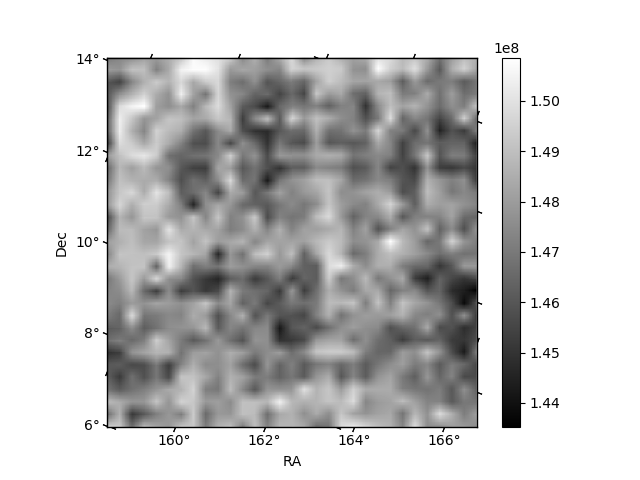
Histogram calculated using DETX and DETY for each event in the final _common_clean file
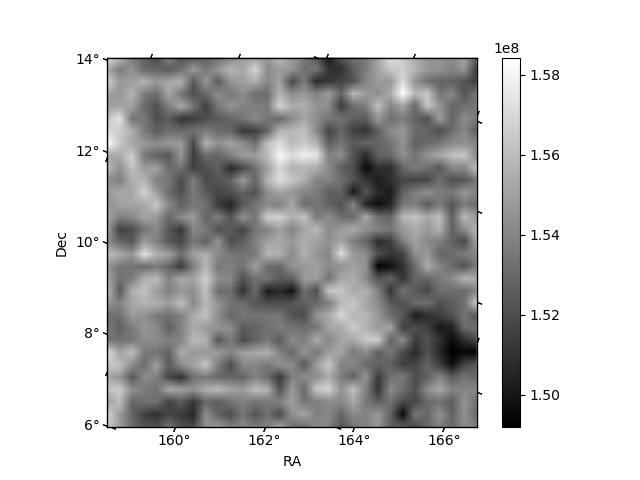
| Quadrant A | 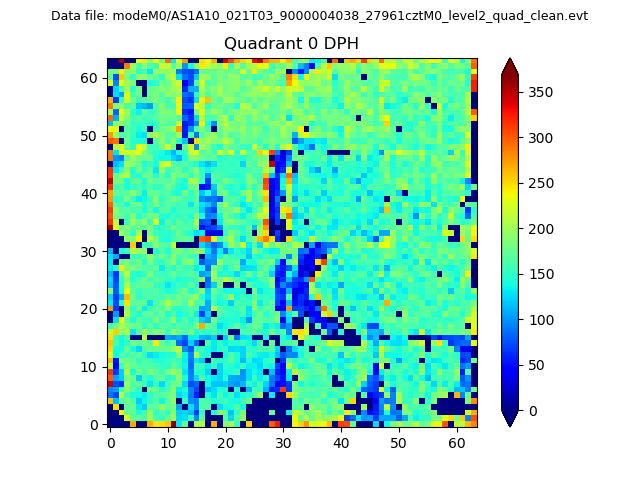 |
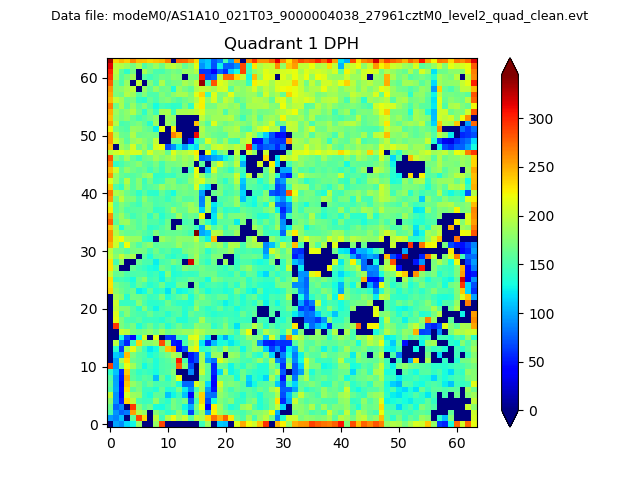 |
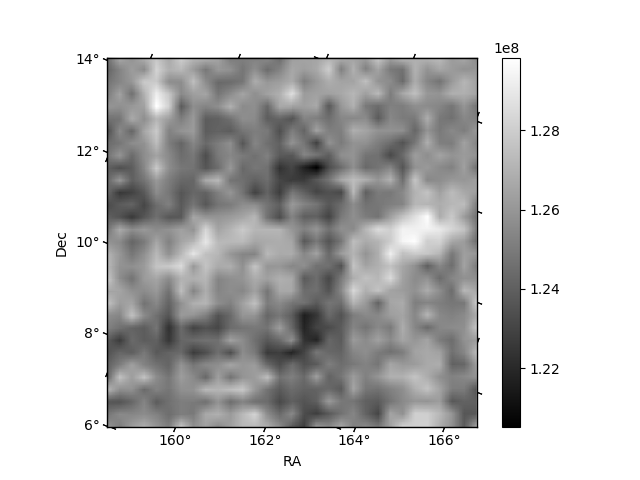
Quadrant B |
|---|---|---|---|
| Quadrant D | 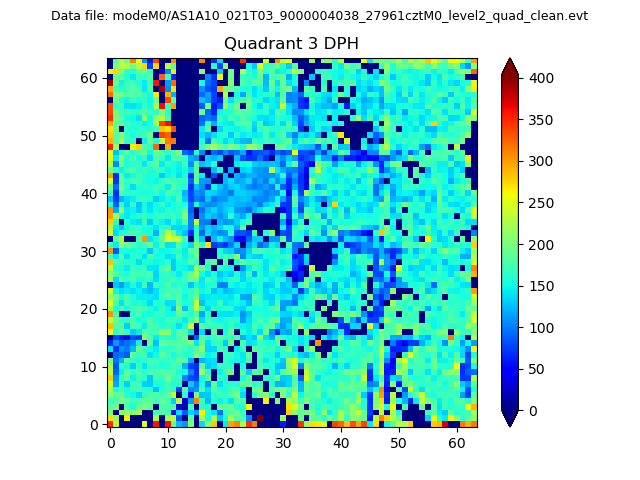 |
 |
Quadrant C |
| Plot type | Count rate plots | Images |
|---|---|---|
| Comparison with Poisson distribution Blue bars denote a histogram of data divided into 1 sec bins. Red curve is a Poisson curve with rate = median count rate of data. |
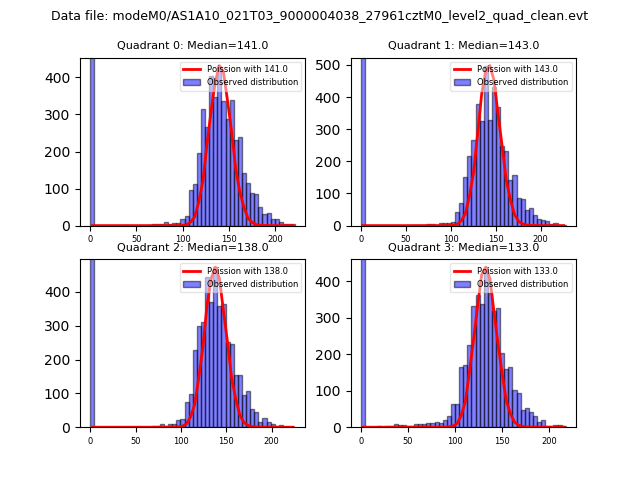 |
 |
| Quadrant-wise count rates Data is divided into 100 sec bins |
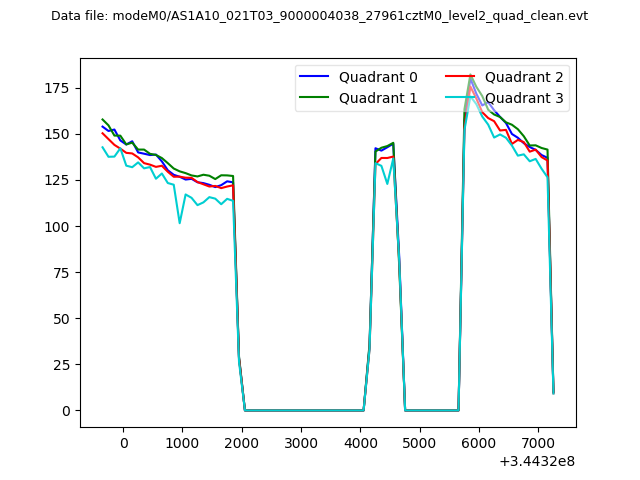 |
|
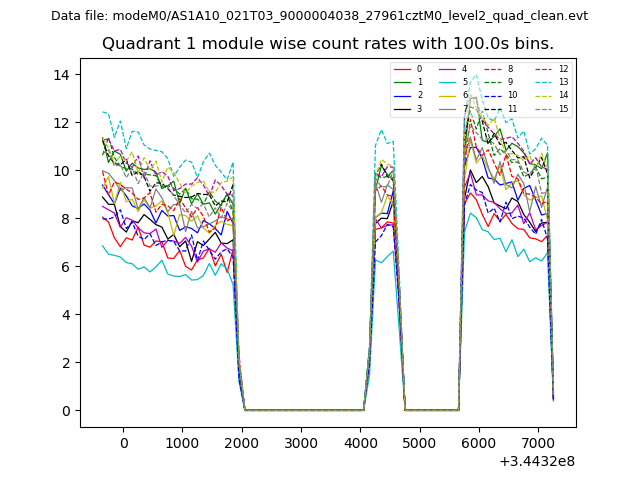
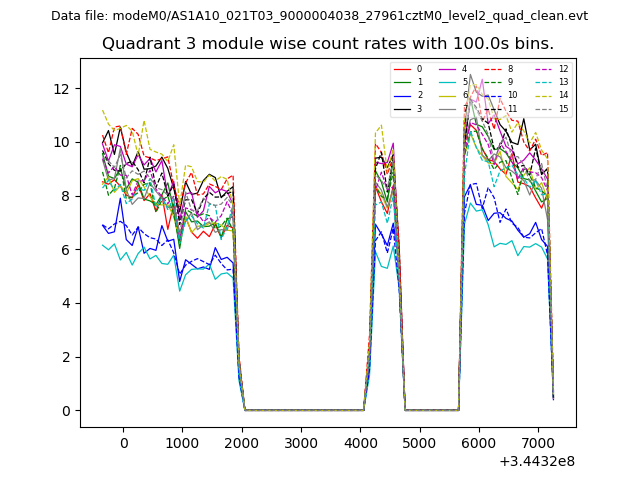
| Module-wise count rates for Quadrant A Data is divided into 100 sec bins |
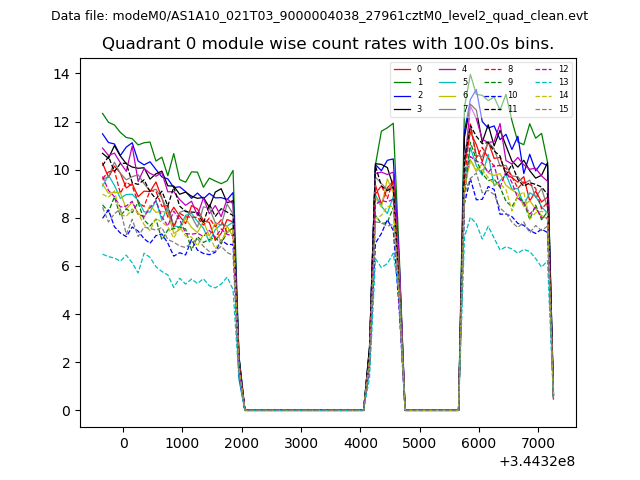 |
 |
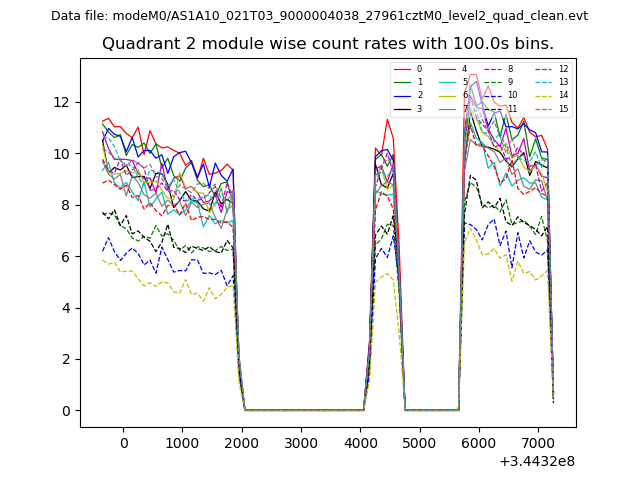
| Module-wise count rates for Quadrant B Data is divided into 100 sec bins |
 |
 |
| Module-wise count rates for Quadrant C Data is divided into 100 sec bins |
 |
 |
| Module-wise count rates for Quadrant D Data is divided into 100 sec bins |
 |
 |
| Parameter | Plot |
|---|---|
| CZT HV Monitor | 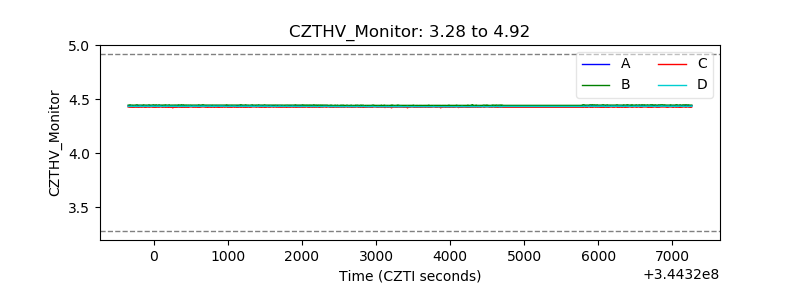 |
| D_VDD | 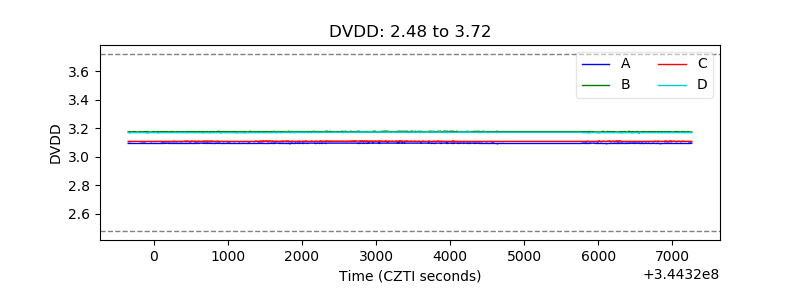 |
| Temperature 1 | 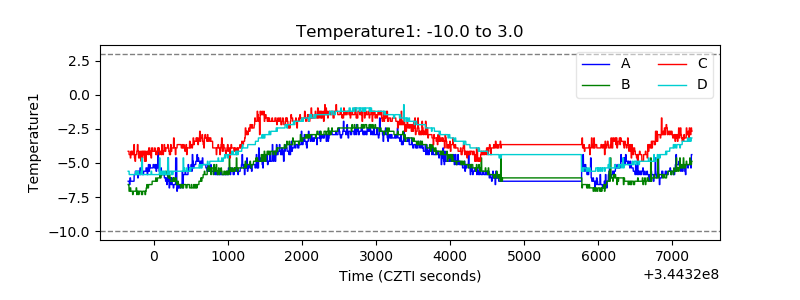 |
| Veto HV Monitor | 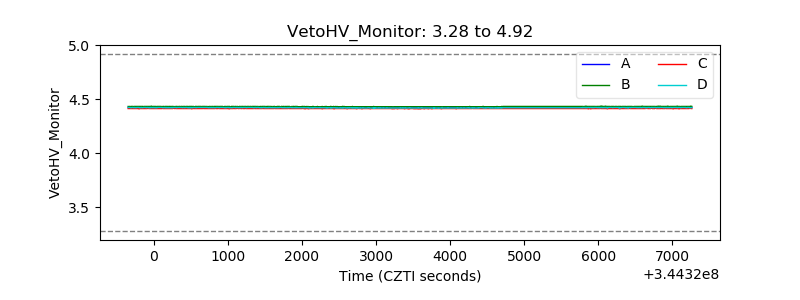 |
| Veto LLD | 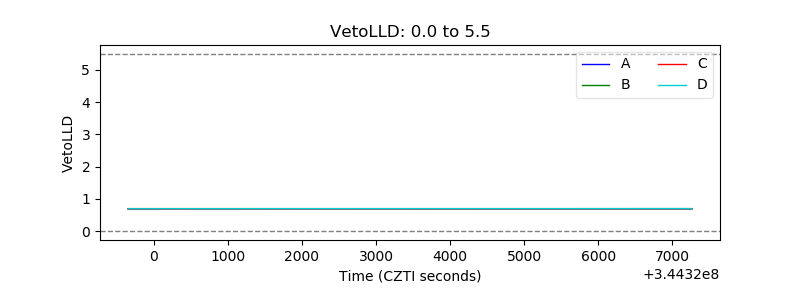 |
| Alpha Counter | 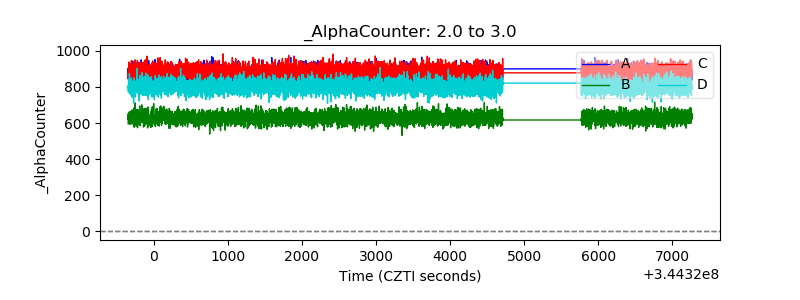 |
| _CPM_Rate | 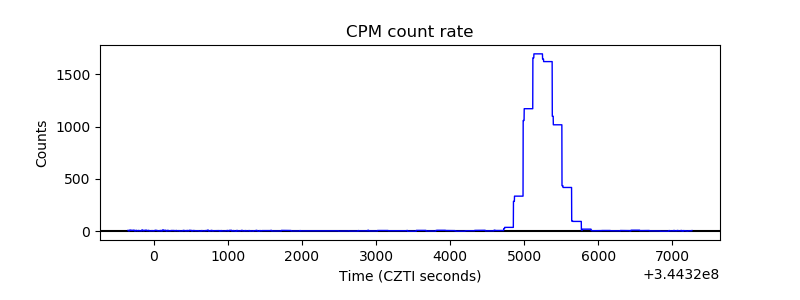 |
| CZT Counter | 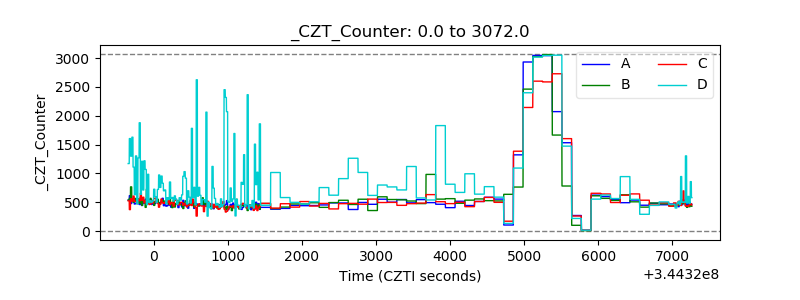 |
| +2.5 Volts monitor |  |
| +5 Volts monitor |  |
| _ROLL_ROT | 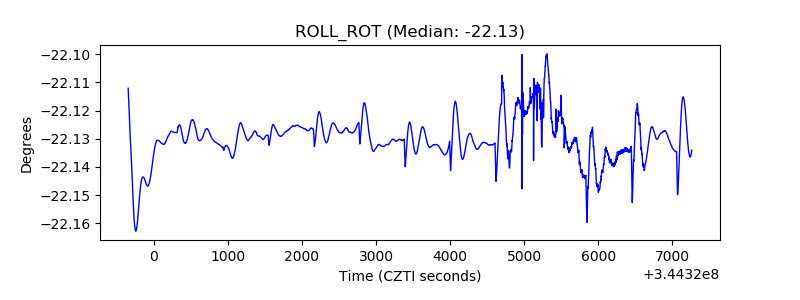 |
| _Roll_DEC | 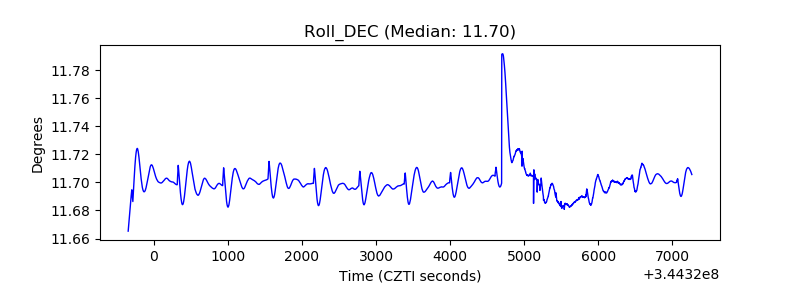 |
| _Roll_RA |  |
| Veto Counter | 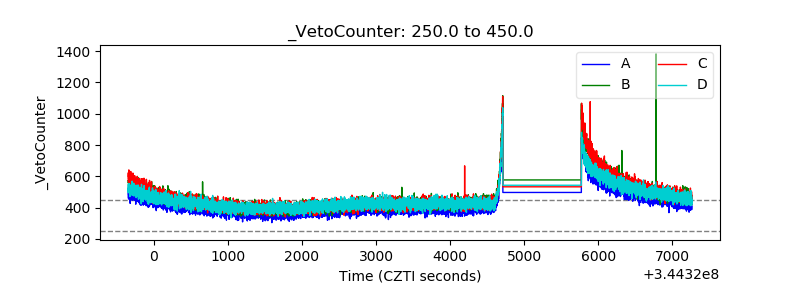 |