| Param | Original file | Final file |
|---|---|---|
| Filename | modeM0/AS1A10_021T03_9000004038_27963cztM0_level2.evt | modeM0/AS1A10_021T03_9000004038_27963cztM0_level2_quad_clean.evt |
| Size (bytes) | 489,260,160 | 83,183,040 |
| Size | 466.6 MB | 79.3 MB |
| Events in quadrant A | 2,954,318 | 541,621 |
| Events in quadrant B | 3,832,957 | 546,722 |
| Events in quadrant C | 3,078,844 | 529,388 |
| Events in quadrant D | 4,561,767 | 499,554 |
| Mode M0 | |||
|---|---|---|---|
| Quadrant | BADHDUFLAG | Total packets | Discarded packets |
| A | 0 | 12106 | 0 |
| B | 0 | 15249 | 0 |
| C | 0 | 12590 | 0 |
| D | 0 | 17452 | 0 |
| Mode M9 | |||
|---|---|---|---|
| Quadrant | BADHDUFLAG | Total packets | Discarded packets |
| A | 0 | 12 | 0 |
| B | 0 | 12 | 0 |
| C | 0 | 12 | 0 |
| D | 0 | 12 | 0 |
| Quadrant | Total seconds | Saturated seconds | Saturation percentage |
|---|---|---|---|
| A | 5740 | 48 | 0.836237% |
| B | 5741 | 84 | 1.463160% |
| C | 5741 | 79 | 1.376067% |
| D | 5741 | 285 | 4.964292% |
Noise dominated data is calculated using 1-second bins in cleaned event files. If a bin has >2000 counts, and if more than 50% of those come from <1% of pixels, then it is considered to be noise-dominated and hence unusable.
| Quadrant | # 1 sec bins | Bins with >0 counts | Bins with >2000 counts | High rate bins dominated by noise | Noise dominated (total time) | Noise dominated (detector-on time) | Marked lightcurve |
|---|---|---|---|---|---|---|---|
| A | 6920 | 5740 | 3 | 3 | 0.04% | 0.05% |  |
| B | 6921 | 5741 | 7 | 7 | 0.10% | 0.12% |  |
| C | 6921 | 5741 | 1 | 1 | 0.01% | 0.02% |  |
| D | 6921 | 5741 | 219 | 219 | 3.16% | 3.81% |  |
Top three noisy pixels from each quadrant. If the there are fewer than three noisy pixels in the level2.evt file, extra rows are filled as -1
| Pixel properties | Quadrant properties | ||||||
|---|---|---|---|---|---|---|---|
| Quadrant | DetID | PixID | Counts | Sigma | Mean | Median | Sigma |
| A | 0 | 247 | 14305 | 90.63 | 760 | 747 | 149.6 |
| A | 13 | 254 | 10345 | 64.16 | 760 | 747 | 149.6 |
| A | 0 | 226 | 7600 | 45.81 | 760 | 747 | 149.6 |
| B | 10 | 245 | 787064 | 5601.99 | 746 | 729 | 140.4 |
| B | 15 | 32 | 98093 | 693.64 | 746 | 729 | 140.4 |
| B | 12 | 111 | 16859 | 114.91 | 746 | 729 | 140.4 |
| C | 14 | 238 | 118622 | 693.99 | 729 | 737 | 169.9 |
| C | 2 | 16 | 90108 | 526.13 | 729 | 737 | 169.9 |
| C | 15 | 208 | 19685 | 111.55 | 729 | 737 | 169.9 |
| D | 1 | 52 | 1050205 | 6100.15 | 724 | 706 | 172.0 |
| D | 7 | 80 | 455459 | 2643.23 | 724 | 706 | 172.0 |
| D | 8 | 195 | 96907 | 559.16 | 724 | 706 | 172.0 |
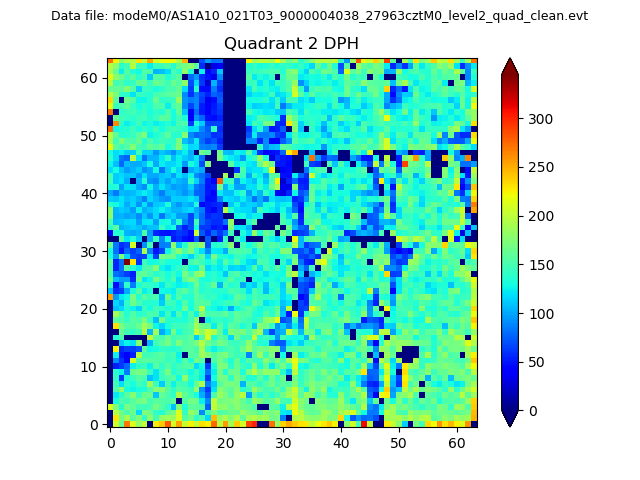
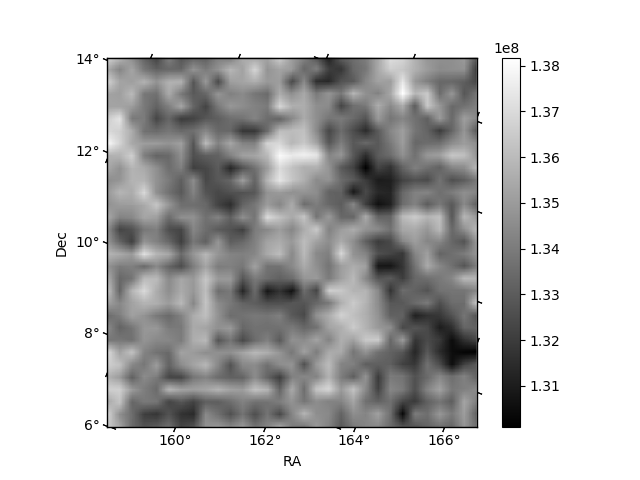
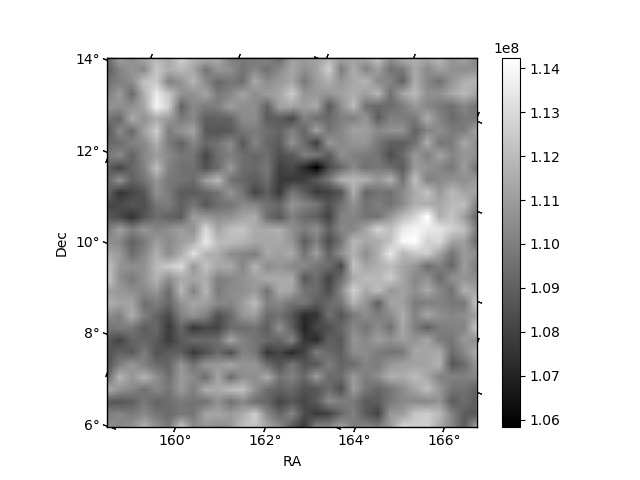
Histogram calculated using DETX and DETY for each event in the final _common_clean file
| Quadrant A | 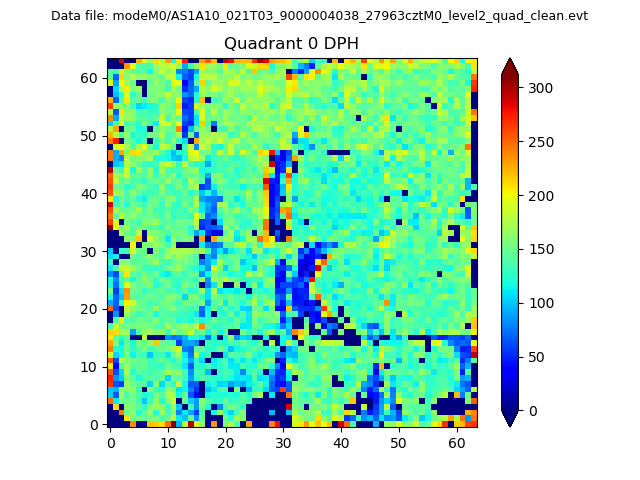 |
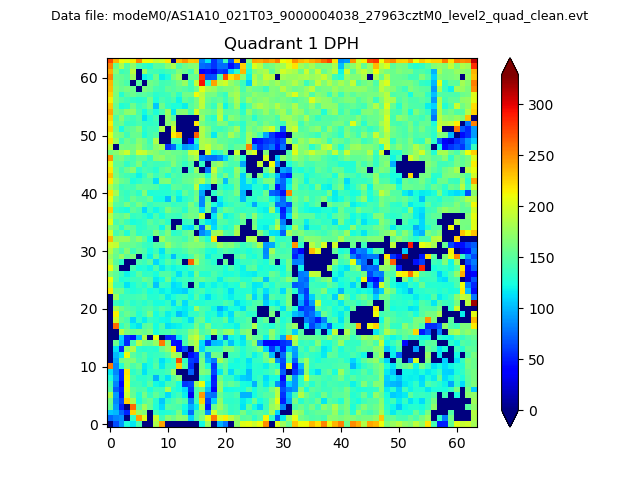 |
Quadrant B |
|---|---|---|---|
| Quadrant D | 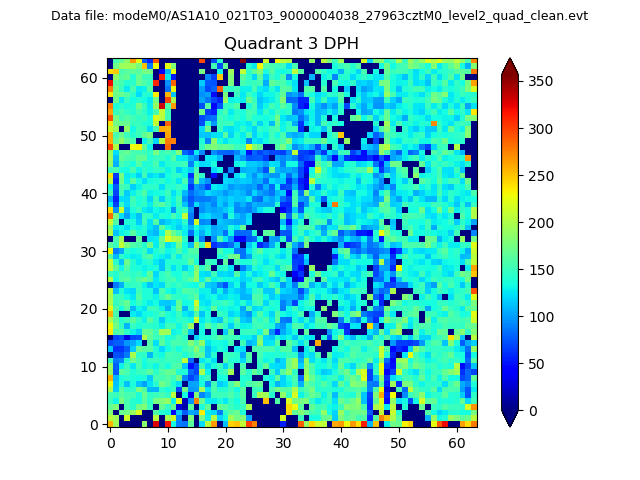 |
 |
Quadrant C |
| Plot type | Count rate plots | Images |
|---|---|---|
| Comparison with Poisson distribution Blue bars denote a histogram of data divided into 1 sec bins. Red curve is a Poisson curve with rate = median count rate of data. |
 |
 |
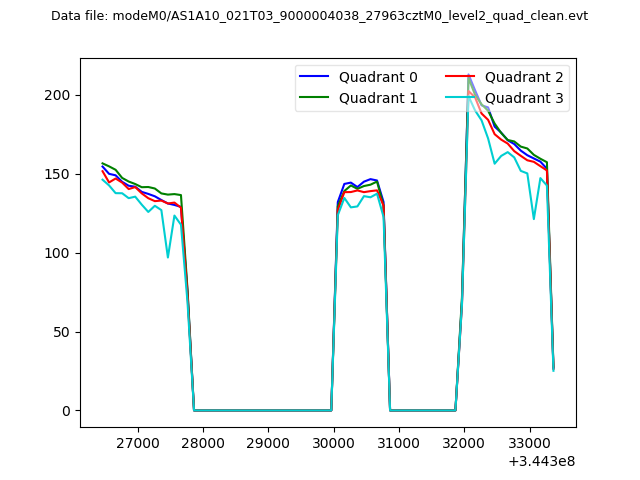
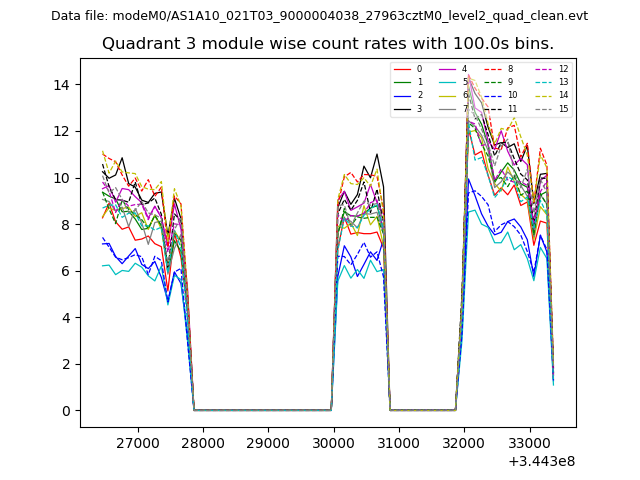
| Quadrant-wise count rates Data is divided into 100 sec bins |
 |
|
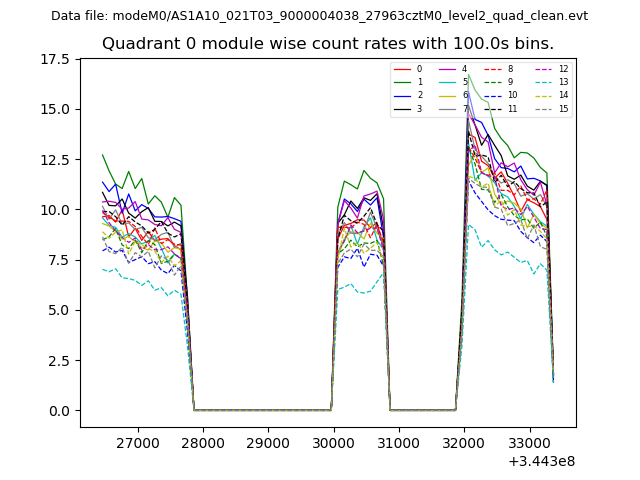
| Module-wise count rates for Quadrant A Data is divided into 100 sec bins |
 |
 |
| Module-wise count rates for Quadrant B Data is divided into 100 sec bins |
 |
 |
| Module-wise count rates for Quadrant C Data is divided into 100 sec bins |
 |
 |
| Module-wise count rates for Quadrant D Data is divided into 100 sec bins |
 |
 |
| Parameter | Plot |
|---|---|
| CZT HV Monitor |  |
| D_VDD | 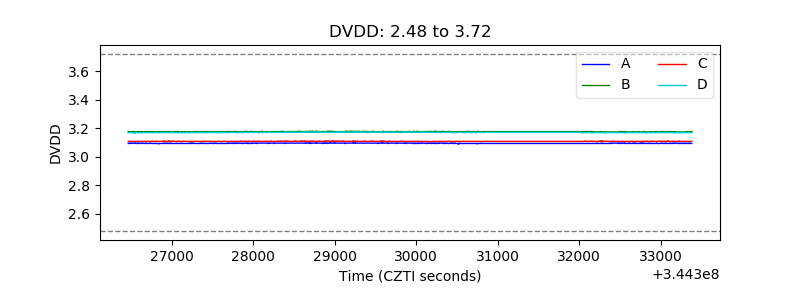 |
| Temperature 1 | 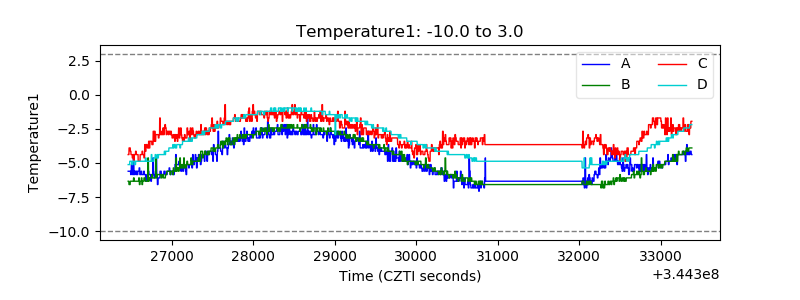 |
| Veto HV Monitor | 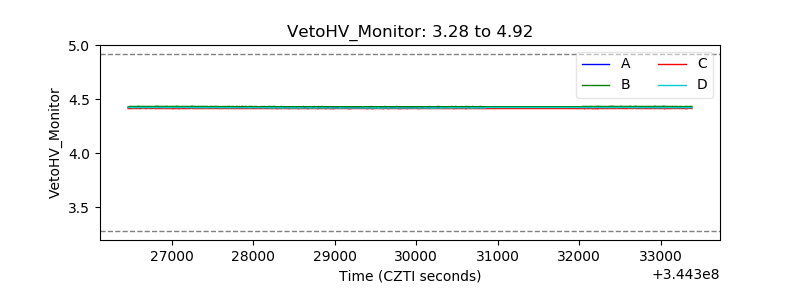 |
| Veto LLD | 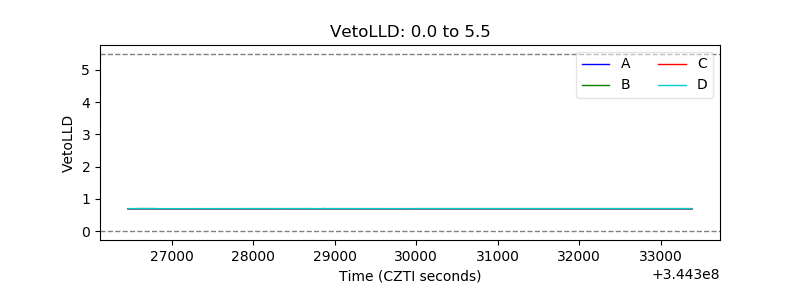 |
| Alpha Counter | 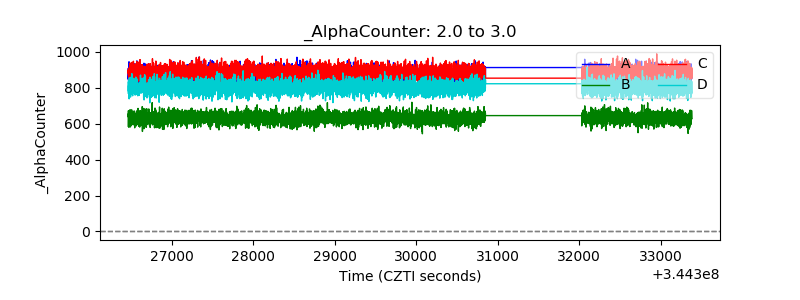 |
| _CPM_Rate | 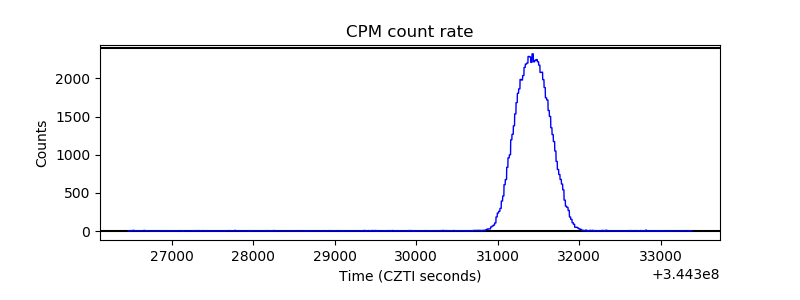 |
| CZT Counter | 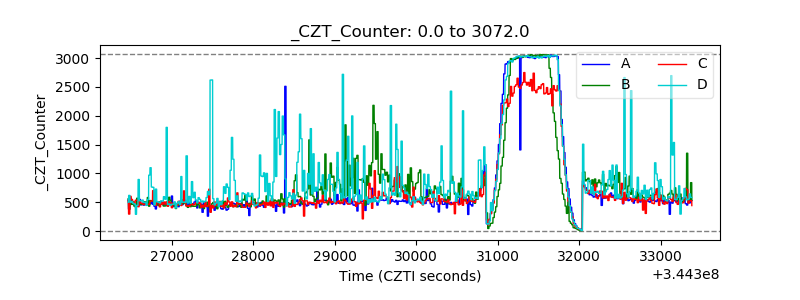 |
| +2.5 Volts monitor |  |
| +5 Volts monitor |  |
| _ROLL_ROT | 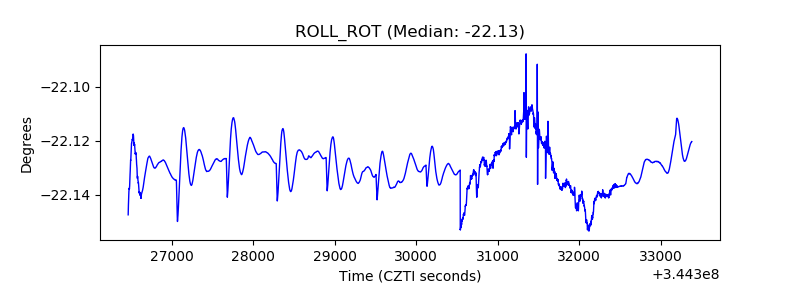 |
| _Roll_DEC | 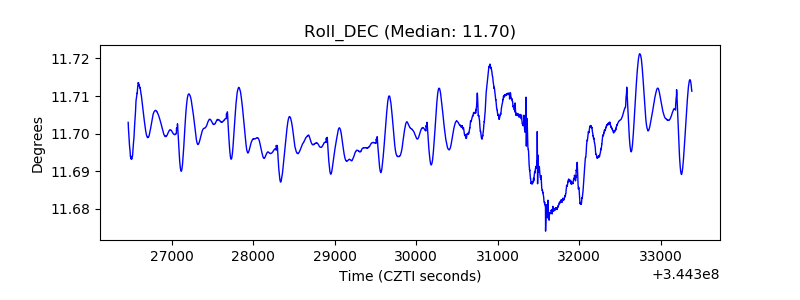 |
| _Roll_RA | 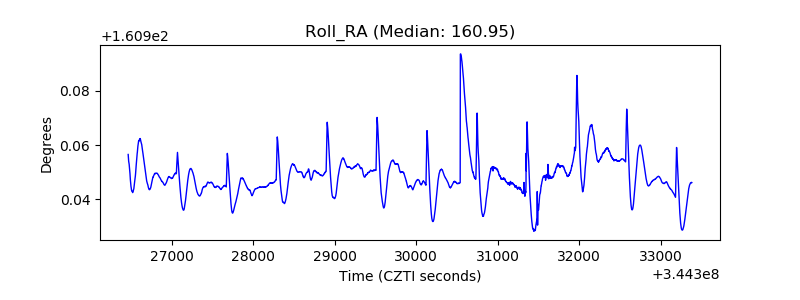 |
| Veto Counter | 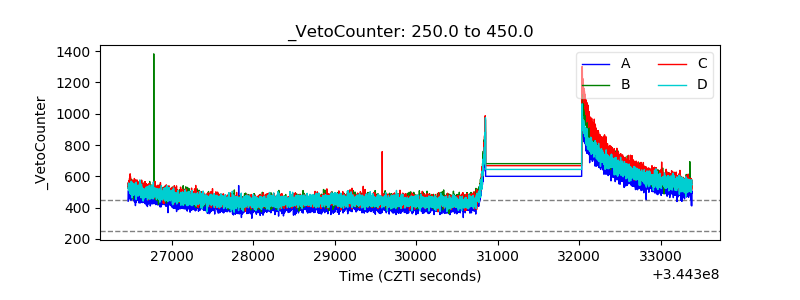 |