| Param | Original file | Final file |
|---|---|---|
| Filename | modeM0/AS1A10_021T03_9000004038_27964cztM0_level2.evt | modeM0/AS1A10_021T03_9000004038_27964cztM0_level2_quad_clean.evt |
| Size (bytes) | 569,813,760 | 101,776,320 |
| Size | 543.4 MB | 97.1 MB |
| Events in quadrant A | 3,424,718 | 678,666 |
| Events in quadrant B | 4,349,621 | 681,802 |
| Events in quadrant C | 3,831,499 | 659,639 |
| Events in quadrant D | 5,229,572 | 627,403 |
| Mode M0 | |||
|---|---|---|---|
| Quadrant | BADHDUFLAG | Total packets | Discarded packets |
| A | 0 | 13783 | 0 |
| B | 0 | 17295 | 0 |
| C | 0 | 15298 | 0 |
| D | 0 | 19983 | 0 |
| Mode M9 | |||
|---|---|---|---|
| Quadrant | BADHDUFLAG | Total packets | Discarded packets |
| A | 0 | 13 | 0 |
| B | 0 | 13 | 0 |
| C | 0 | 13 | 0 |
| D | 0 | 13 | 0 |
| Quadrant | Total seconds | Saturated seconds | Saturation percentage |
|---|---|---|---|
| A | 6231 | 74 | 1.187610% |
| B | 6232 | 111 | 1.781130% |
| C | 6232 | 156 | 2.503209% |
| D | 6232 | 374 | 6.001284% |
Noise dominated data is calculated using 1-second bins in cleaned event files. If a bin has >2000 counts, and if more than 50% of those come from <1% of pixels, then it is considered to be noise-dominated and hence unusable.
| Quadrant | # 1 sec bins | Bins with >0 counts | Bins with >2000 counts | High rate bins dominated by noise | Noise dominated (total time) | Noise dominated (detector-on time) | Marked lightcurve |
|---|---|---|---|---|---|---|---|
| A | 7506 | 6231 | 2 | 2 | 0.03% | 0.03% | 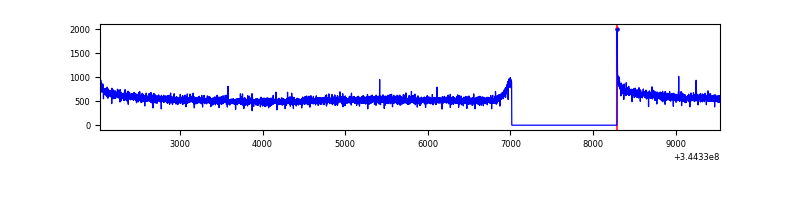 |
| B | 7507 | 6232 | 18 | 18 | 0.24% | 0.29% | 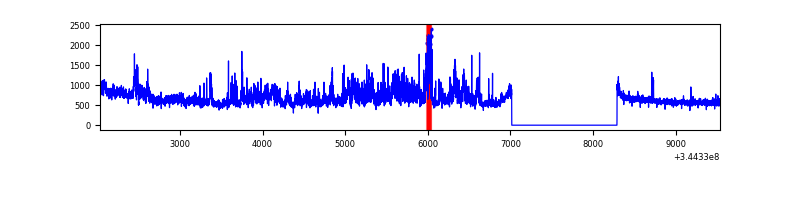 |
| C | 7507 | 6232 | 21 | 21 | 0.28% | 0.34% | 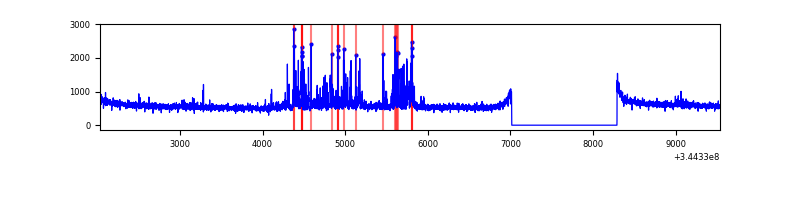 |
| D | 7506 | 6231 | 309 | 309 | 4.12% | 4.96% | 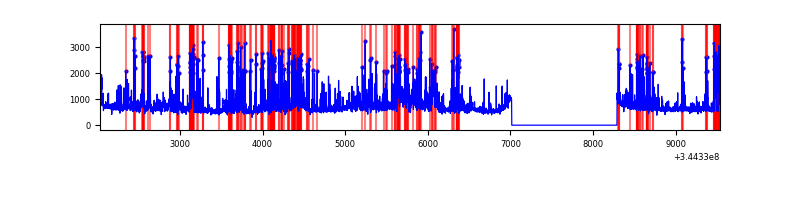 |
Top three noisy pixels from each quadrant. If the there are fewer than three noisy pixels in the level2.evt file, extra rows are filled as -1
| Pixel properties | Quadrant properties | ||||||
|---|---|---|---|---|---|---|---|
| Quadrant | DetID | PixID | Counts | Sigma | Mean | Median | Sigma |
| A | 13 | 254 | 11017 | 57.66 | 886 | 873 | 175.9 |
| A | 8 | 192 | 9504 | 49.06 | 886 | 873 | 175.9 |
| A | 0 | 226 | 7815 | 39.46 | 886 | 873 | 175.9 |
| B | 10 | 245 | 928725 | 5747.14 | 864 | 844 | 161.5 |
| B | 12 | 111 | 19010 | 112.52 | 864 | 844 | 161.5 |
| B | 11 | 111 | 17326 | 102.09 | 864 | 844 | 161.5 |
| C | 15 | 208 | 259422 | 1328.47 | 845 | 855 | 194.6 |
| C | 14 | 238 | 137752 | 703.35 | 845 | 855 | 194.6 |
| C | 2 | 16 | 91435 | 465.38 | 845 | 855 | 194.6 |
| D | 1 | 52 | 827929 | 4172.86 | 840 | 820 | 198.2 |
| D | 7 | 80 | 722144 | 3639.17 | 840 | 820 | 198.2 |
| D | 8 | 195 | 161983 | 813.09 | 840 | 820 | 198.2 |
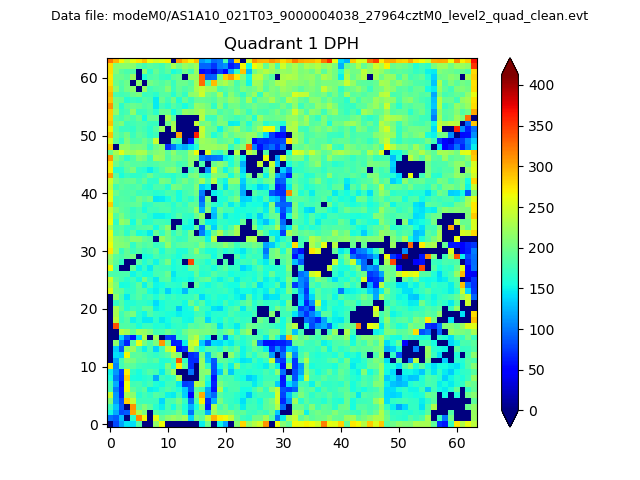
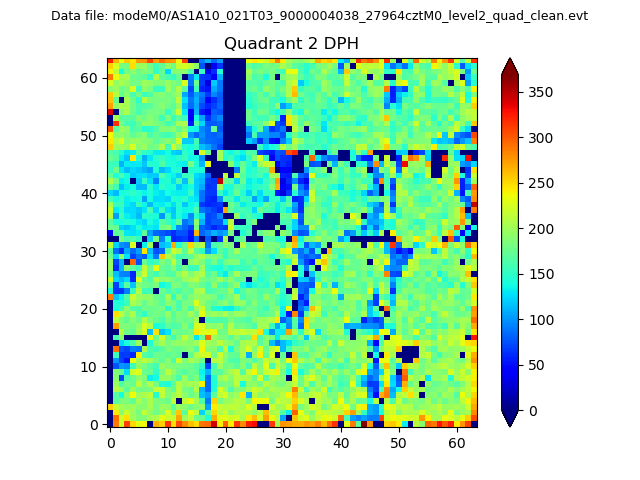
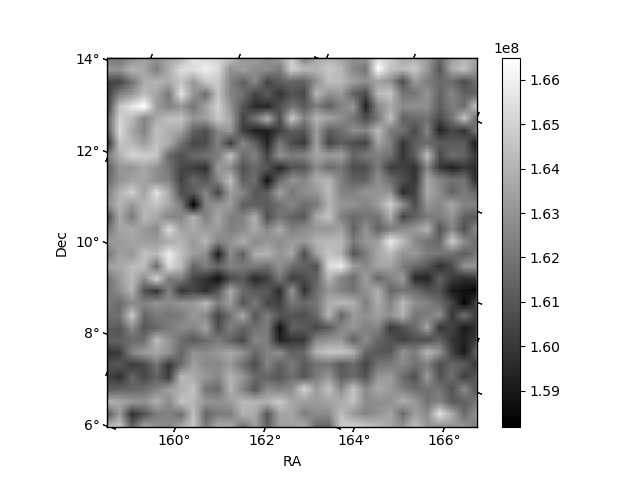
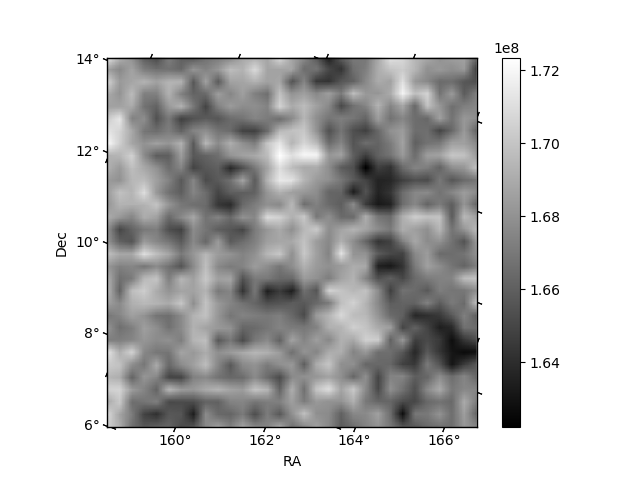
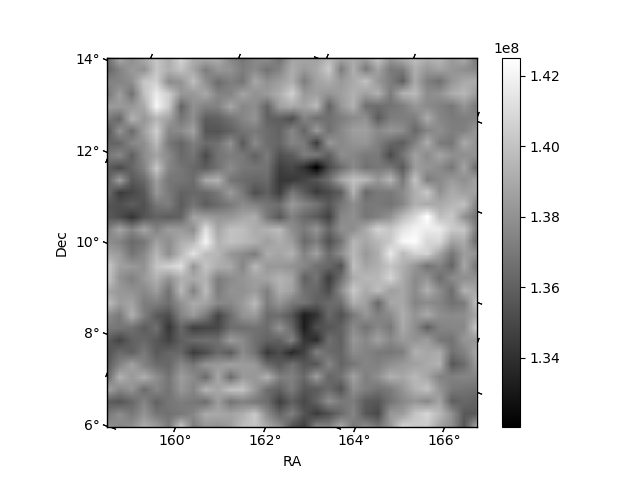
Histogram calculated using DETX and DETY for each event in the final _common_clean file
| Quadrant A |  |
 |
Quadrant B |
|---|---|---|---|
| Quadrant D |  |
 |
Quadrant C |
| Plot type | Count rate plots | Images |
|---|---|---|
| Comparison with Poisson distribution Blue bars denote a histogram of data divided into 1 sec bins. Red curve is a Poisson curve with rate = median count rate of data. |
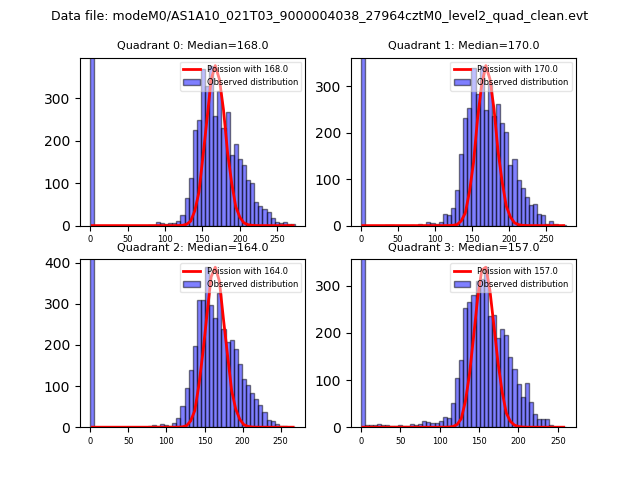 |
 |
| Quadrant-wise count rates Data is divided into 100 sec bins |
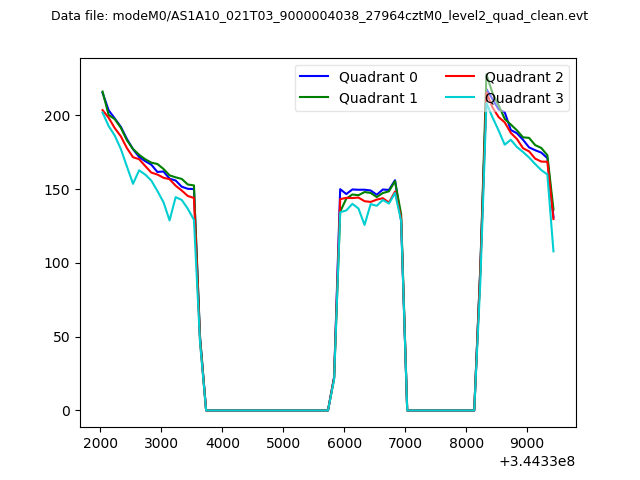 |
|
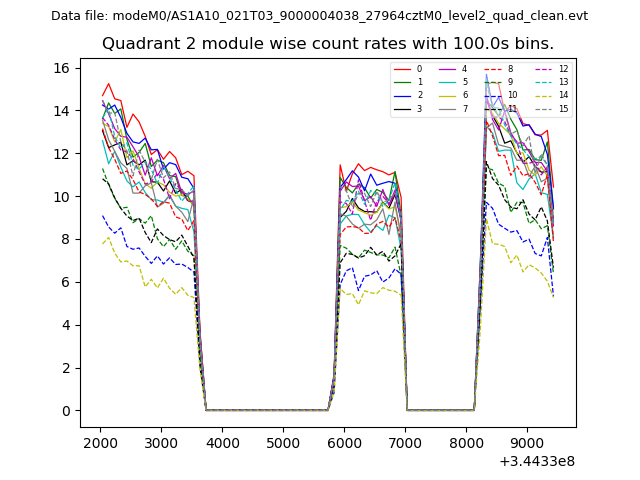
| Module-wise count rates for Quadrant A Data is divided into 100 sec bins |
 |
 |
| Module-wise count rates for Quadrant B Data is divided into 100 sec bins |
 |
 |
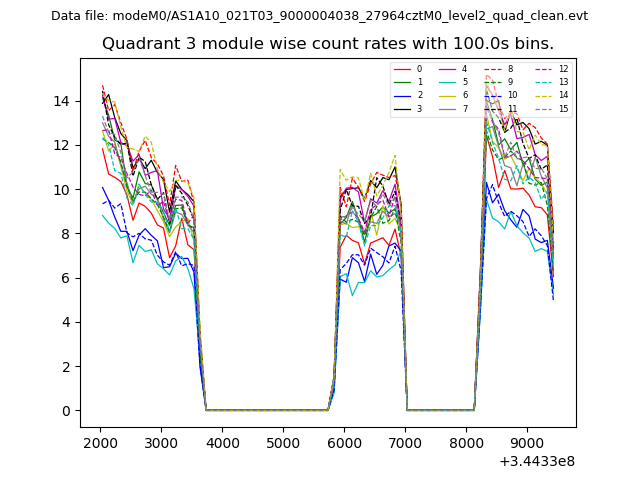
| Module-wise count rates for Quadrant C Data is divided into 100 sec bins |
 |
 |
| Module-wise count rates for Quadrant D Data is divided into 100 sec bins |
 |
 |
| Parameter | Plot |
|---|---|
| CZT HV Monitor | 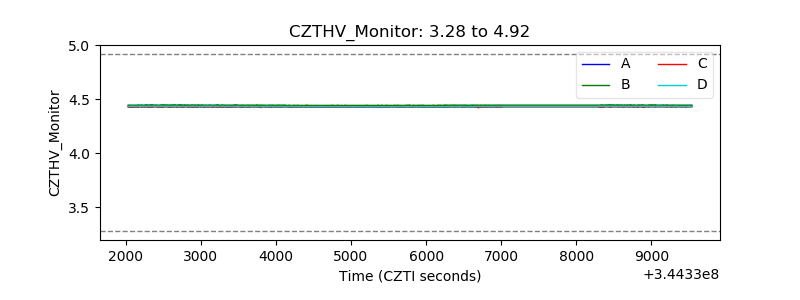 |
| D_VDD | 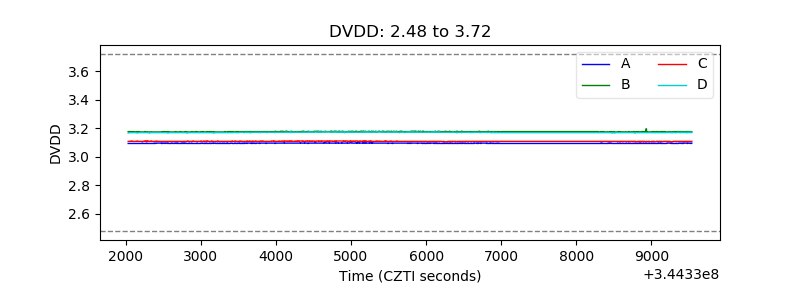 |
| Temperature 1 | 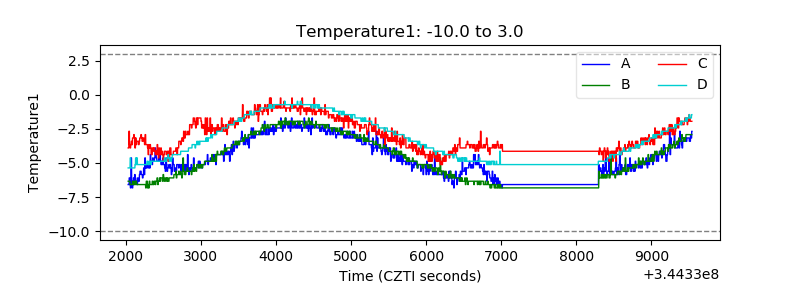 |
| Veto HV Monitor | 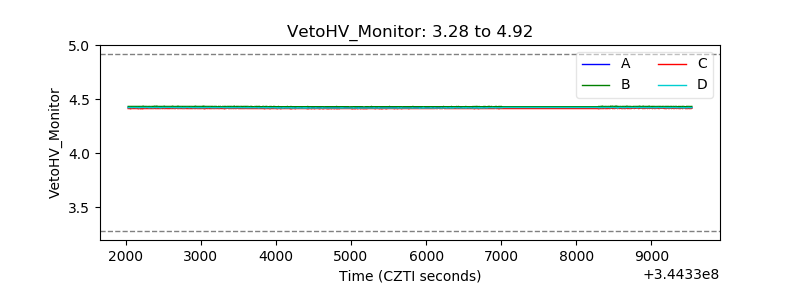 |
| Veto LLD | 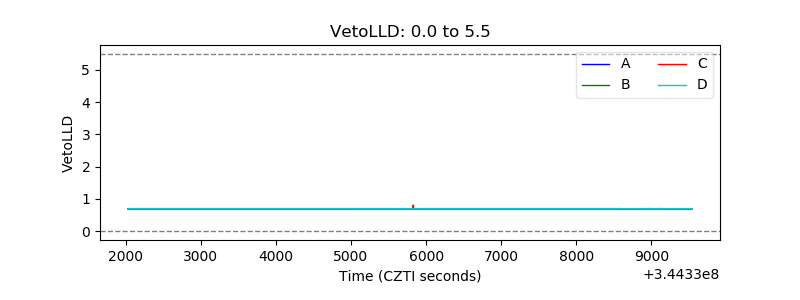 |
| Alpha Counter | 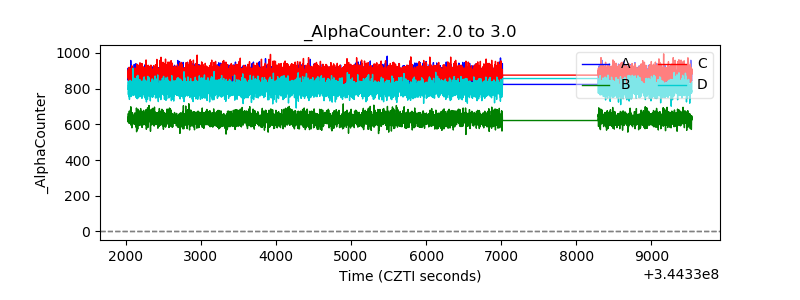 |
| _CPM_Rate | 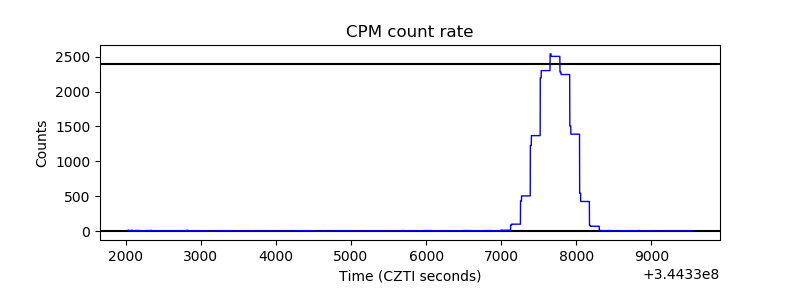 |
| CZT Counter | 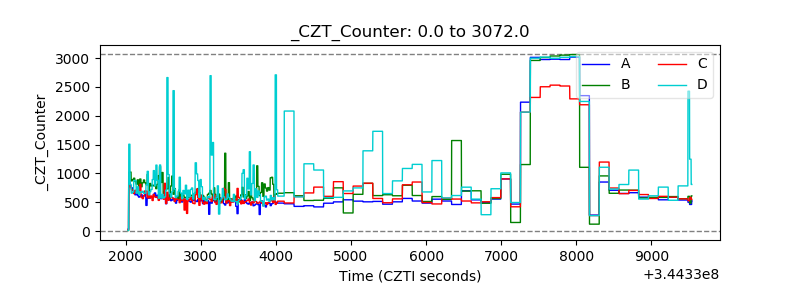 |
| +2.5 Volts monitor |  |
| +5 Volts monitor |  |
| _ROLL_ROT | 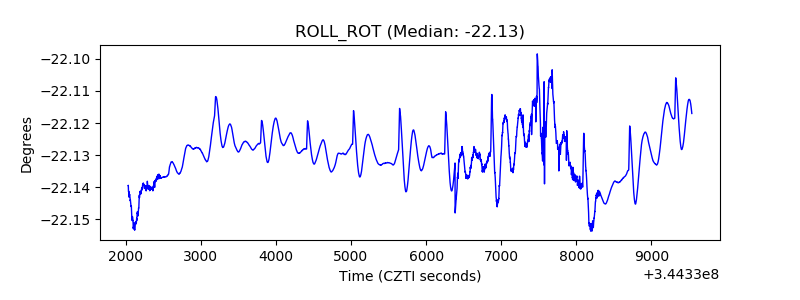 |
| _Roll_DEC | 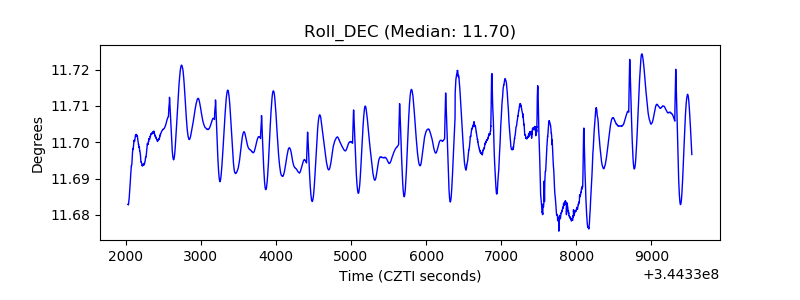 |
| _Roll_RA | 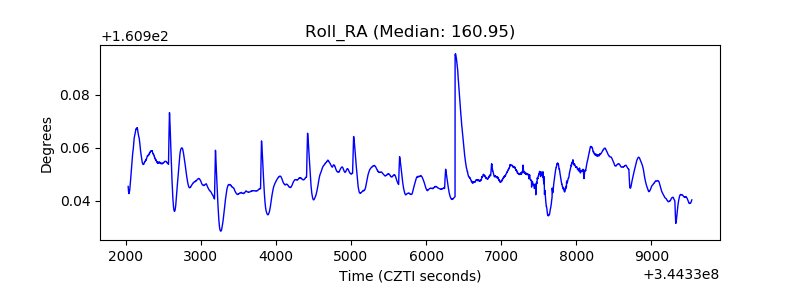 |
| Veto Counter | 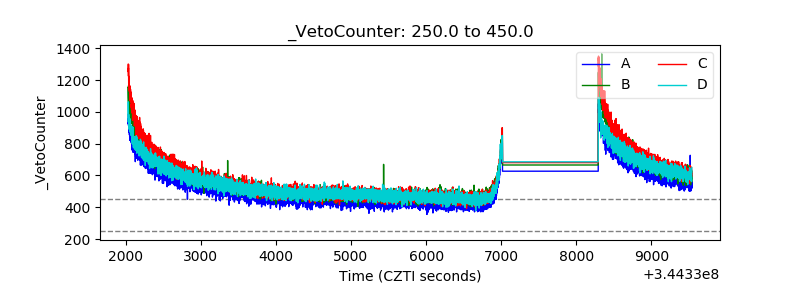 |