| Param | Original file | Final file |
|---|---|---|
| Filename | modeM0/AS1A10_021T03_9000004038_27965cztM0_level2.evt | modeM0/AS1A10_021T03_9000004038_27965cztM0_level2_quad_clean.evt |
| Size (bytes) | 607,680,000 | 87,851,520 |
| Size | 579.5 MB | 83.8 MB |
| Events in quadrant A | 3,422,111 | 573,889 |
| Events in quadrant B | 3,564,914 | 581,642 |
| Events in quadrant C | 3,507,944 | 560,010 |
| Events in quadrant D | 7,497,892 | 520,572 |
| Mode M0 | |||
|---|---|---|---|
| Quadrant | BADHDUFLAG | Total packets | Discarded packets |
| A | 0 | 13747 | 0 |
| B | 0 | 14351 | 0 |
| C | 0 | 14158 | 0 |
| D | 0 | 26672 | 0 |
| Mode M9 | |||
|---|---|---|---|
| Quadrant | BADHDUFLAG | Total packets | Discarded packets |
| A | 0 | 13 | 0 |
| B | 0 | 13 | 0 |
| C | 0 | 13 | 0 |
| D | 0 | 13 | 0 |
| Quadrant | Total seconds | Saturated seconds | Saturation percentage |
|---|---|---|---|
| A | 6074 | 99 | 1.629898% |
| B | 6074 | 108 | 1.778070% |
| C | 6074 | 133 | 2.189661% |
| D | 6074 | 1115 | 18.356931% |
Noise dominated data is calculated using 1-second bins in cleaned event files. If a bin has >2000 counts, and if more than 50% of those come from <1% of pixels, then it is considered to be noise-dominated and hence unusable.
| Quadrant | # 1 sec bins | Bins with >0 counts | Bins with >2000 counts | High rate bins dominated by noise | Noise dominated (total time) | Noise dominated (detector-on time) | Marked lightcurve |
|---|---|---|---|---|---|---|---|
| A | 7364 | 6074 | 0 | 0 | 0.00% | 0.00% | 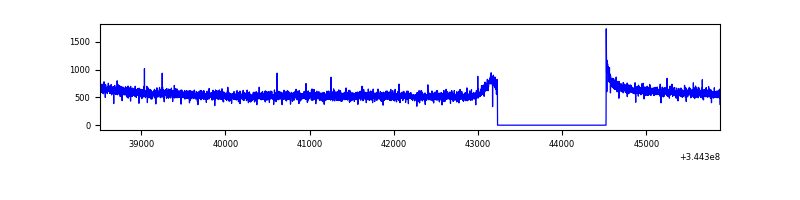 |
| B | 7364 | 6074 | 6 | 6 | 0.08% | 0.10% | 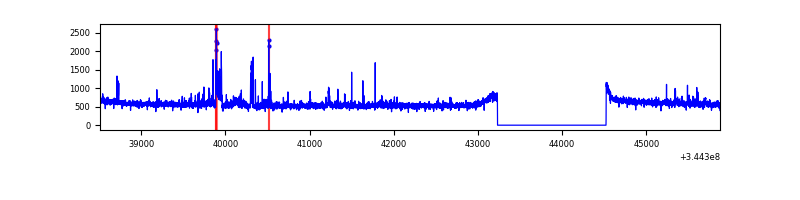 |
| C | 7364 | 6074 | 0 | 0 | 0.00% | 0.00% | 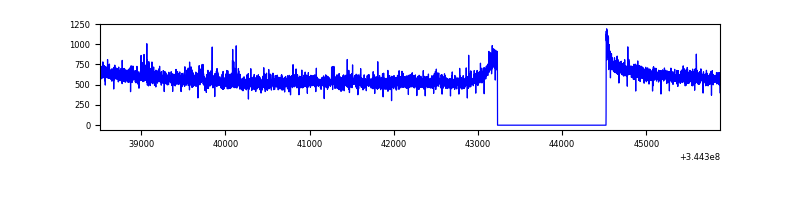 |
| D | 7364 | 6074 | 945 | 945 | 12.83% | 15.56% | 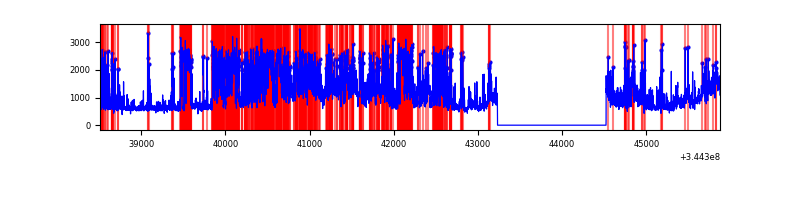 |
Top three noisy pixels from each quadrant. If the there are fewer than three noisy pixels in the level2.evt file, extra rows are filled as -1
| Pixel properties | Quadrant properties | ||||||
|---|---|---|---|---|---|---|---|
| Quadrant | DetID | PixID | Counts | Sigma | Mean | Median | Sigma |
| A | 13 | 254 | 10713 | 56.19 | 886 | 871 | 175.2 |
| A | 0 | 226 | 7759 | 39.33 | 886 | 871 | 175.2 |
| A | 3 | 137 | 7439 | 37.5 | 886 | 871 | 175.2 |
| B | 10 | 245 | 145454 | 901.99 | 864 | 846 | 160.3 |
| B | 12 | 111 | 18864 | 112.39 | 864 | 846 | 160.3 |
| B | 0 | 190 | 17524 | 104.03 | 864 | 846 | 160.3 |
| C | 14 | 238 | 137692 | 697.76 | 848 | 857 | 196.1 |
| C | 3 | 233 | 60990 | 306.64 | 848 | 857 | 196.1 |
| C | 13 | 61 | 5743 | 24.92 | 848 | 857 | 196.1 |
| D | 1 | 52 | 3206699 | 16611.55 | 810 | 791 | 193.0 |
| D | 7 | 80 | 732769 | 3792.78 | 810 | 791 | 193.0 |
| D | 2 | 250 | 276524 | 1428.72 | 810 | 791 | 193.0 |
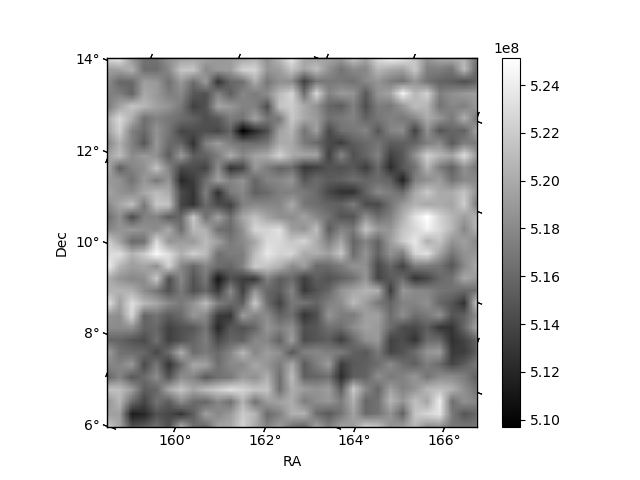
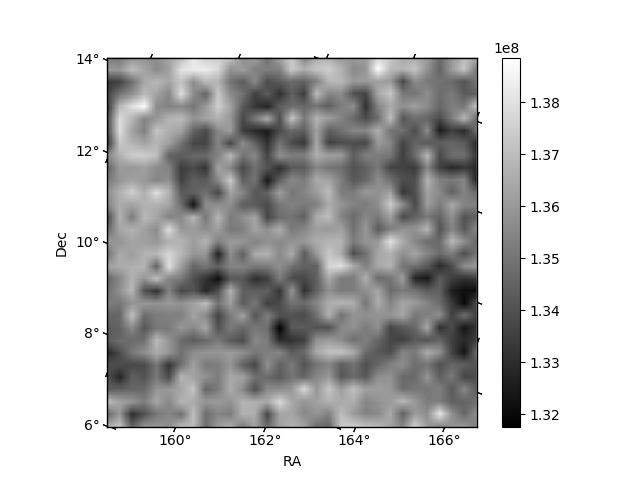
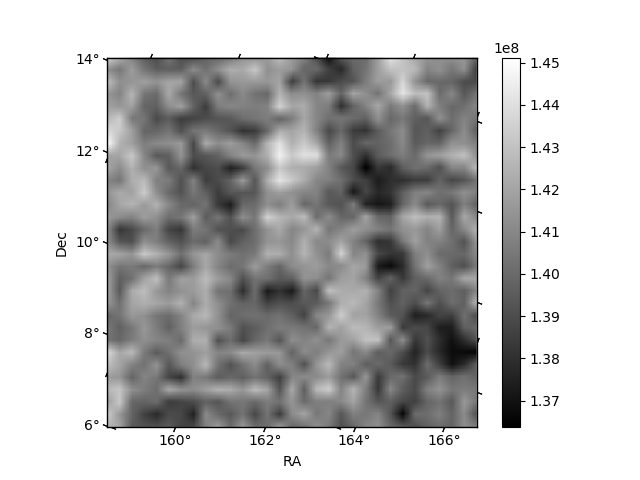
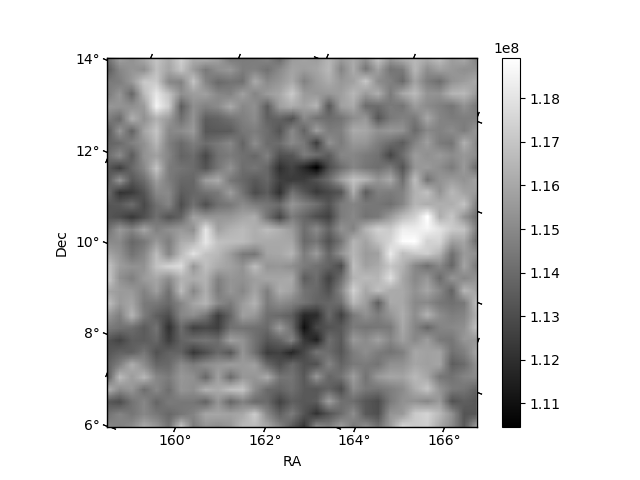
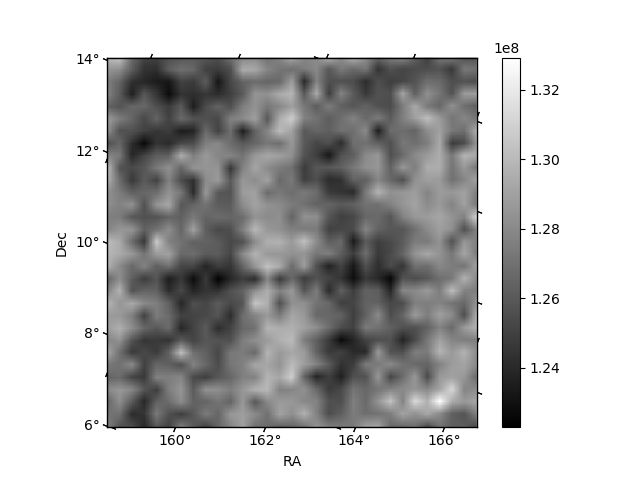
Histogram calculated using DETX and DETY for each event in the final _common_clean file
| Quadrant A | 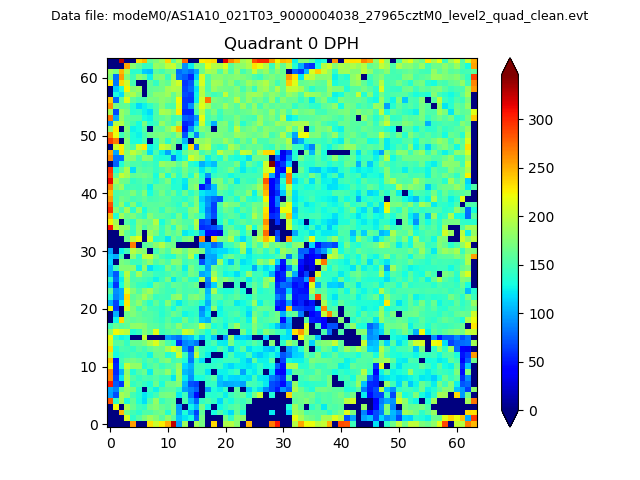 |
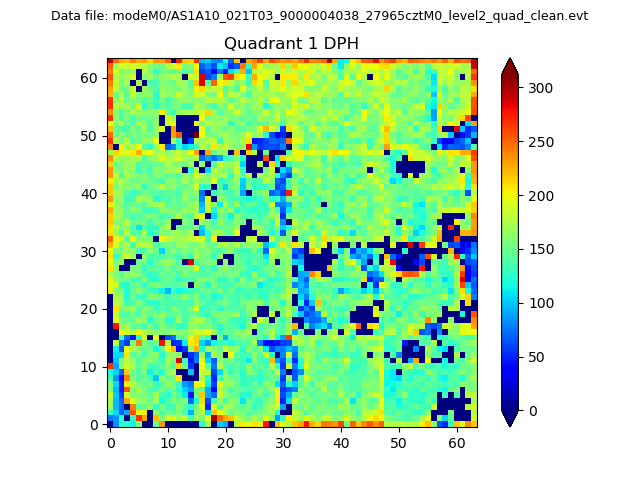 |
Quadrant B |
|---|---|---|---|
| Quadrant D |  |
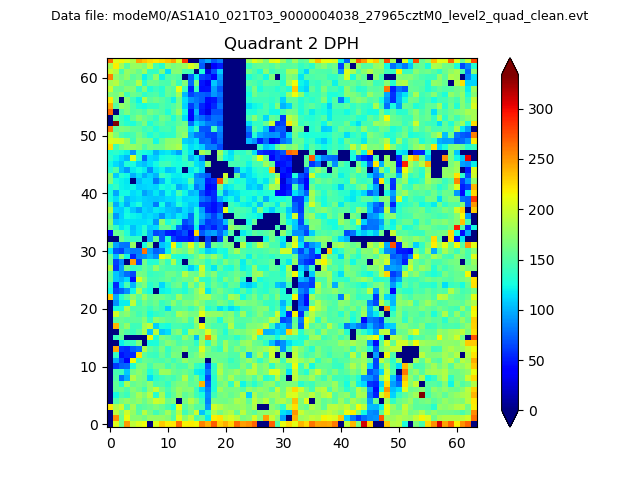 |
Quadrant C |
| Plot type | Count rate plots | Images |
|---|---|---|
| Comparison with Poisson distribution Blue bars denote a histogram of data divided into 1 sec bins. Red curve is a Poisson curve with rate = median count rate of data. |
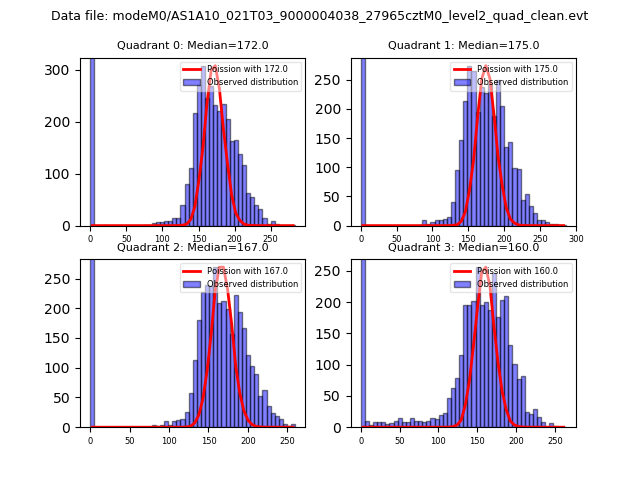 |
 |
| Quadrant-wise count rates Data is divided into 100 sec bins |
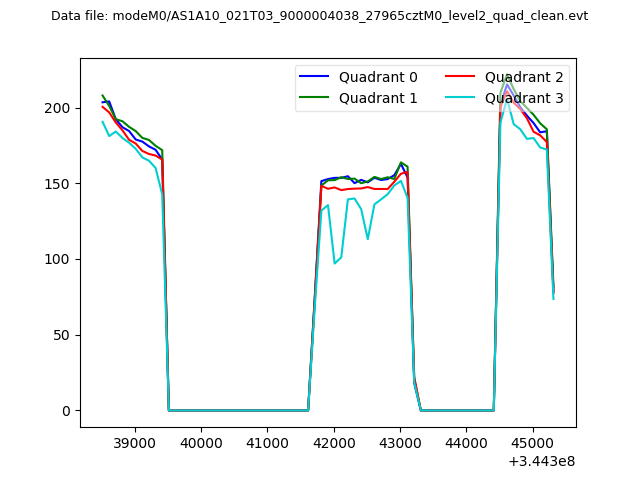 |
|
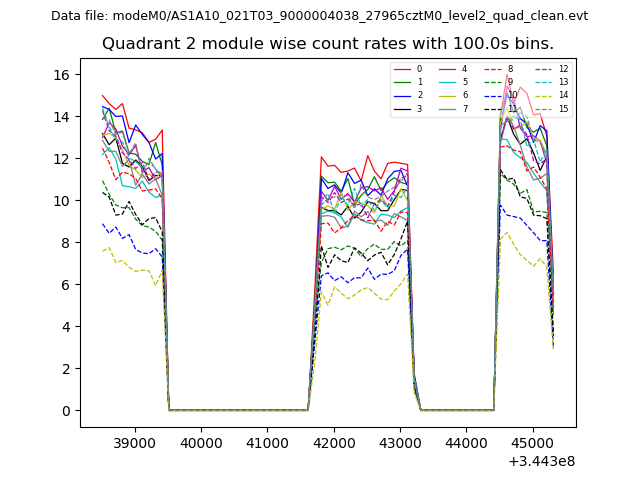
| Module-wise count rates for Quadrant A Data is divided into 100 sec bins |
 |
 |
| Module-wise count rates for Quadrant B Data is divided into 100 sec bins |
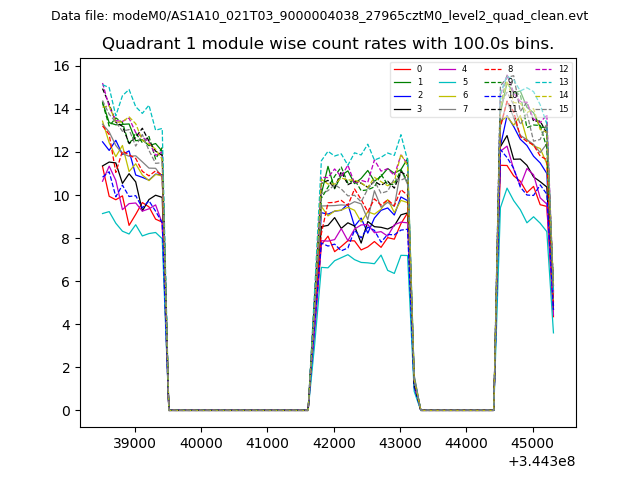 |
 |
| Module-wise count rates for Quadrant C Data is divided into 100 sec bins |
 |
 |
| Module-wise count rates for Quadrant D Data is divided into 100 sec bins |
 |
 |
| Parameter | Plot |
|---|---|
| CZT HV Monitor |  |
| D_VDD | 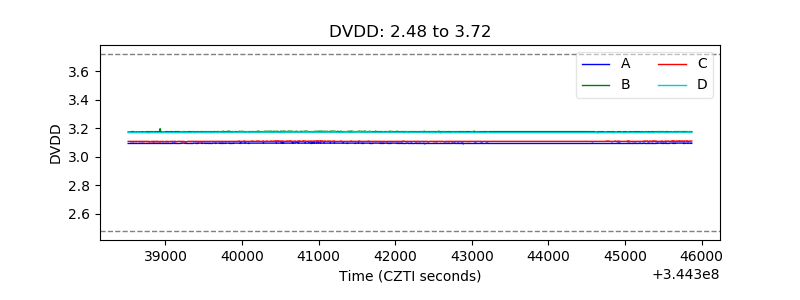 |
| Temperature 1 | 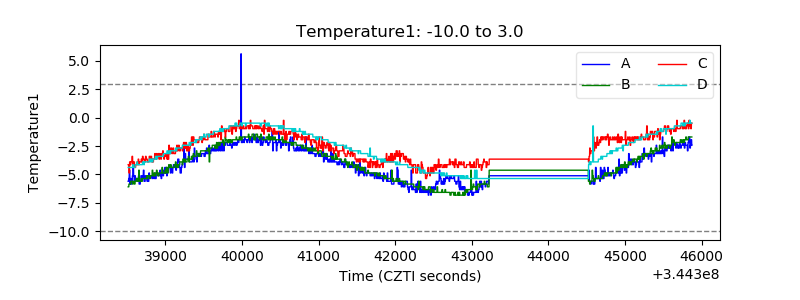 |
| Veto HV Monitor | 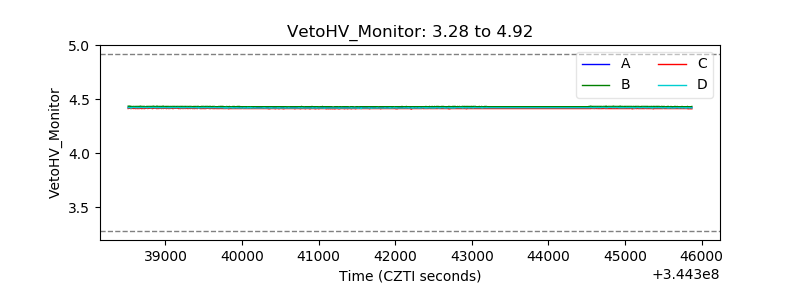 |
| Veto LLD |  |
| Alpha Counter | 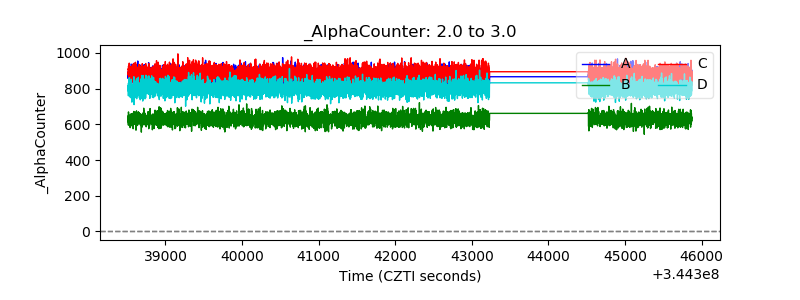 |
| _CPM_Rate | 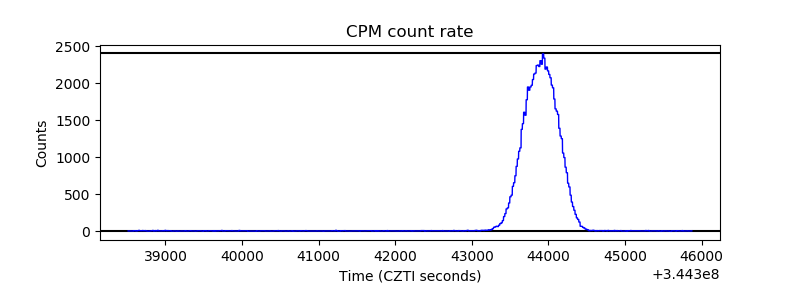 |
| CZT Counter | 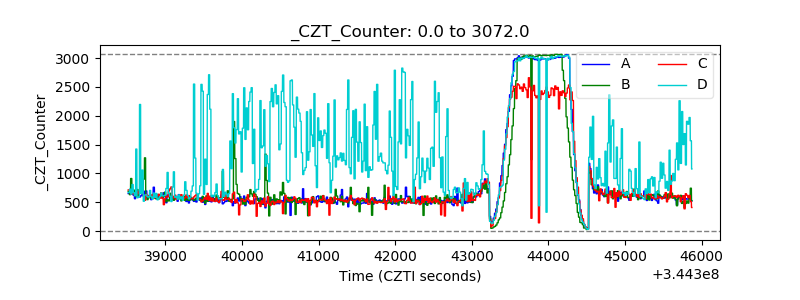 |
| +2.5 Volts monitor | 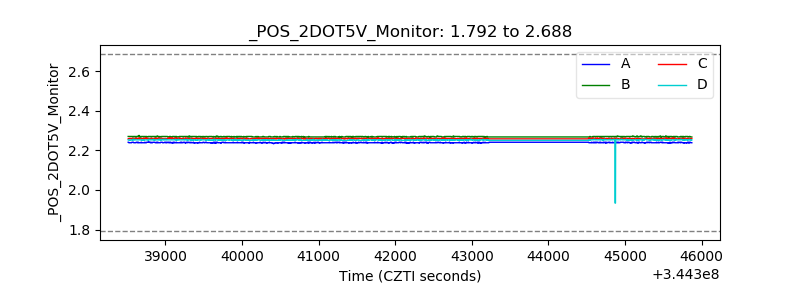 |
| +5 Volts monitor |  |
| _ROLL_ROT |  |
| _Roll_DEC | 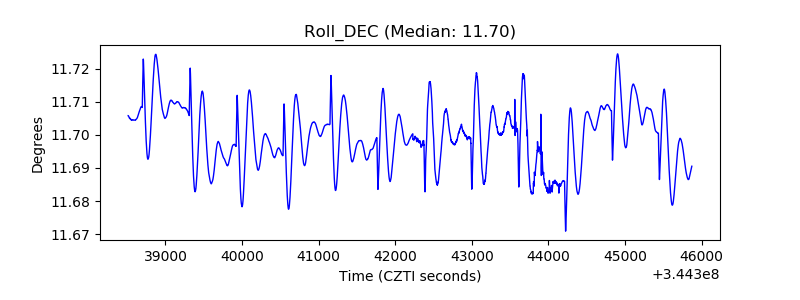 |
| _Roll_RA | 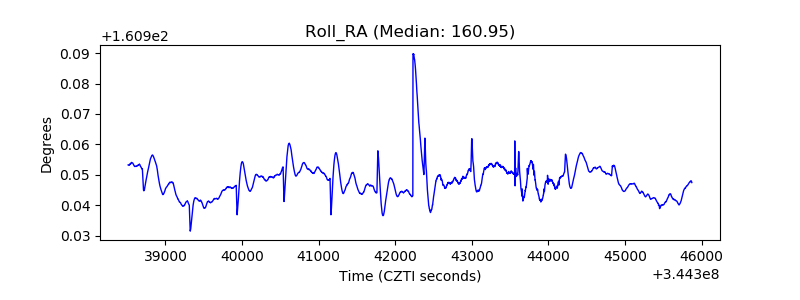 |
| Veto Counter |  |