| Param | Original file | Final file |
|---|---|---|
| Filename | modeM0/AS1A10_021T03_9000004038_27966cztM0_level2.evt | modeM0/AS1A10_021T03_9000004038_27966cztM0_level2_quad_clean.evt |
| Size (bytes) | 563,624,640 | 69,932,160 |
| Size | 537.5 MB | 66.7 MB |
| Events in quadrant A | 3,263,962 | 439,977 |
| Events in quadrant B | 3,339,802 | 441,041 |
| Events in quadrant C | 3,334,834 | 425,038 |
| Events in quadrant D | 6,732,970 | 400,423 |
| Mode M0 | |||
|---|---|---|---|
| Quadrant | BADHDUFLAG | Total packets | Discarded packets |
| A | 0 | 13095 | 0 |
| B | 0 | 13436 | 0 |
| C | 0 | 13442 | 0 |
| D | 0 | 24226 | 0 |
| Mode M9 | |||
|---|---|---|---|
| Quadrant | BADHDUFLAG | Total packets | Discarded packets |
| A | 0 | 13 | 0 |
| B | 0 | 13 | 0 |
| C | 0 | 13 | 0 |
| D | 0 | 13 | 0 |
| Quadrant | Total seconds | Saturated seconds | Saturation percentage |
|---|---|---|---|
| A | 5877 | 106 | 1.803641% |
| B | 5878 | 119 | 2.024498% |
| C | 5877 | 134 | 2.280075% |
| D | 5877 | 780 | 13.272078% |
Noise dominated data is calculated using 1-second bins in cleaned event files. If a bin has >2000 counts, and if more than 50% of those come from <1% of pixels, then it is considered to be noise-dominated and hence unusable.
| Quadrant | # 1 sec bins | Bins with >0 counts | Bins with >2000 counts | High rate bins dominated by noise | Noise dominated (total time) | Noise dominated (detector-on time) | Marked lightcurve |
|---|---|---|---|---|---|---|---|
| A | 7187 | 5877 | 1 | 1 | 0.01% | 0.02% | 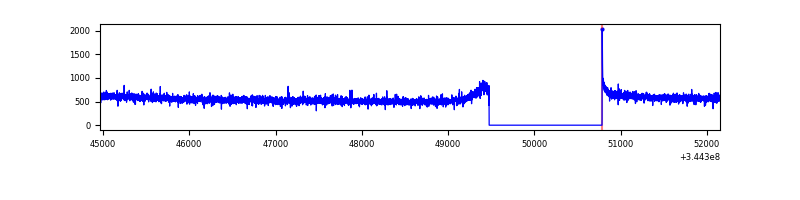 |
| B | 7188 | 5878 | 4 | 4 | 0.06% | 0.07% | 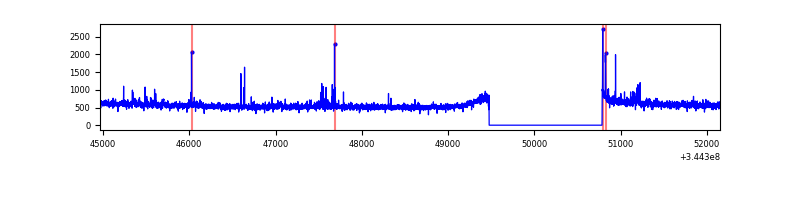 |
| C | 7187 | 5877 | 0 | 0 | 0.00% | 0.00% | 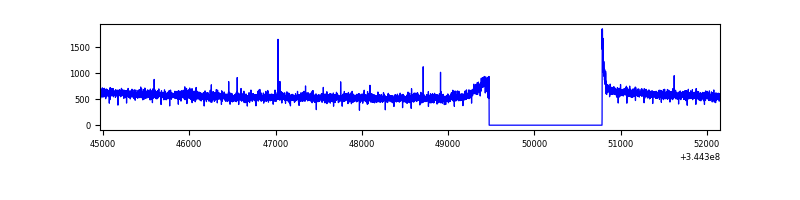 |
| D | 7187 | 5877 | 609 | 609 | 8.47% | 10.36% | 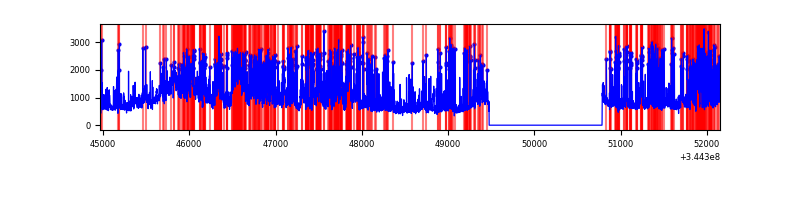 |
Top three noisy pixels from each quadrant. If the there are fewer than three noisy pixels in the level2.evt file, extra rows are filled as -1
| Pixel properties | Quadrant properties | ||||||
|---|---|---|---|---|---|---|---|
| Quadrant | DetID | PixID | Counts | Sigma | Mean | Median | Sigma |
| A | 13 | 254 | 10258 | 56.64 | 844 | 831 | 166.4 |
| A | 0 | 226 | 7514 | 40.15 | 844 | 831 | 166.4 |
| A | 3 | 137 | 7244 | 38.53 | 844 | 831 | 166.4 |
| B | 0 | 190 | 29572 | 186.96 | 825 | 808 | 153.9 |
| B | 10 | 245 | 28018 | 176.86 | 825 | 808 | 153.9 |
| B | 12 | 111 | 18109 | 112.45 | 825 | 808 | 153.9 |
| C | 14 | 238 | 132902 | 710.64 | 809 | 818 | 185.9 |
| C | 3 | 233 | 44251 | 233.68 | 809 | 818 | 185.9 |
| C | 15 | 208 | 5810 | 26.86 | 809 | 818 | 185.9 |
| D | 1 | 52 | 2079219 | 11253.75 | 788 | 772 | 184.7 |
| D | 7 | 80 | 880290 | 4762.15 | 788 | 772 | 184.7 |
| D | 8 | 195 | 291744 | 1575.47 | 788 | 772 | 184.7 |
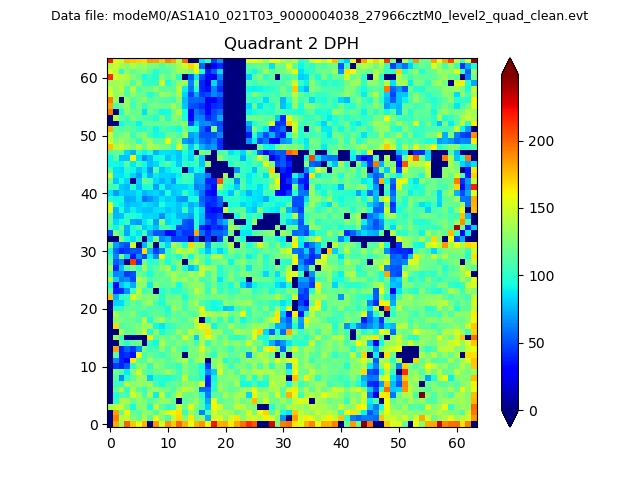
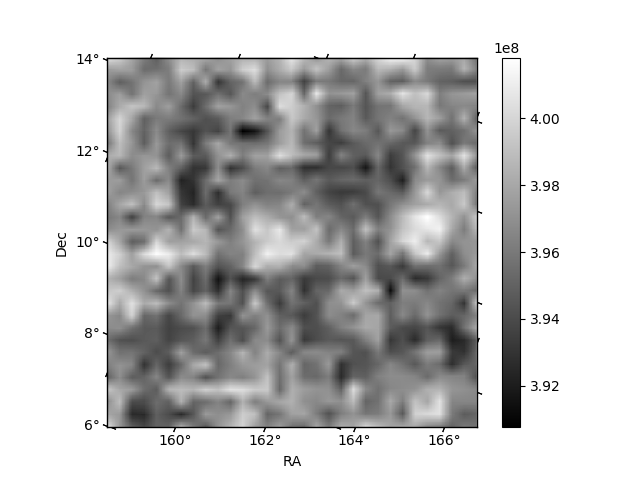
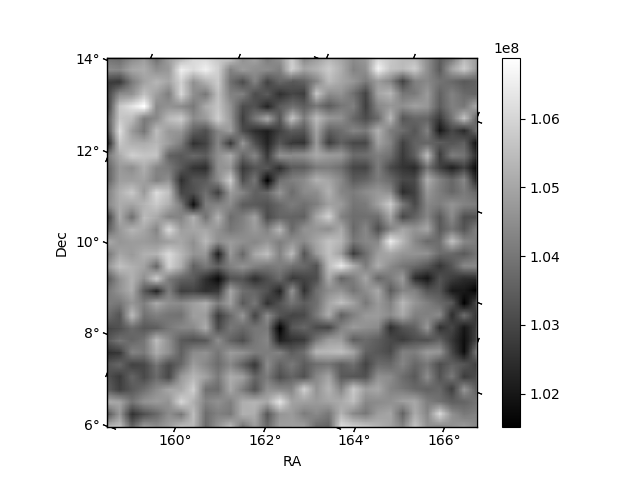
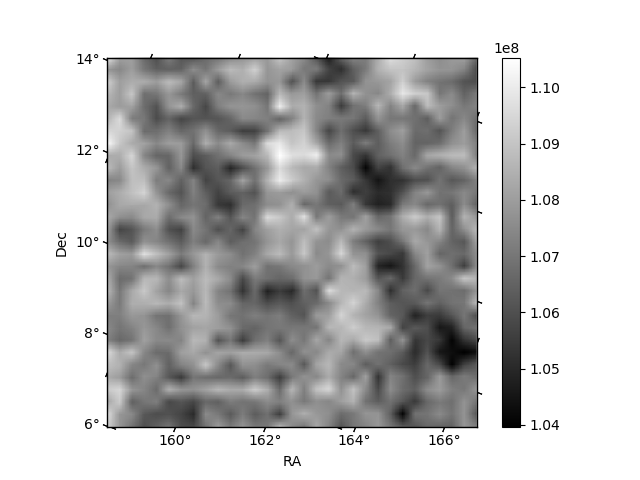
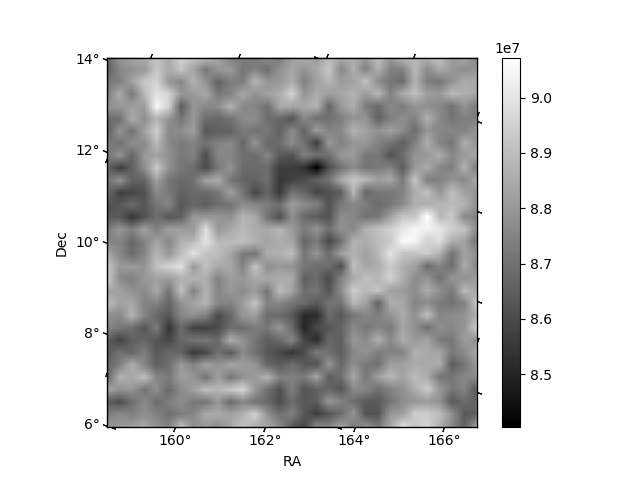
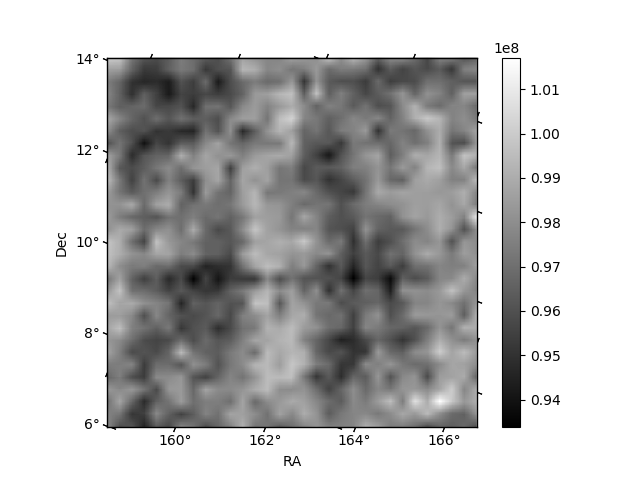
Histogram calculated using DETX and DETY for each event in the final _common_clean file
| Quadrant A | 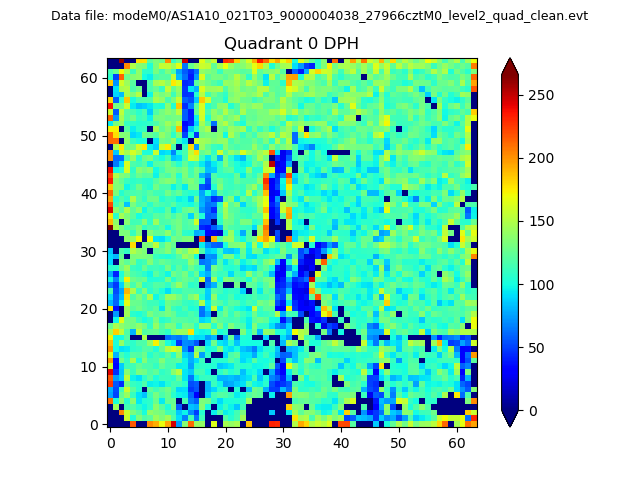 |
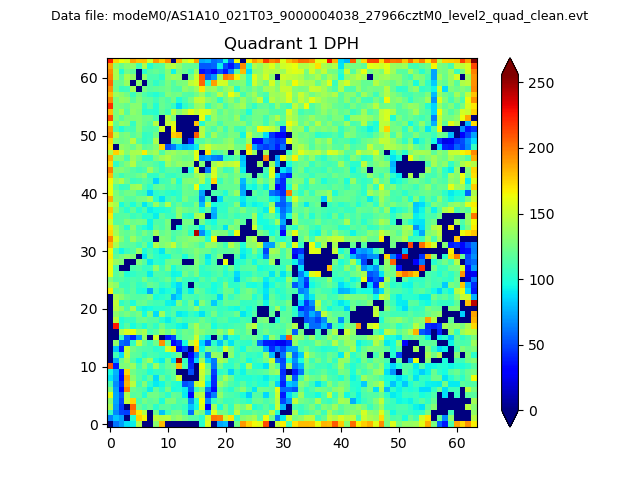 |
Quadrant B |
|---|---|---|---|
| Quadrant D | 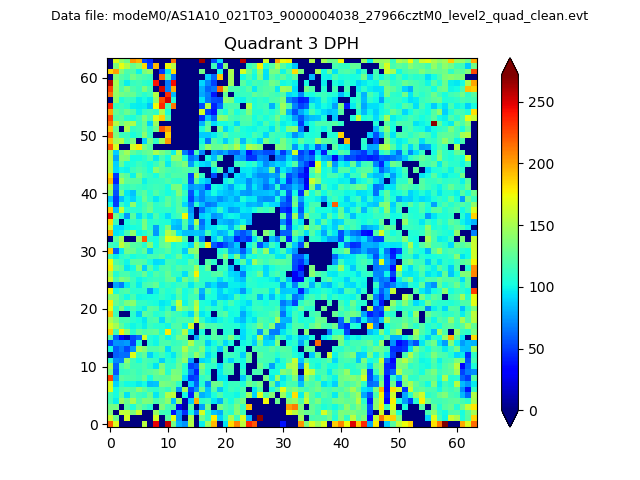 |
 |
Quadrant C |
| Plot type | Count rate plots | Images |
|---|---|---|
| Comparison with Poisson distribution Blue bars denote a histogram of data divided into 1 sec bins. Red curve is a Poisson curve with rate = median count rate of data. |
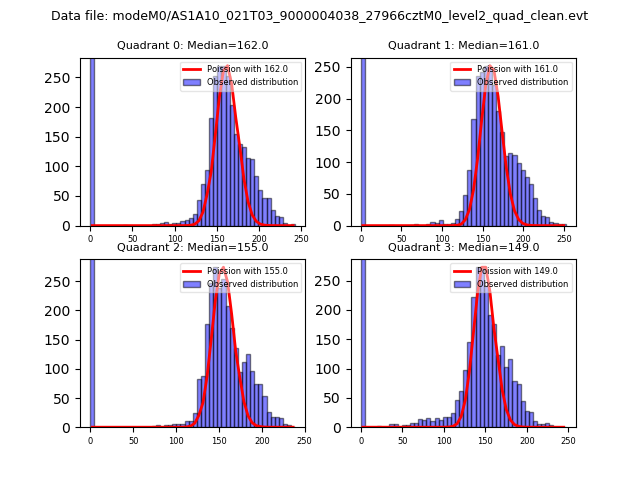 |
 |
| Quadrant-wise count rates Data is divided into 100 sec bins |
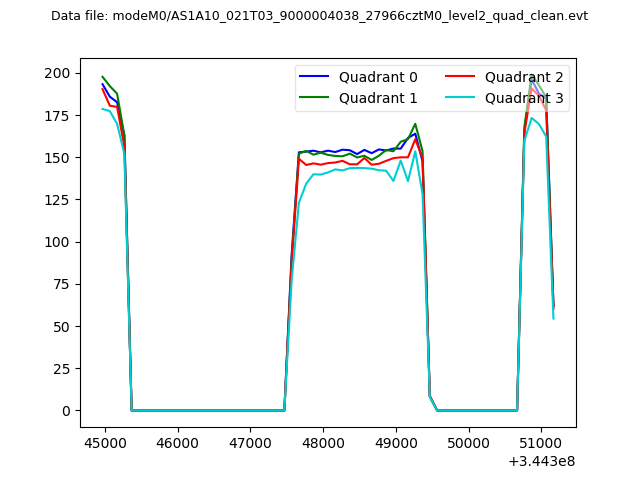 |
|
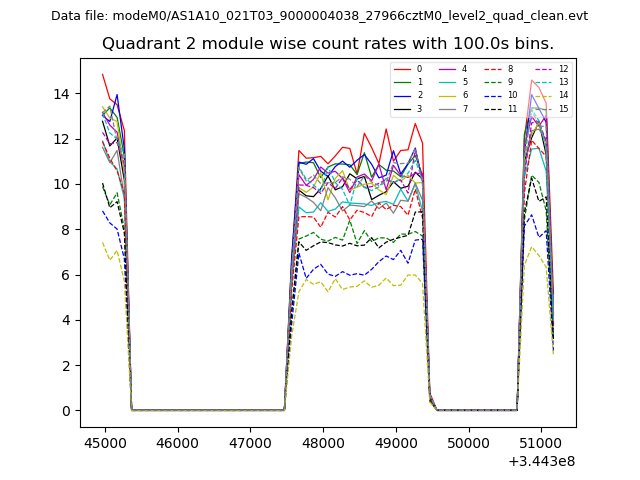
| Module-wise count rates for Quadrant A Data is divided into 100 sec bins |
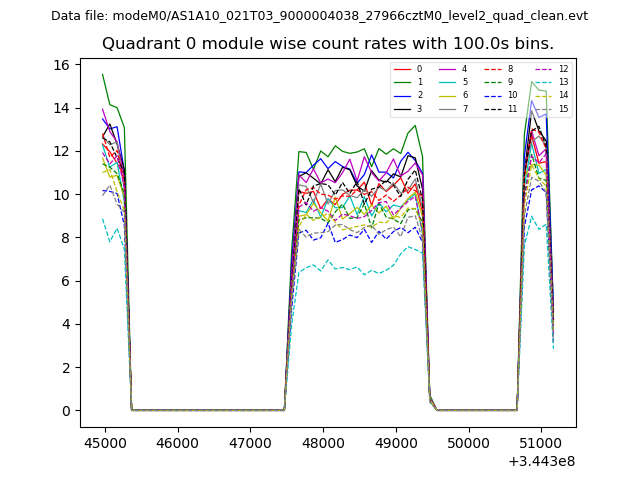 |
 |
| Module-wise count rates for Quadrant B Data is divided into 100 sec bins |
 |
 |
| Module-wise count rates for Quadrant C Data is divided into 100 sec bins |
 |
 |
| Module-wise count rates for Quadrant D Data is divided into 100 sec bins |
 |
 |
| Parameter | Plot |
|---|---|
| CZT HV Monitor | 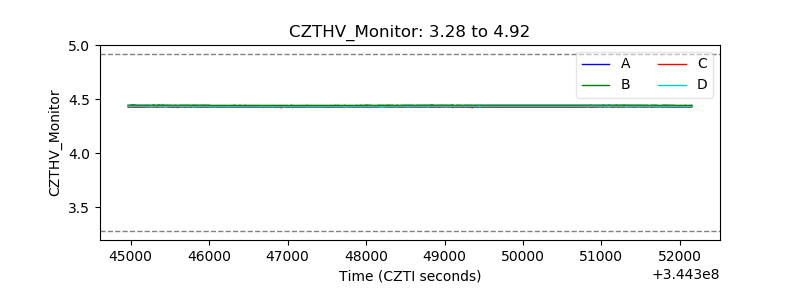 |
| D_VDD | 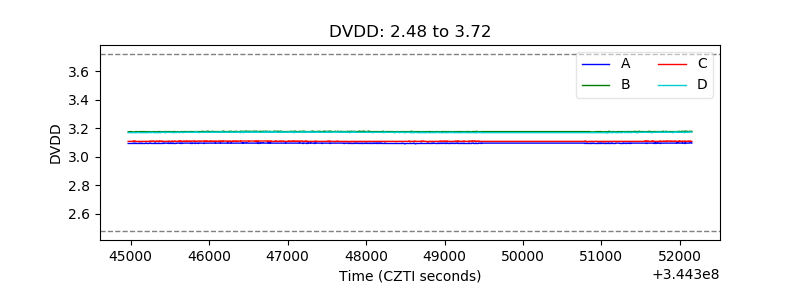 |
| Temperature 1 | 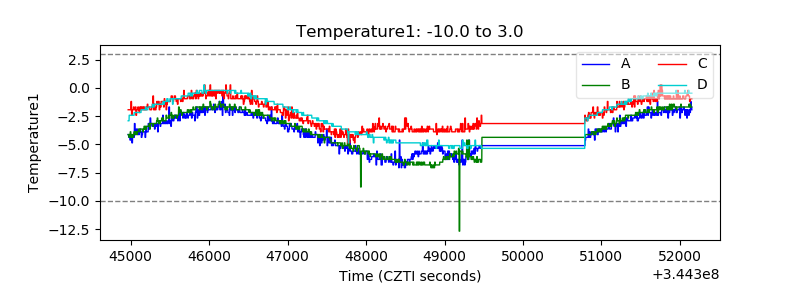 |
| Veto HV Monitor | 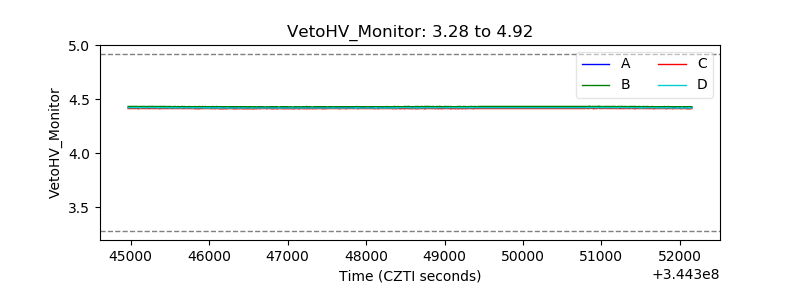 |
| Veto LLD |  |
| Alpha Counter | 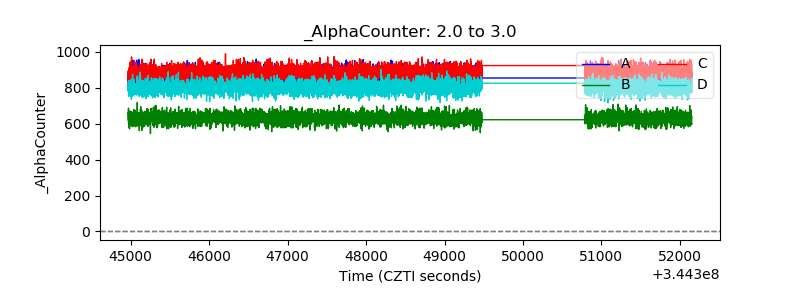 |
| _CPM_Rate | 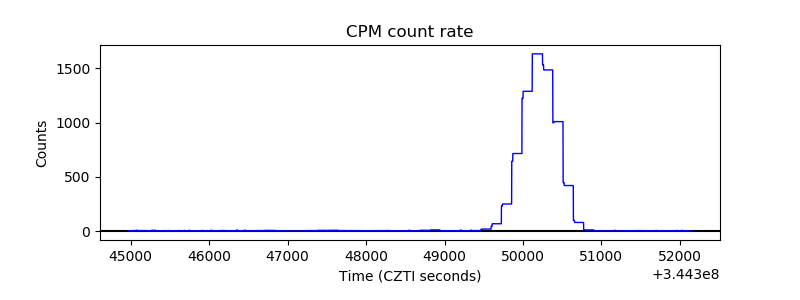 |
| CZT Counter | 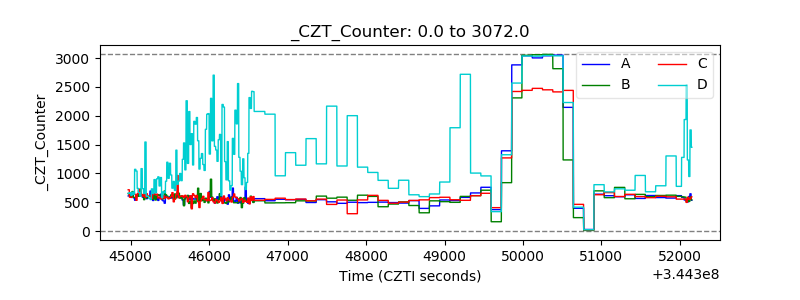 |
| +2.5 Volts monitor |  |
| +5 Volts monitor |  |
| _ROLL_ROT | 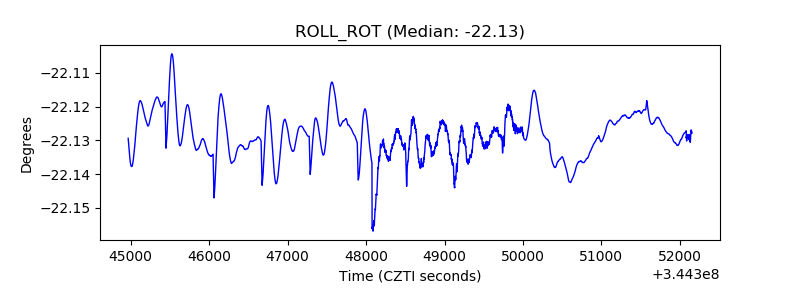 |
| _Roll_DEC | 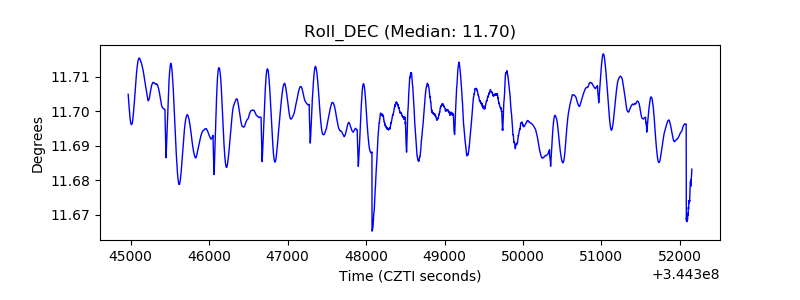 |
| _Roll_RA | 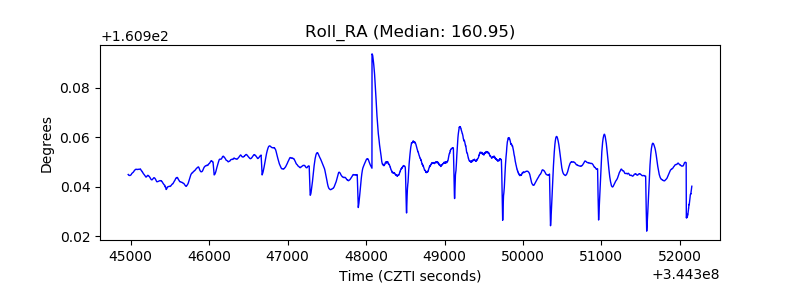 |
| Veto Counter |  |