| Param | Original file | Final file |
|---|---|---|
| Filename | modeM0/AS1A10_065T03_9000004040cztM0_level2.fits | modeM0/AS1A10_065T03_9000004040cztM0_level2_quad_clean.evt |
| Size (bytes) | 1,606,455,360 | 1,256,253,120 |
| Size | 1.5 GB | 1.2 GB |
| Events in quadrant A | 10,107,666 | 7,350,300 |
| Events in quadrant B | 9,717,392 | 7,182,515 |
| Events in quadrant C | 9,769,988 | 6,642,780 |
| Events in quadrant D | 8,460,000 | 6,271,530 |
| Mode SS | |||
|---|---|---|---|
| Quadrant | BADHDUFLAG | Total packets | Discarded packets |
| A | 0 | 3154 | 0 |
| B | 0 | 3156 | 0 |
| C | 0 | 3154 | 0 |
| D | 0 | 3154 | 0 |
| Mode M9 | |||
|---|---|---|---|
| Quadrant | BADHDUFLAG | Total packets | Discarded packets |
| A | 0 | 239 | 0 |
| B | 0 | 239 | 0 |
| C | 0 | 239 | 0 |
| D | 0 | 239 | 0 |
| Mode M0 | |||
|---|---|---|---|
| Quadrant | BADHDUFLAG | Total packets | Discarded packets |
| A | 0 | 332122 | 0 |
| B | 0 | 333943 | 0 |
| C | 0 | 345669 | 0 |
| D | 0 | 443072 | 0 |
| Quadrant | Total seconds | Saturated seconds | Saturation percentage |
|---|---|---|---|
| A | 154632 | 2301 | 1.488049% |
| B | 154631 | 2516 | 1.627099% |
| C | 154632 | 3794 | 2.453567% |
| D | 154631 | 7092 | 4.586402% |
Noise dominated data is calculated using 1-second bins in cleaned event files. If a bin has >2000 counts, and if more than 50% of those come from <1% of pixels, then it is considered to be noise-dominated and hence unusable.
| Quadrant | # 1 sec bins | Bins with >0 counts | Bins with >2000 counts | High rate bins dominated by noise | Noise dominated (total time) | Noise dominated (detector-on time) | Marked lightcurve |
|---|---|---|---|---|---|---|---|
| A | 178961 | 154630 | 0 | 0 | 0.00% | 0.00% |  |
| B | 178962 | 154622 | 0 | 0 | 0.00% | 0.00% |  |
| C | 178962 | 154626 | 0 | 0 | 0.00% | 0.00% |  |
| D | 178962 | 154326 | 0 | 0 | 0.00% | 0.00% |  |
Top three noisy pixels from each quadrant. If the there are fewer than three noisy pixels in the level2.evt file, extra rows are filled as -1
| Pixel properties | Quadrant properties | ||||||
|---|---|---|---|---|---|---|---|
| Quadrant | DetID | PixID | Counts | Sigma | Mean | Median | Sigma |
| A | 0 | 29 | 8088 | 8.88 | 2633 | 2480 | 631.4 |
| A | 7 | 110 | 8046 | 8.81 | 2633 | 2480 | 631.4 |
| A | 9 | 19 | 7549 | 8.03 | 2633 | 2480 | 631.4 |
| B | 2 | 9 | 7549 | 10.18 | 2567 | 2449 | 500.8 |
| B | 5 | 128 | 6350 | 7.79 | 2567 | 2449 | 500.8 |
| B | 2 | 8 | 6266 | 7.62 | 2567 | 2449 | 500.8 |
| C | 1 | 81 | 7353 | 7.61 | 2582 | 2425 | 647.2 |
| C | 1 | 80 | 7342 | 7.6 | 2582 | 2425 | 647.2 |
| C | 9 | 209 | 6781 | 6.73 | 2582 | 2425 | 647.2 |
| D | 7 | 3 | 5949 | 5.91 | 2417 | 2205 | 633.1 |
| D | 6 | 67 | 5821 | 5.71 | 2417 | 2205 | 633.1 |
| D | 6 | 231 | 5810 | 5.69 | 2417 | 2205 | 633.1 |
Histogram calculated using DETX and DETY for each event in the final _common_clean file
| Quadrant A |  |
 |
Quadrant B |
|---|---|---|---|
| Quadrant D |  |
 |
Quadrant C |
| Plot type | Count rate plots | Images |
|---|---|---|
| Comparison with Poisson distribution Blue bars denote a histogram of data divided into 1 sec bins. Red curve is a Poisson curve with rate = median count rate of data. |
 |
 |
| Quadrant-wise count rates Data is divided into 100 sec bins |
 |
|
| Module-wise count rates for Quadrant A Data is divided into 100 sec bins |
 |
 |
| Module-wise count rates for Quadrant B Data is divided into 100 sec bins |
 |
 |
| Module-wise count rates for Quadrant C Data is divided into 100 sec bins |
 |
 |
| Module-wise count rates for Quadrant D Data is divided into 100 sec bins |
 |
 |
| Parameter | Plot |
|---|---|
| CZT HV Monitor |  |
| D_VDD | 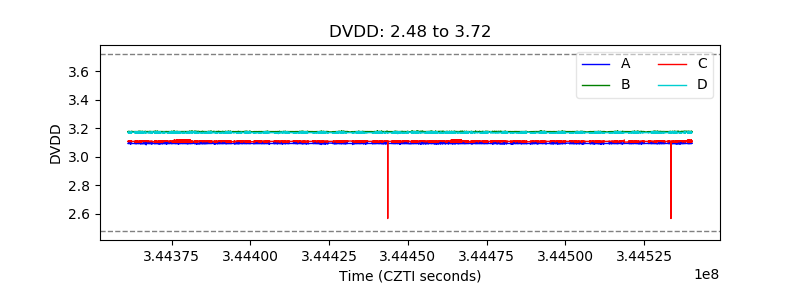 |
| Temperature 1 |  |
| Veto HV Monitor |  |
| Veto LLD |  |
| Alpha Counter |  |
| _CPM_Rate |  |
| CZT Counter |  |
| +2.5 Volts monitor |  |
| +5 Volts monitor |  |
| _ROLL_ROT |  |
| _Roll_DEC |  |
| _Roll_RA |  |
| Veto Counter |  |