| Param | Original file | Final file |
|---|---|---|
| Filename | modeM0/AS1A10_065T03_9000004040_27968cztM0_level2.evt | modeM0/AS1A10_065T03_9000004040_27968cztM0_level2_quad_clean.evt |
| Size (bytes) | 260,251,200 | 29,655,360 |
| Size | 248.2 MB | 28.3 MB |
| Events in quadrant A | 1,425,641 | 184,759 |
| Events in quadrant B | 1,432,337 | 185,209 |
| Events in quadrant C | 1,446,820 | 177,129 |
| Events in quadrant D | 3,397,746 | 163,055 |
| Mode M9 | |||
|---|---|---|---|
| Quadrant | BADHDUFLAG | Total packets | Discarded packets |
| A | 0 | 8 | 0 |
| B | 0 | 8 | 0 |
| C | 0 | 8 | 0 |
| D | 0 | 8 | 0 |
| Mode M0 | |||
|---|---|---|---|
| Quadrant | BADHDUFLAG | Total packets | Discarded packets |
| A | 0 | 5699 | 0 |
| B | 0 | 5727 | 0 |
| C | 0 | 5838 | 0 |
| D | 0 | 11844 | 0 |
| Quadrant | Total seconds | Saturated seconds | Saturation percentage |
|---|---|---|---|
| A | 2611 | 112 | 4.289544% |
| B | 2611 | 126 | 4.825737% |
| C | 2611 | 137 | 5.247032% |
| D | 2611 | 968 | 37.073918% |
Noise dominated data is calculated using 1-second bins in cleaned event files. If a bin has >2000 counts, and if more than 50% of those come from <1% of pixels, then it is considered to be noise-dominated and hence unusable.
| Quadrant | # 1 sec bins | Bins with >0 counts | Bins with >2000 counts | High rate bins dominated by noise | Noise dominated (total time) | Noise dominated (detector-on time) | Marked lightcurve |
|---|---|---|---|---|---|---|---|
| A | 3416 | 2611 | 0 | 0 | 0.00% | 0.00% | 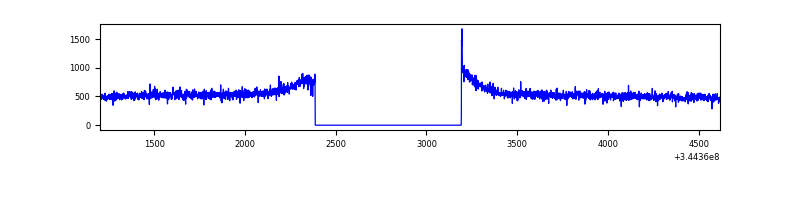 |
| B | 3416 | 2611 | 1 | 1 | 0.03% | 0.04% | 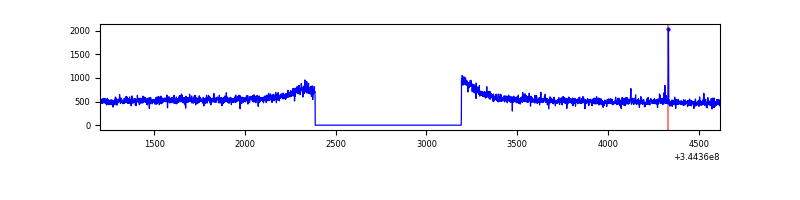 |
| C | 3416 | 2611 | 0 | 0 | 0.00% | 0.00% | 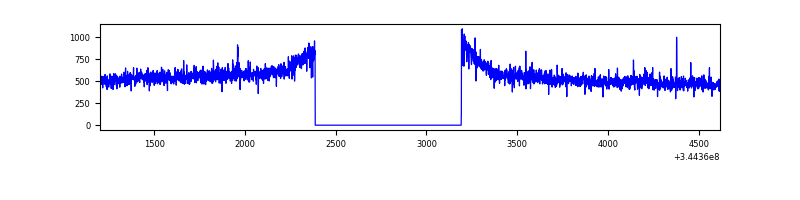 |
| D | 3416 | 2611 | 716 | 716 | 20.96% | 27.42% | 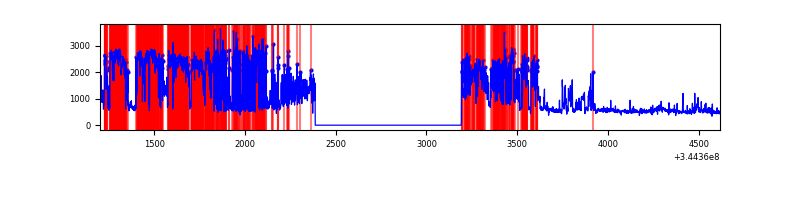 |
Top three noisy pixels from each quadrant. If the there are fewer than three noisy pixels in the level2.evt file, extra rows are filled as -1
| Pixel properties | Quadrant properties | ||||||
|---|---|---|---|---|---|---|---|
| Quadrant | DetID | PixID | Counts | Sigma | Mean | Median | Sigma |
| A | 8 | 192 | 3976 | 48.02 | 368 | 360 | 75.3 |
| A | 13 | 254 | 3962 | 47.83 | 368 | 360 | 75.3 |
| A | 3 | 137 | 3749 | 45.0 | 368 | 360 | 75.3 |
| B | 12 | 111 | 9044 | 118.38 | 362 | 352 | 73.4 |
| B | 11 | 111 | 8356 | 109.01 | 362 | 352 | 73.4 |
| B | 14 | 111 | 7751 | 100.77 | 362 | 352 | 73.4 |
| C | 14 | 238 | 54861 | 642.98 | 352 | 353 | 84.8 |
| C | 3 | 233 | 18809 | 217.71 | 352 | 353 | 84.8 |
| C | 13 | 61 | 2391 | 24.04 | 352 | 353 | 84.8 |
| D | 1 | 52 | 2159045 | 31282.87 | 281 | 273 | 69.0 |
| D | 8 | 195 | 97696 | 1411.76 | 281 | 273 | 69.0 |
| D | 7 | 80 | 70716 | 1020.79 | 281 | 273 | 69.0 |
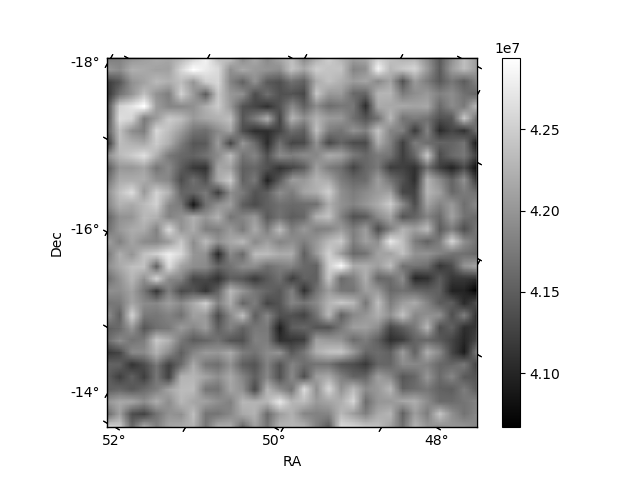
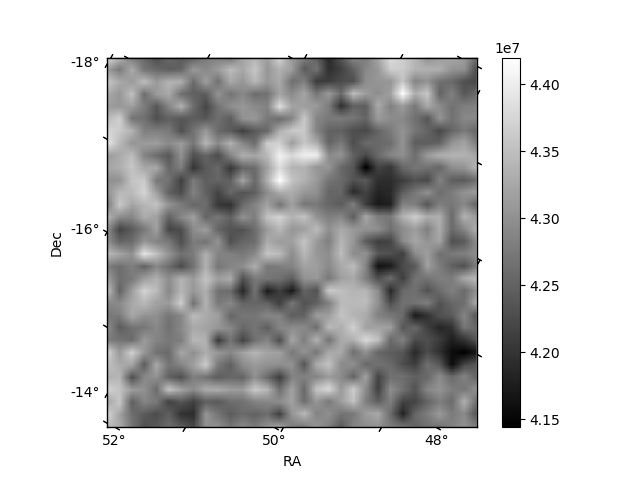
Histogram calculated using DETX and DETY for each event in the final _common_clean file
| Quadrant A |  |
 |
Quadrant B |
|---|---|---|---|
| Quadrant D |  |
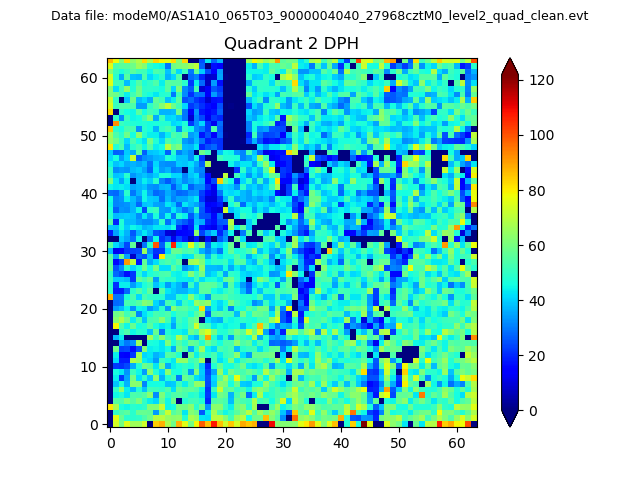 |
Quadrant C |
| Plot type | Count rate plots | Images |
|---|---|---|
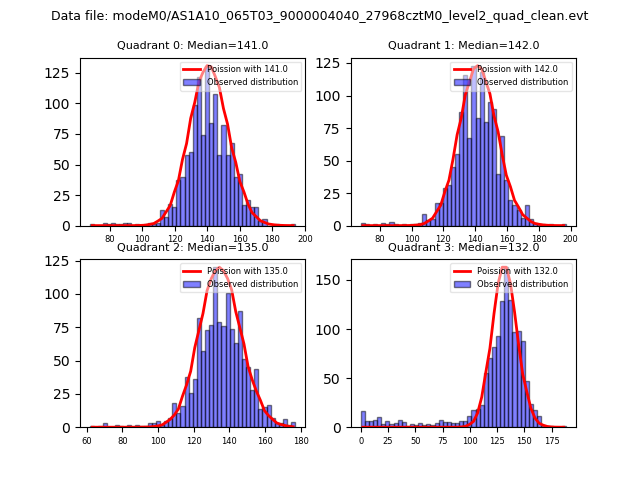
| Comparison with Poisson distribution Blue bars denote a histogram of data divided into 1 sec bins. Red curve is a Poisson curve with rate = median count rate of data. |
 |
 |
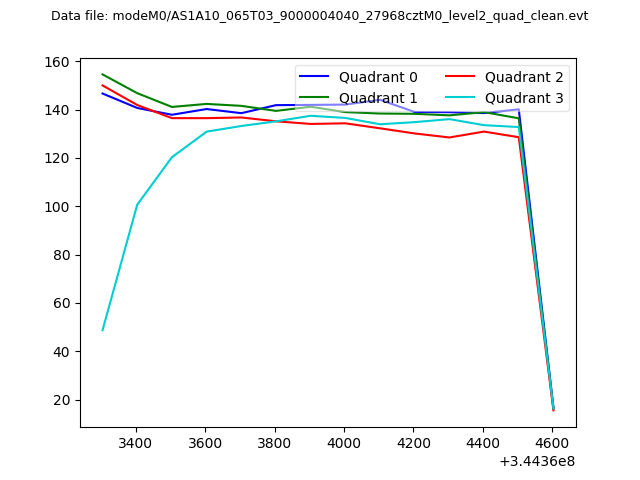
| Quadrant-wise count rates Data is divided into 100 sec bins |
 |
|
| Module-wise count rates for Quadrant A Data is divided into 100 sec bins |
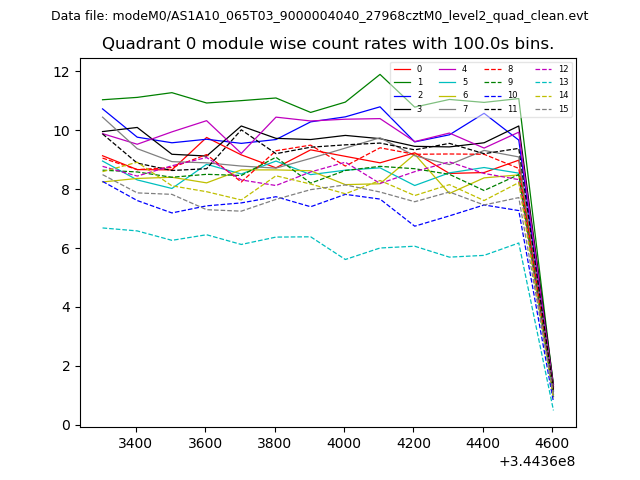 |
 |
| Module-wise count rates for Quadrant B Data is divided into 100 sec bins |
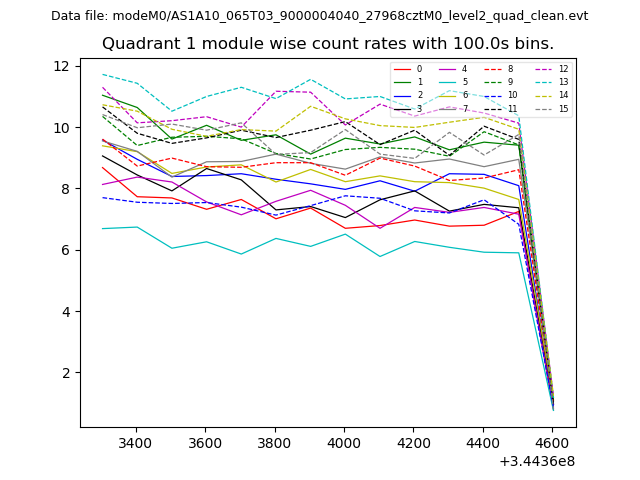 |
 |
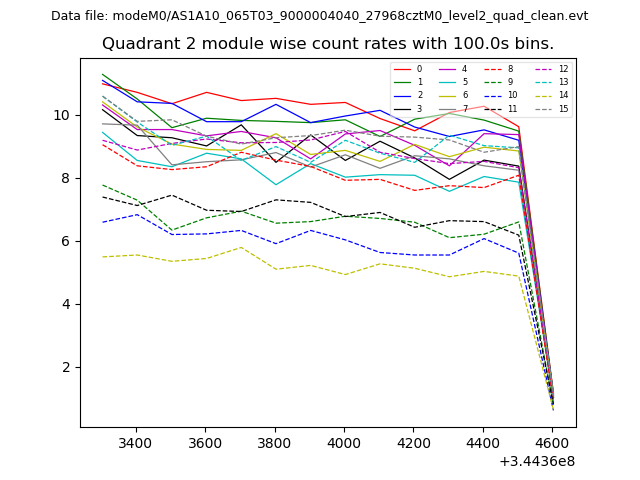
| Module-wise count rates for Quadrant C Data is divided into 100 sec bins |
 |
 |
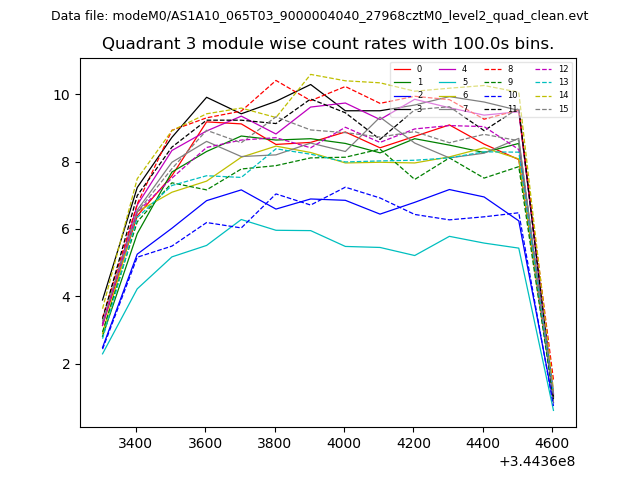
| Module-wise count rates for Quadrant D Data is divided into 100 sec bins |
 |
 |
| Parameter | Plot |
|---|---|
| CZT HV Monitor | 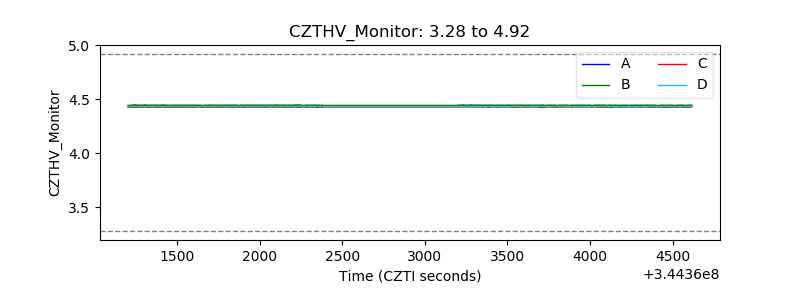 |
| D_VDD | 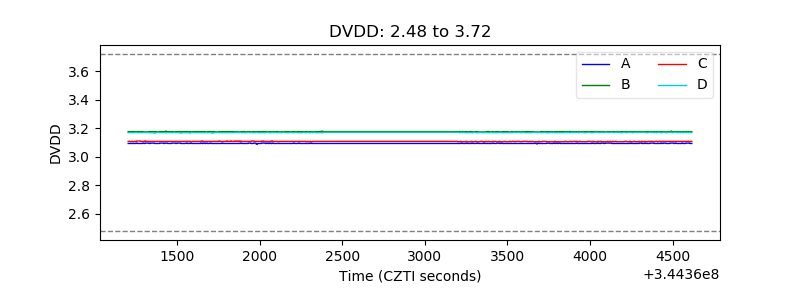 |
| Temperature 1 | 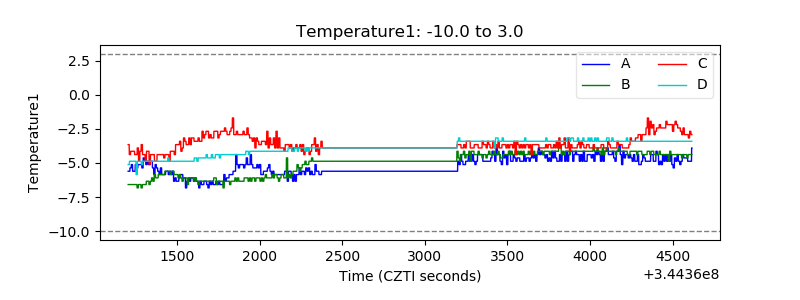 |
| Veto HV Monitor | 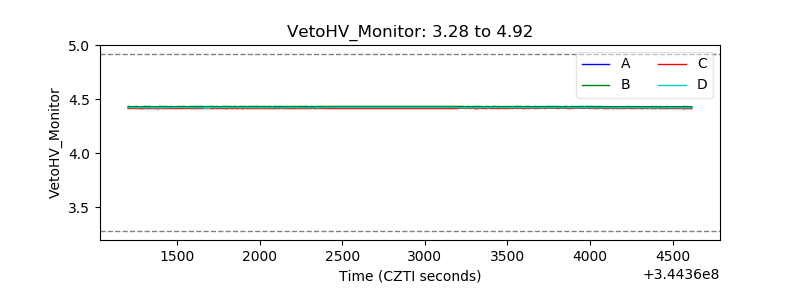 |
| Veto LLD | 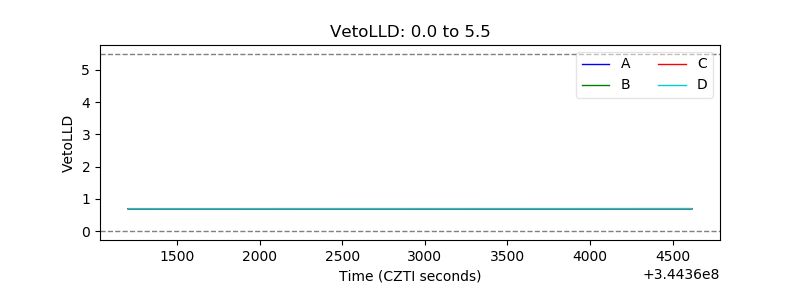 |
| Alpha Counter | 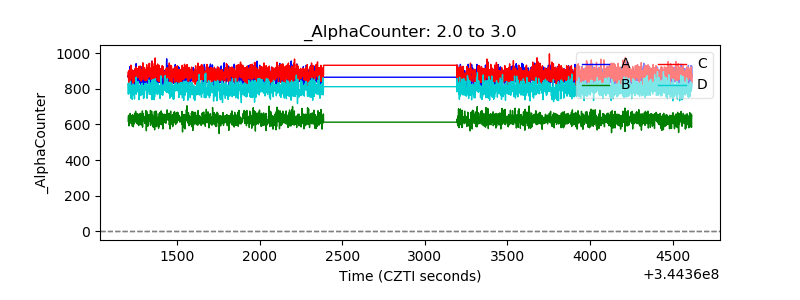 |
| _CPM_Rate | 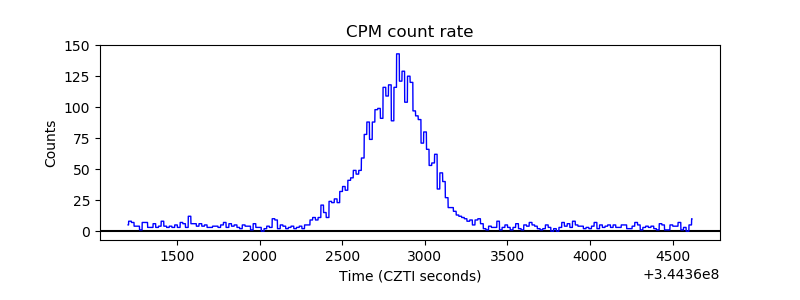 |
| CZT Counter | 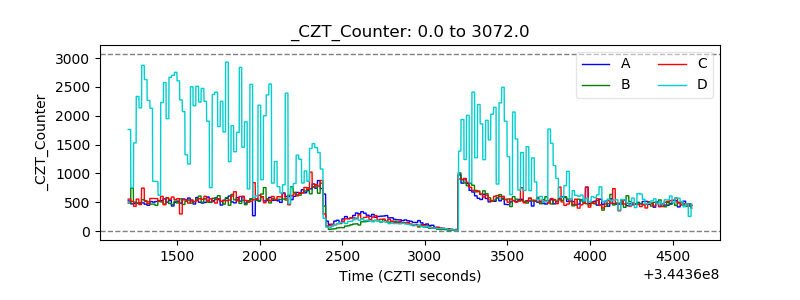 |
| +2.5 Volts monitor |  |
| +5 Volts monitor | 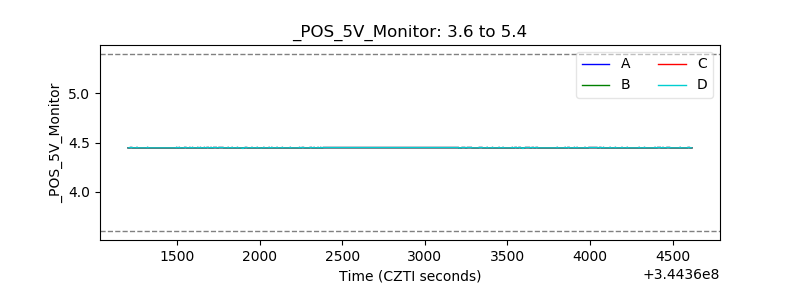 |
| _ROLL_ROT | 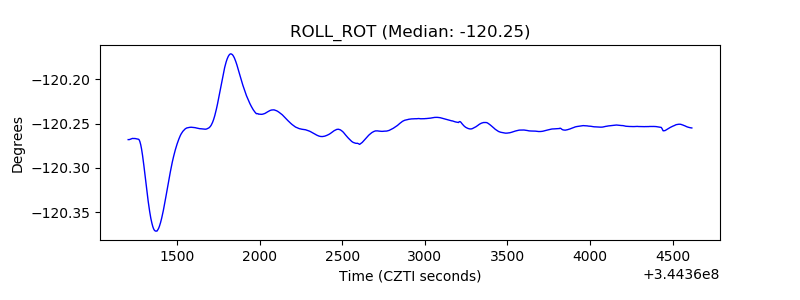 |
| _Roll_DEC | 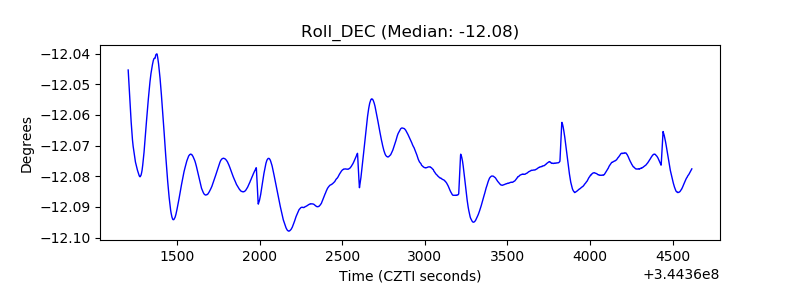 |
| _Roll_RA | 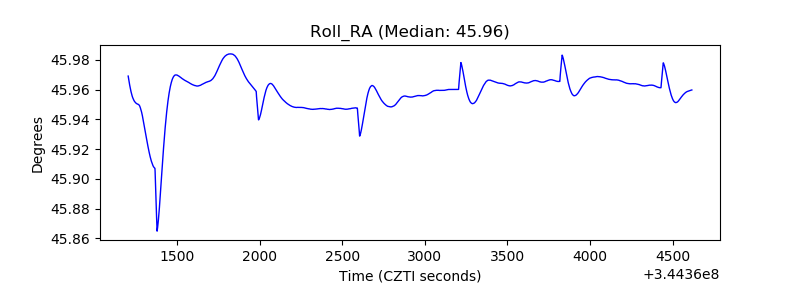 |
| Veto Counter | 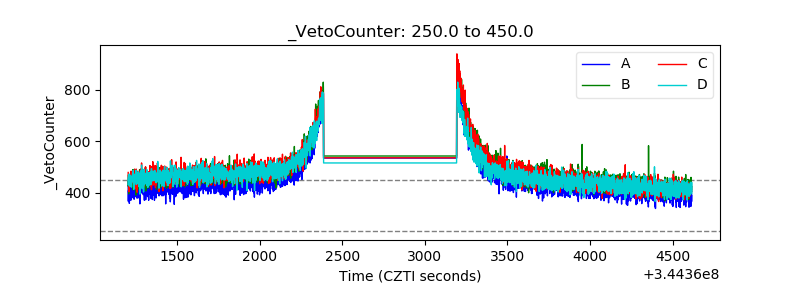 |