| Param | Original file | Final file |
|---|---|---|
| Filename | modeM0/AS1A10_065T03_9000004040_27969cztM0_level2.evt | modeM0/AS1A10_065T03_9000004040_27969cztM0_level2_quad_clean.evt |
| Size (bytes) | 543,254,400 | 99,910,080 |
| Size | 518.1 MB | 95.3 MB |
| Events in quadrant A | 3,439,433 | 670,996 |
| Events in quadrant B | 3,455,022 | 657,200 |
| Events in quadrant C | 3,453,856 | 619,667 |
| Events in quadrant D | 5,629,060 | 589,725 |
| Mode M9 | |||
|---|---|---|---|
| Quadrant | BADHDUFLAG | Total packets | Discarded packets |
| A | 0 | 4 | 0 |
| B | 0 | 4 | 0 |
| C | 0 | 4 | 0 |
| D | 0 | 4 | 0 |
| Mode M0 | |||
|---|---|---|---|
| Quadrant | BADHDUFLAG | Total packets | Discarded packets |
| A | 0 | 14567 | 0 |
| B | 0 | 14589 | 0 |
| C | 0 | 14629 | 0 |
| D | 0 | 21258 | 0 |
| Quadrant | Total seconds | Saturated seconds | Saturation percentage |
|---|---|---|---|
| A | 7004 | 47 | 0.671045% |
| B | 7005 | 71 | 1.013562% |
| C | 7005 | 70 | 0.999286% |
| D | 7004 | 626 | 8.937750% |
Noise dominated data is calculated using 1-second bins in cleaned event files. If a bin has >2000 counts, and if more than 50% of those come from <1% of pixels, then it is considered to be noise-dominated and hence unusable.
| Quadrant | # 1 sec bins | Bins with >0 counts | Bins with >2000 counts | High rate bins dominated by noise | Noise dominated (total time) | Noise dominated (detector-on time) | Marked lightcurve |
|---|---|---|---|---|---|---|---|
| A | 7419 | 7005 | 0 | 0 | 0.00% | 0.00% | 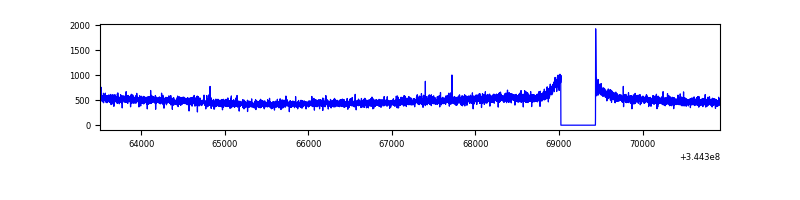 |
| B | 7420 | 7005 | 1 | 1 | 0.01% | 0.01% | 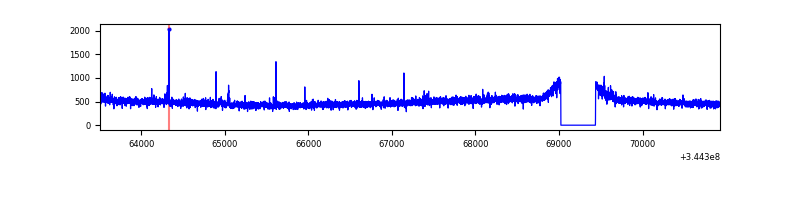 |
| C | 7420 | 7006 | 0 | 0 | 0.00% | 0.00% | 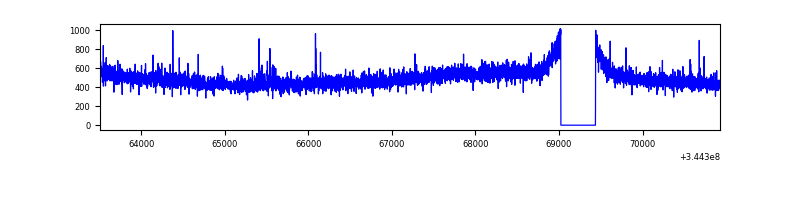 |
| D | 7418 | 7004 | 371 | 371 | 5.00% | 5.30% | 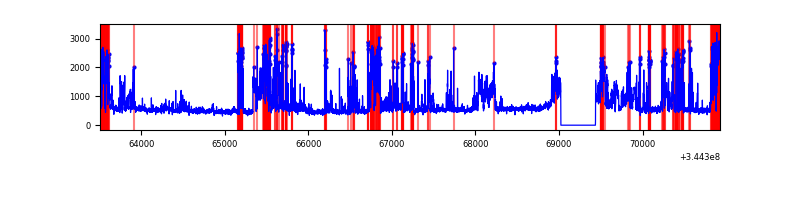 |
Top three noisy pixels from each quadrant. If the there are fewer than three noisy pixels in the level2.evt file, extra rows are filled as -1
| Pixel properties | Quadrant properties | ||||||
|---|---|---|---|---|---|---|---|
| Quadrant | DetID | PixID | Counts | Sigma | Mean | Median | Sigma |
| A | 13 | 254 | 10230 | 52.2 | 890 | 875 | 179.2 |
| A | 3 | 137 | 8763 | 44.01 | 890 | 875 | 179.2 |
| A | 0 | 226 | 7336 | 36.05 | 890 | 875 | 179.2 |
| B | 12 | 111 | 21489 | 120.46 | 873 | 852 | 171.3 |
| B | 11 | 111 | 19550 | 109.14 | 873 | 852 | 171.3 |
| B | 14 | 111 | 18451 | 102.72 | 873 | 852 | 171.3 |
| C | 14 | 238 | 133279 | 671.33 | 840 | 847 | 197.3 |
| C | 3 | 233 | 41246 | 204.79 | 840 | 847 | 197.3 |
| C | 13 | 61 | 5630 | 24.25 | 840 | 847 | 197.3 |
| D | 1 | 52 | 2107402 | 10807.85 | 819 | 800 | 194.9 |
| D | 8 | 195 | 327414 | 1675.68 | 819 | 800 | 194.9 |
| D | 7 | 80 | 65032 | 329.54 | 819 | 800 | 194.9 |
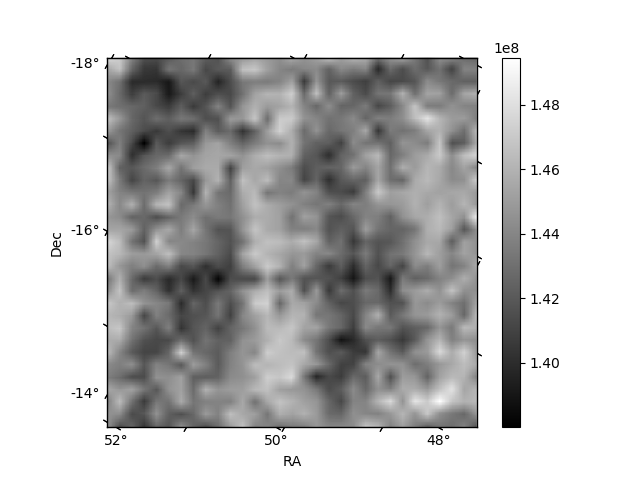
Histogram calculated using DETX and DETY for each event in the final _common_clean file
| Quadrant A | 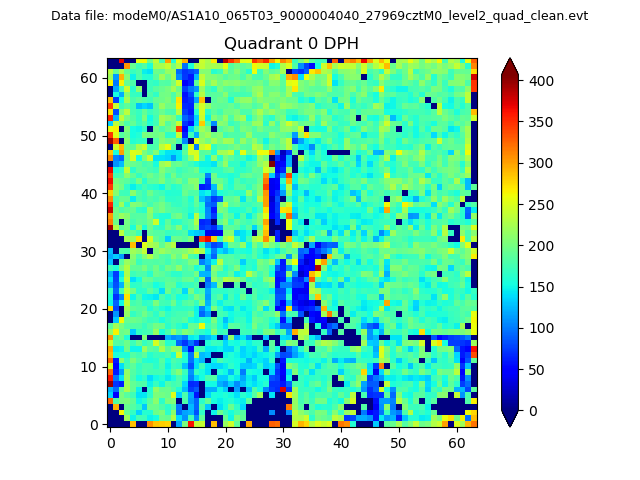 |
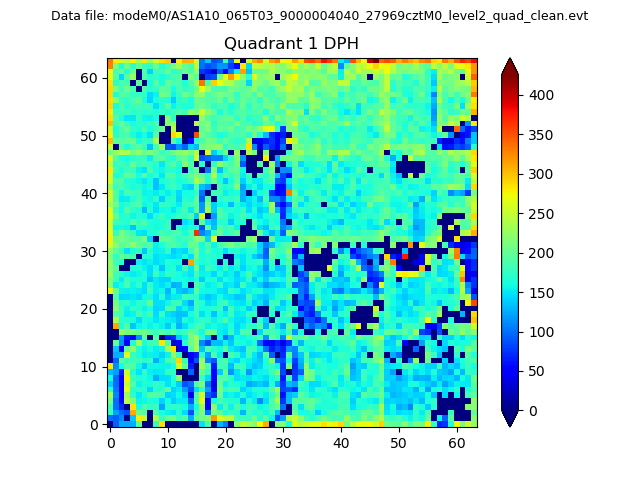 |
Quadrant B |
|---|---|---|---|
| Quadrant D | 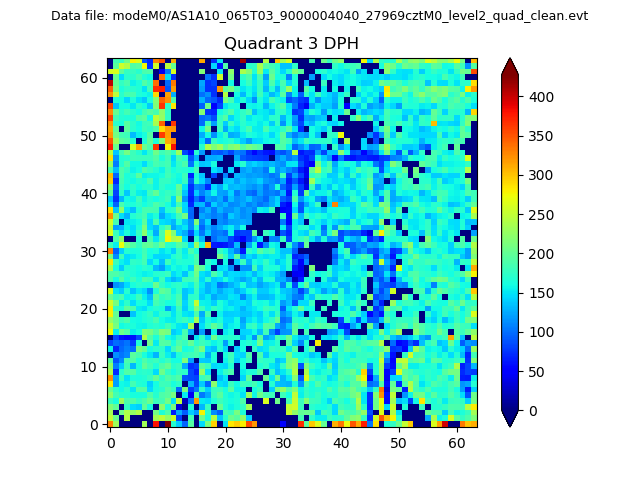 |
 |
Quadrant C |
| Plot type | Count rate plots | Images |
|---|---|---|
| Comparison with Poisson distribution Blue bars denote a histogram of data divided into 1 sec bins. Red curve is a Poisson curve with rate = median count rate of data. |
 |
 |
| Quadrant-wise count rates Data is divided into 100 sec bins |
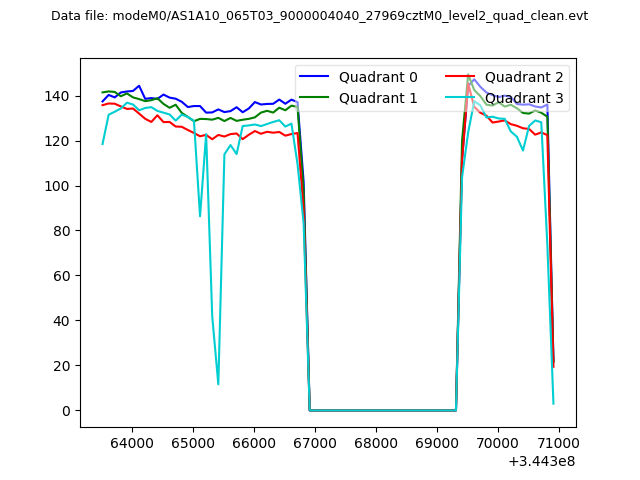 |
|
| Module-wise count rates for Quadrant A Data is divided into 100 sec bins |
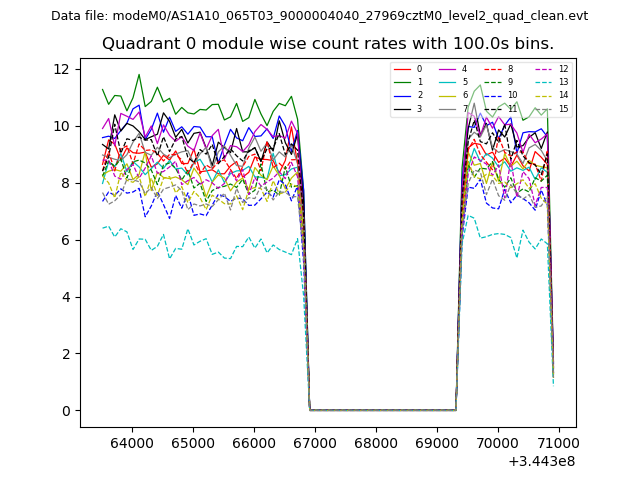 |
 |
| Module-wise count rates for Quadrant B Data is divided into 100 sec bins |
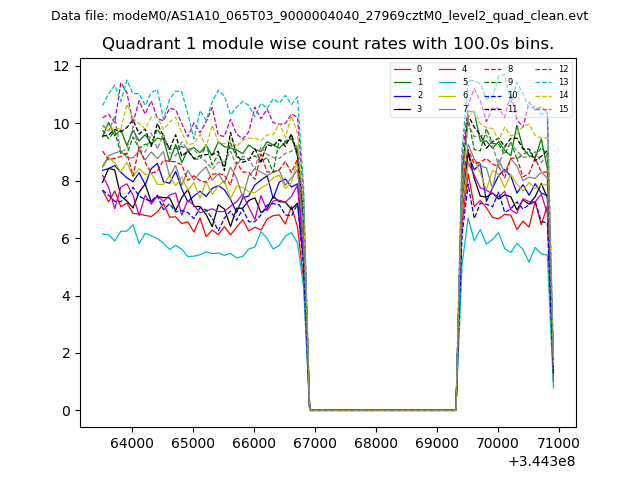 |
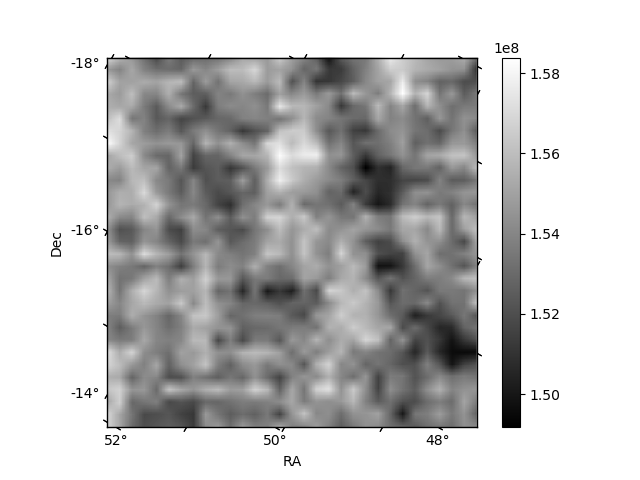 |
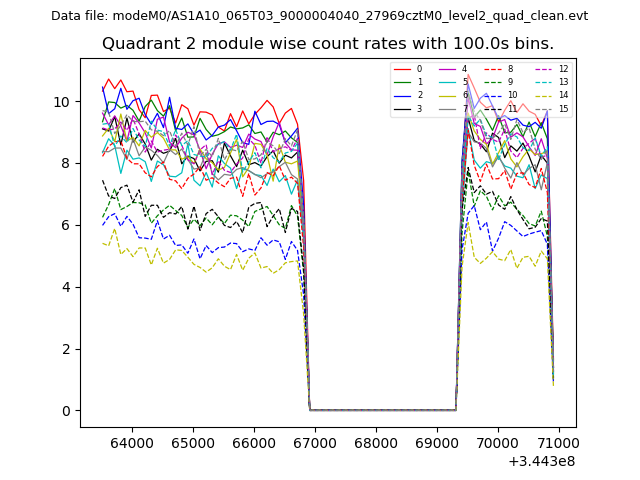
| Module-wise count rates for Quadrant C Data is divided into 100 sec bins |
 |
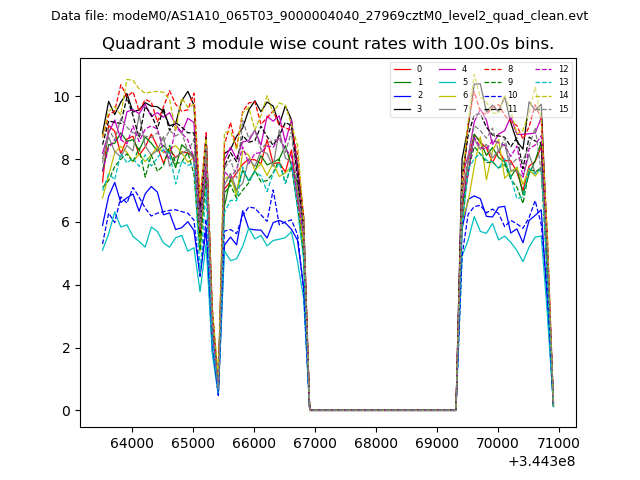
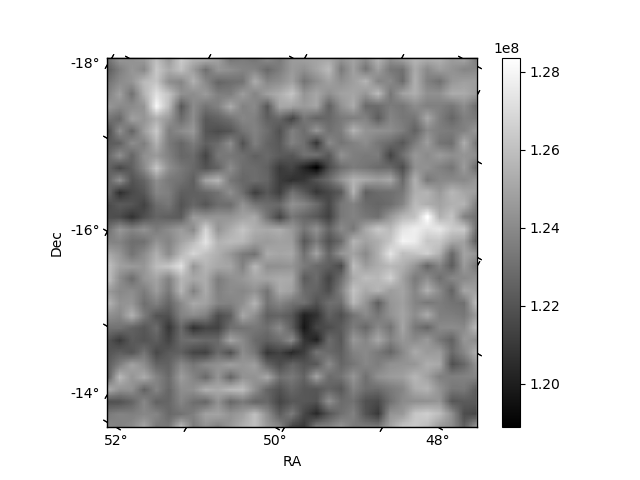 |
| Module-wise count rates for Quadrant D Data is divided into 100 sec bins |
 |
 |
| Parameter | Plot |
|---|---|
| CZT HV Monitor | 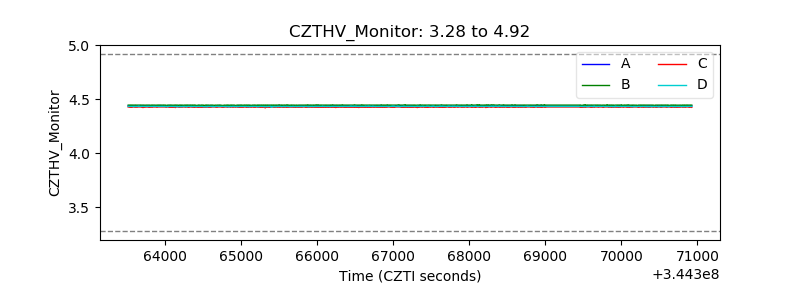 |
| D_VDD | 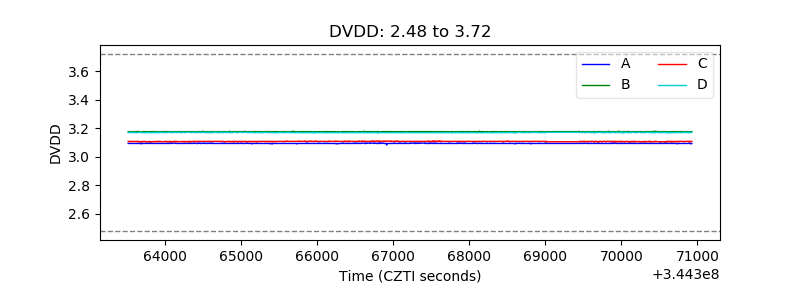 |
| Temperature 1 | 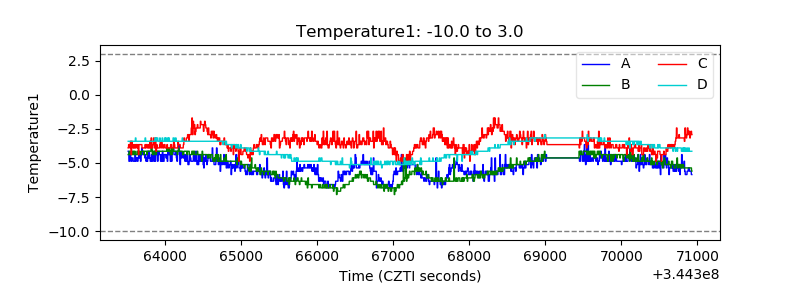 |
| Veto HV Monitor | 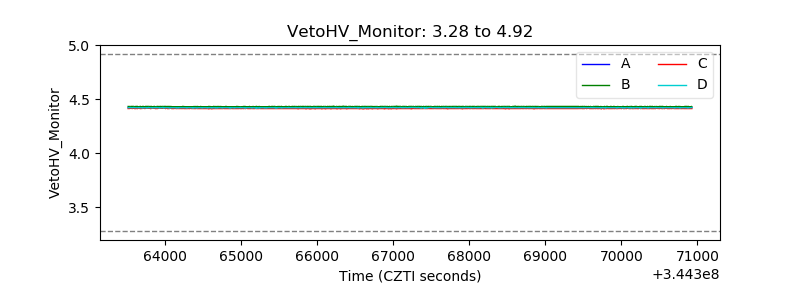 |
| Veto LLD | 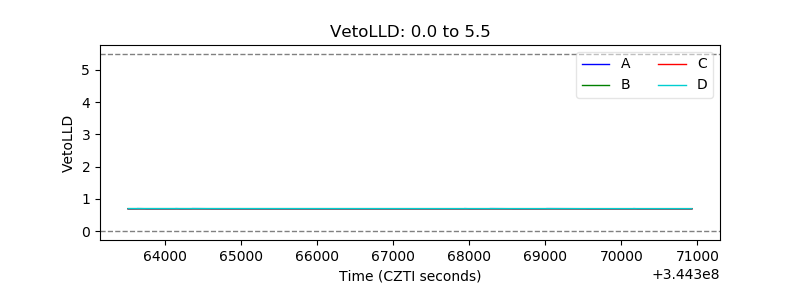 |
| Alpha Counter |  |
| _CPM_Rate | 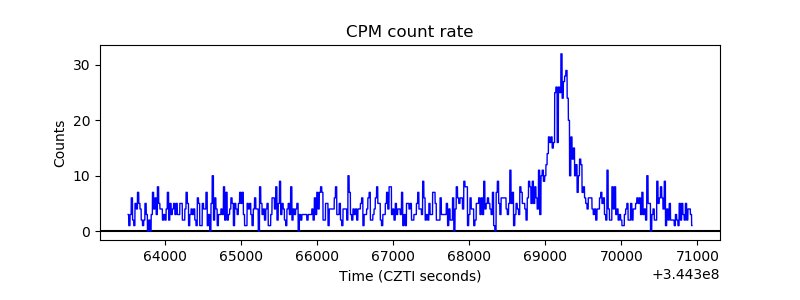 |
| CZT Counter | 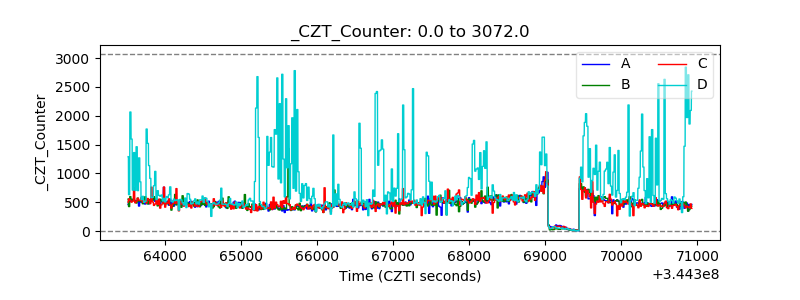 |
| +2.5 Volts monitor |  |
| +5 Volts monitor | 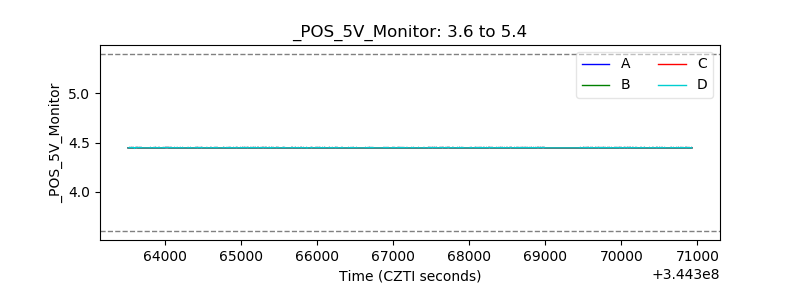 |
| _ROLL_ROT | 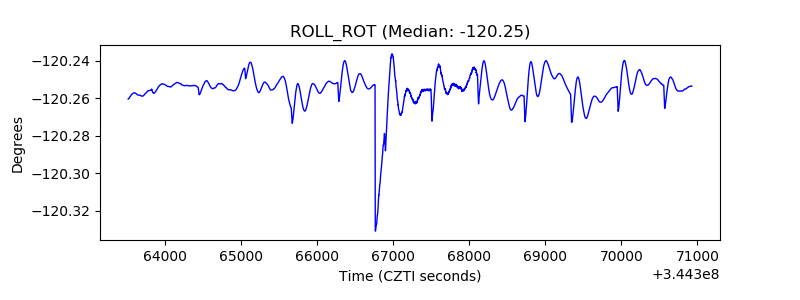 |
| _Roll_DEC | 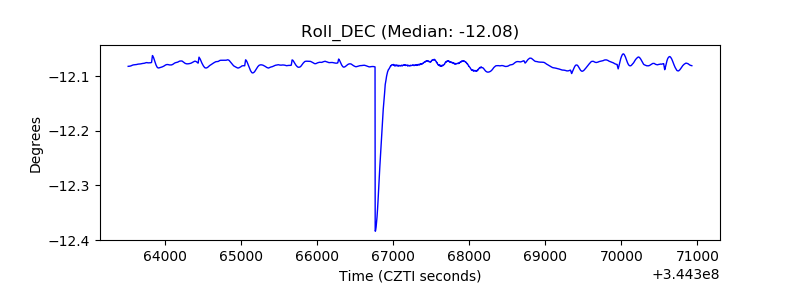 |
| _Roll_RA | 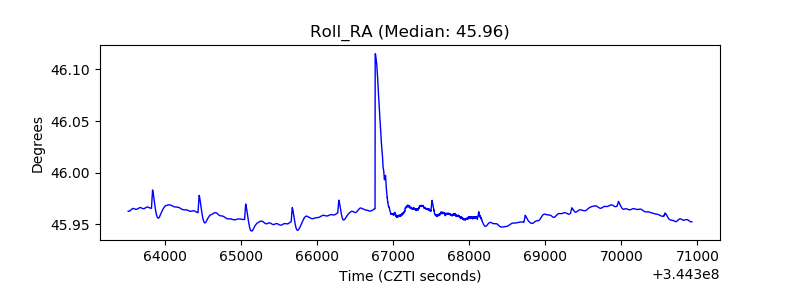 |
| Veto Counter | 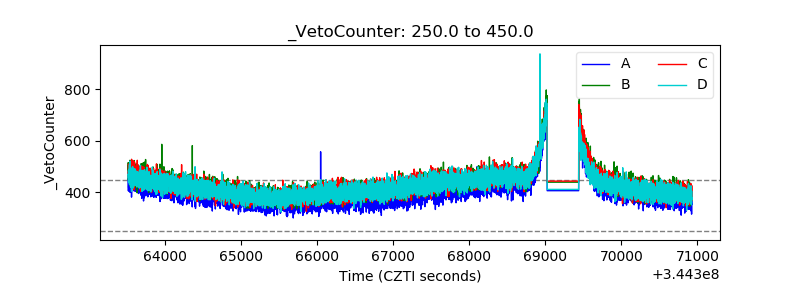 |