| Param | Original file | Final file |
|---|---|---|
| Filename | modeM0/AS1A10_065T03_9000004040_27970cztM0_level2.evt | modeM0/AS1A10_065T03_9000004040_27970cztM0_level2_quad_clean.evt |
| Size (bytes) | 650,520,000 | 112,717,440 |
| Size | 620.4 MB | 107.5 MB |
| Events in quadrant A | 3,873,885 | 758,756 |
| Events in quadrant B | 3,959,258 | 744,388 |
| Events in quadrant C | 3,840,864 | 699,691 |
| Events in quadrant D | 7,498,032 | 667,306 |
| Mode M9 | |||
|---|---|---|---|
| Quadrant | BADHDUFLAG | Total packets | Discarded packets |
| A | 0 | 2 | 0 |
| B | 0 | 3 | 0 |
| C | 0 | 3 | 0 |
| D | 0 | 3 | 0 |
| Mode M0 | |||
|---|---|---|---|
| Quadrant | BADHDUFLAG | Total packets | Discarded packets |
| A | 0 | 16452 | 0 |
| B | 0 | 16801 | 0 |
| C | 0 | 16426 | 0 |
| D | 0 | 27507 | 0 |
| Quadrant | Total seconds | Saturated seconds | Saturation percentage |
|---|---|---|---|
| A | 7806 | 94 | 1.204202% |
| B | 7806 | 141 | 1.806303% |
| C | 7805 | 122 | 1.563101% |
| D | 7805 | 888 | 11.377322% |
Noise dominated data is calculated using 1-second bins in cleaned event files. If a bin has >2000 counts, and if more than 50% of those come from <1% of pixels, then it is considered to be noise-dominated and hence unusable.
| Quadrant | # 1 sec bins | Bins with >0 counts | Bins with >2000 counts | High rate bins dominated by noise | Noise dominated (total time) | Noise dominated (detector-on time) | Marked lightcurve |
|---|---|---|---|---|---|---|---|
| A | 7881 | 7807 | 0 | 0 | 0.00% | 0.00% | 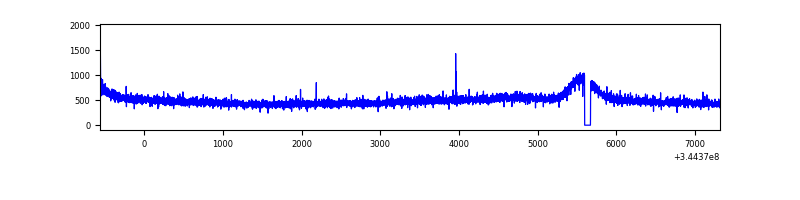 |
| B | 7881 | 7807 | 0 | 0 | 0.00% | 0.00% | 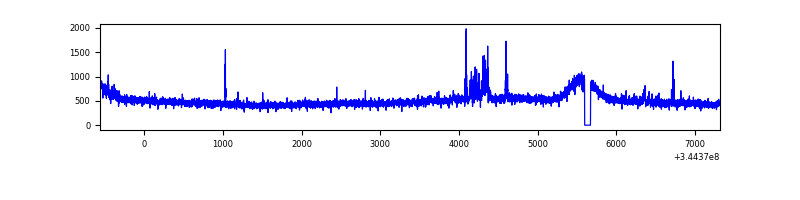 |
| C | 7880 | 7806 | 0 | 0 | 0.00% | 0.00% | 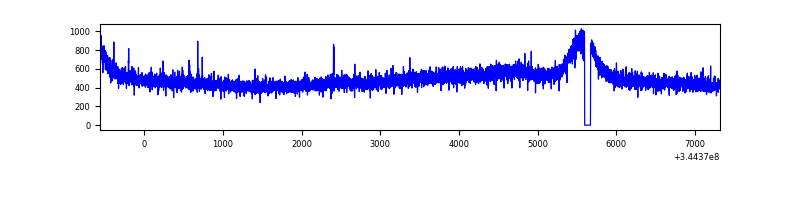 |
| D | 7880 | 7806 | 706 | 706 | 8.96% | 9.04% | 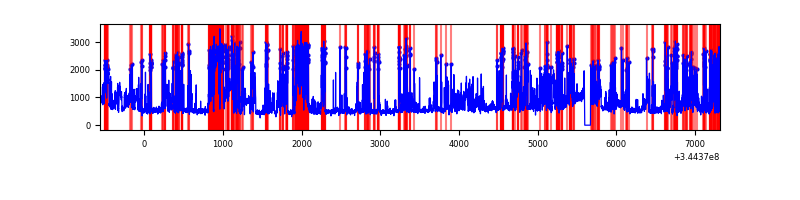 |
Top three noisy pixels from each quadrant. If the there are fewer than three noisy pixels in the level2.evt file, extra rows are filled as -1
| Pixel properties | Quadrant properties | ||||||
|---|---|---|---|---|---|---|---|
| Quadrant | DetID | PixID | Counts | Sigma | Mean | Median | Sigma |
| A | 6 | 16 | 11609 | 52.62 | 1000 | 980 | 202.0 |
| A | 13 | 254 | 11541 | 52.28 | 1000 | 980 | 202.0 |
| A | 3 | 137 | 10126 | 45.28 | 1000 | 980 | 202.0 |
| B | 10 | 245 | 81105 | 416.91 | 980 | 954 | 192.2 |
| B | 12 | 111 | 24397 | 121.94 | 980 | 954 | 192.2 |
| B | 11 | 111 | 22280 | 110.93 | 980 | 954 | 192.2 |
| C | 14 | 238 | 150538 | 671.24 | 941 | 947 | 222.9 |
| C | 3 | 233 | 12682 | 52.66 | 941 | 947 | 222.9 |
| C | 13 | 61 | 6359 | 24.28 | 941 | 947 | 222.9 |
| D | 1 | 52 | 3484154 | 15947.25 | 916 | 894 | 218.4 |
| D | 8 | 195 | 414886 | 1895.36 | 916 | 894 | 218.4 |
| D | 7 | 80 | 107589 | 488.48 | 916 | 894 | 218.4 |
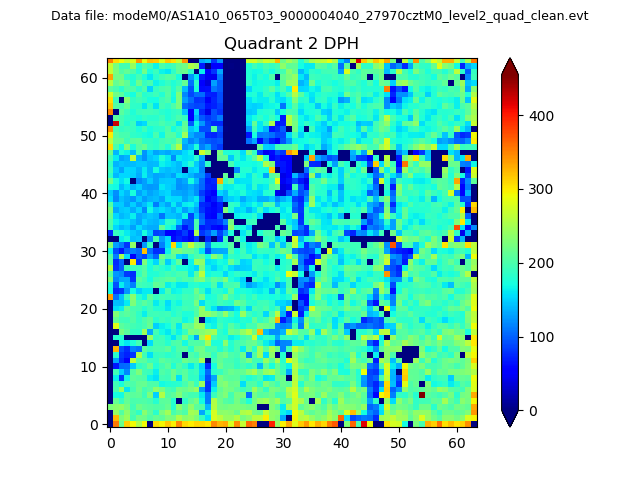
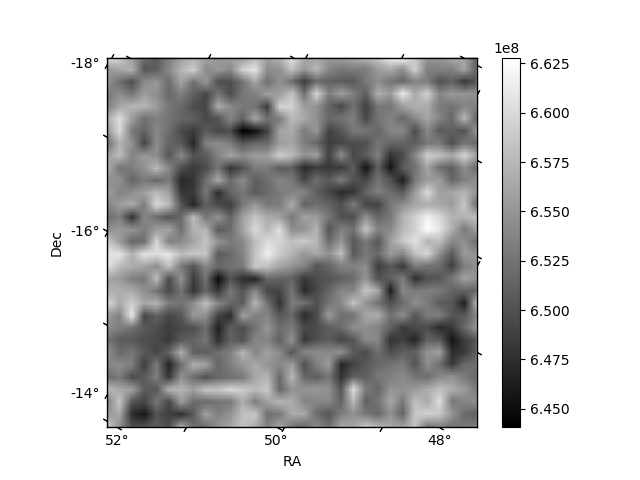
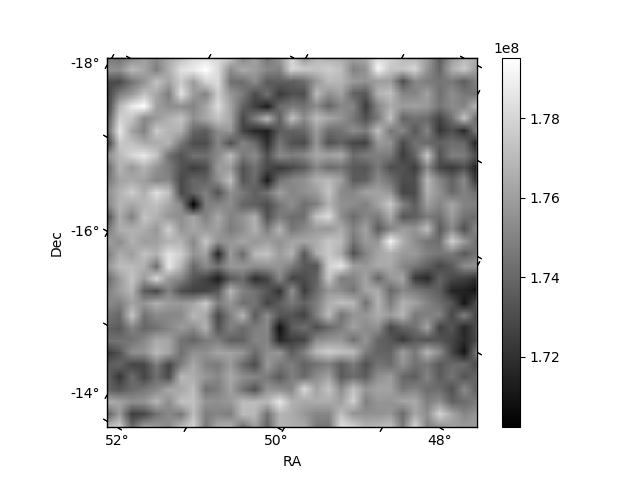
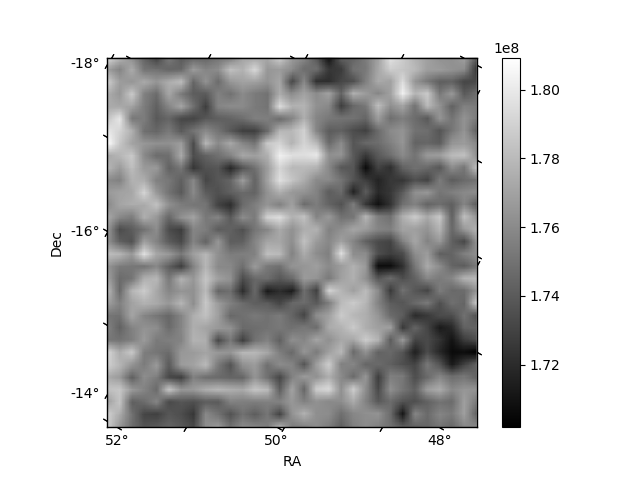
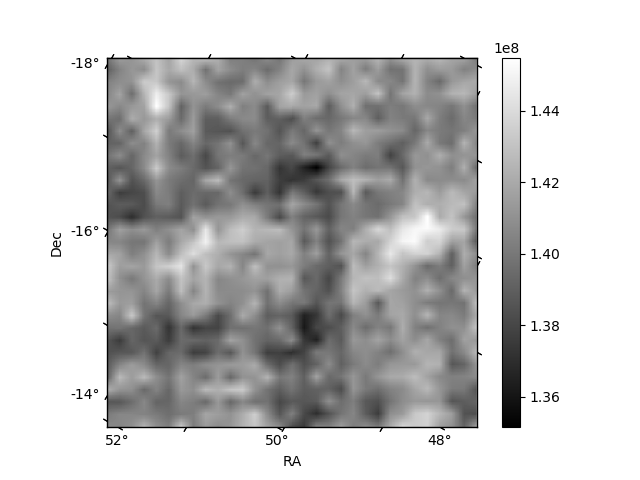
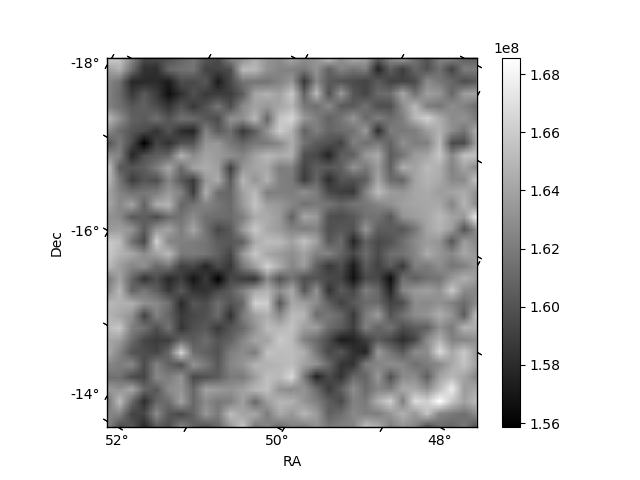
Histogram calculated using DETX and DETY for each event in the final _common_clean file
| Quadrant A | 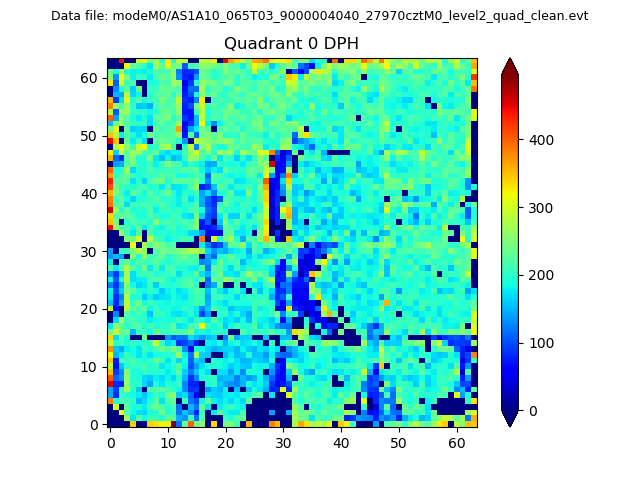 |
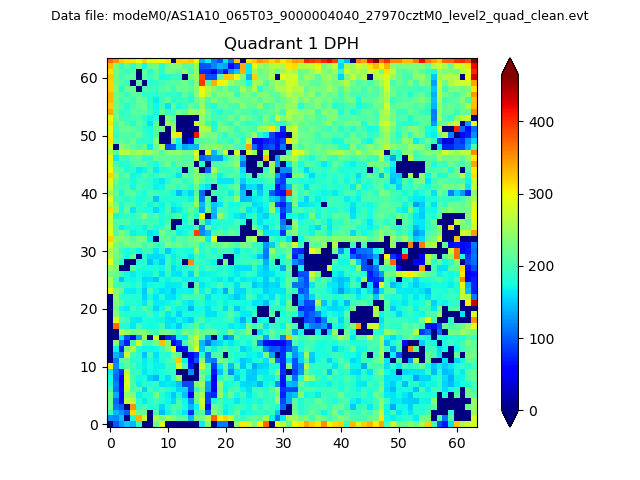 |
Quadrant B |
|---|---|---|---|
| Quadrant D | 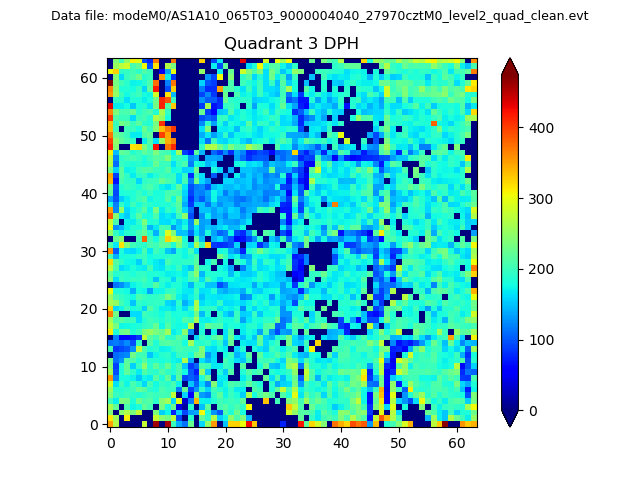 |
 |
Quadrant C |
| Plot type | Count rate plots | Images |
|---|---|---|
| Comparison with Poisson distribution Blue bars denote a histogram of data divided into 1 sec bins. Red curve is a Poisson curve with rate = median count rate of data. |
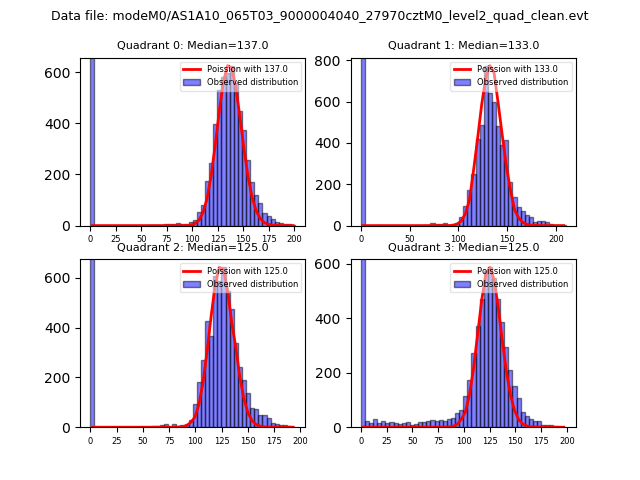 |
 |
| Quadrant-wise count rates Data is divided into 100 sec bins |
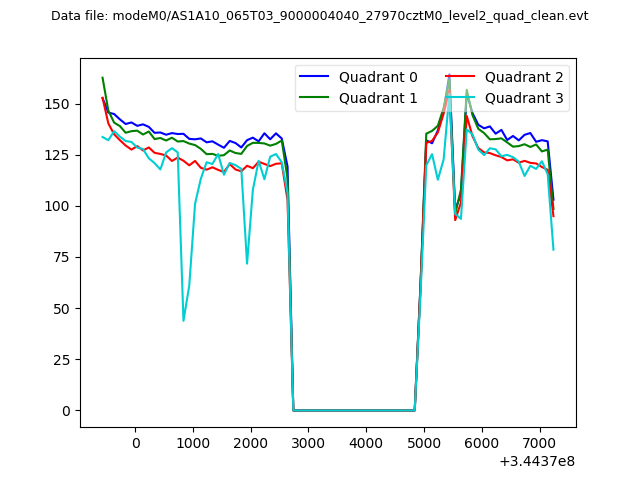 |
|
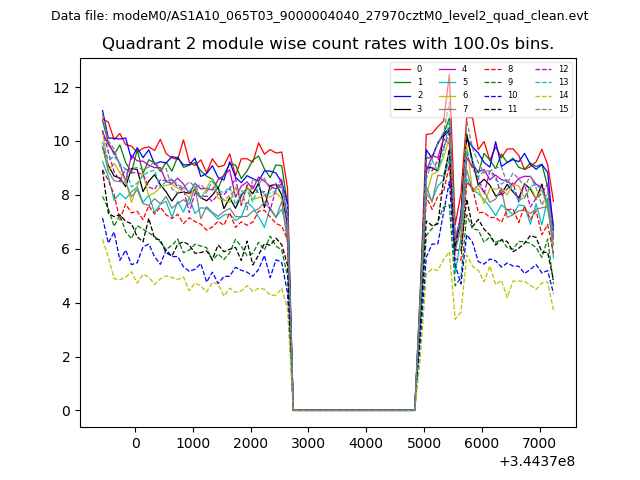
| Module-wise count rates for Quadrant A Data is divided into 100 sec bins |
 |
 |
| Module-wise count rates for Quadrant B Data is divided into 100 sec bins |
 |
 |
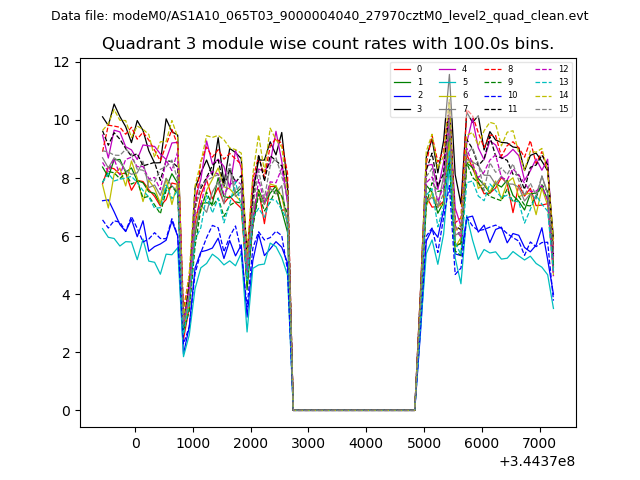
| Module-wise count rates for Quadrant C Data is divided into 100 sec bins |
 |
 |
| Module-wise count rates for Quadrant D Data is divided into 100 sec bins |
 |
 |
| Parameter | Plot |
|---|---|
| CZT HV Monitor | 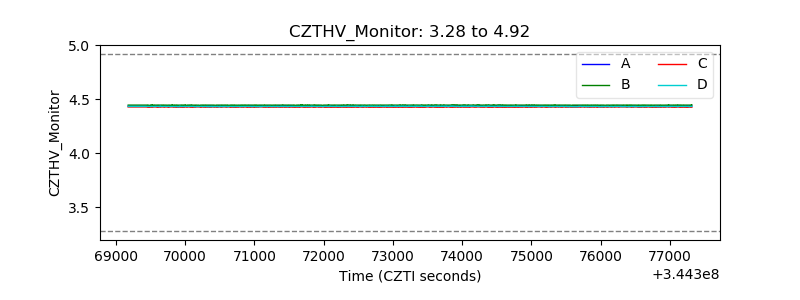 |
| D_VDD | 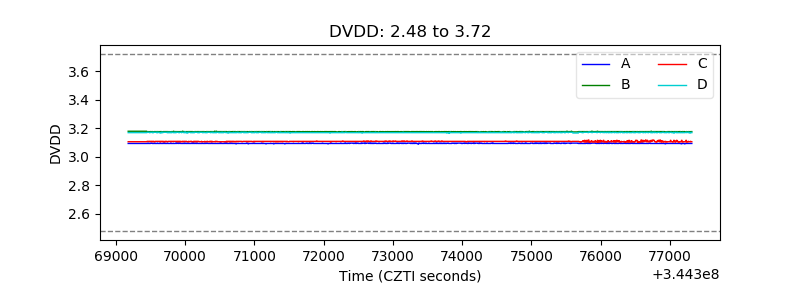 |
| Temperature 1 | 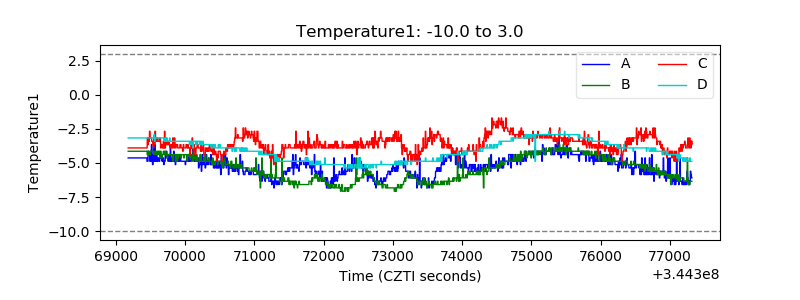 |
| Veto HV Monitor | 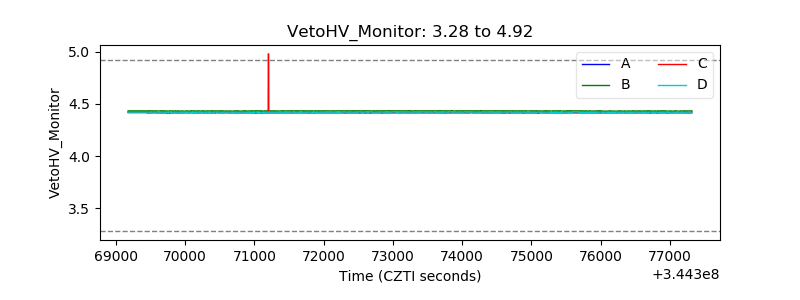 |
| Veto LLD |  |
| Alpha Counter | 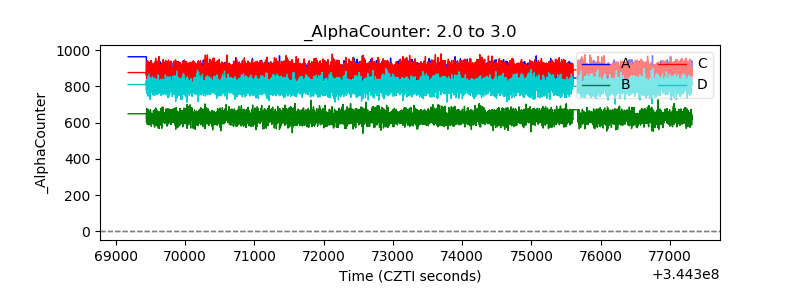 |
| _CPM_Rate | 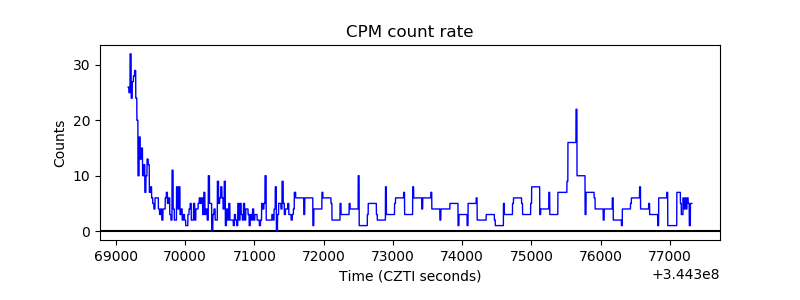 |
| CZT Counter | 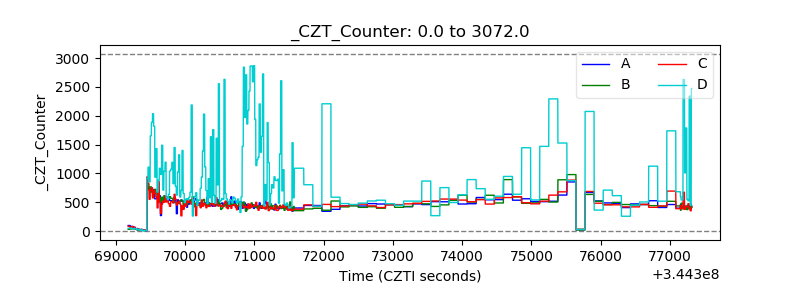 |
| +2.5 Volts monitor |  |
| +5 Volts monitor |  |
| _ROLL_ROT | 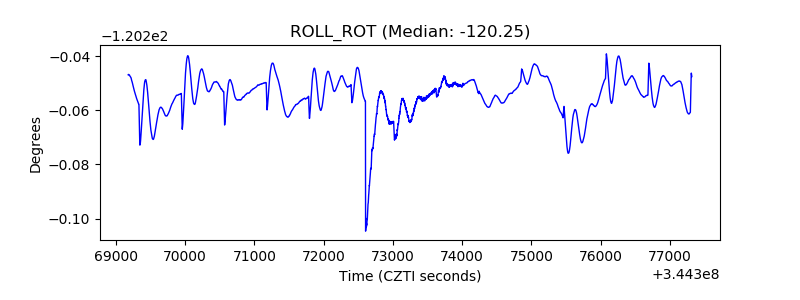 |
| _Roll_DEC | 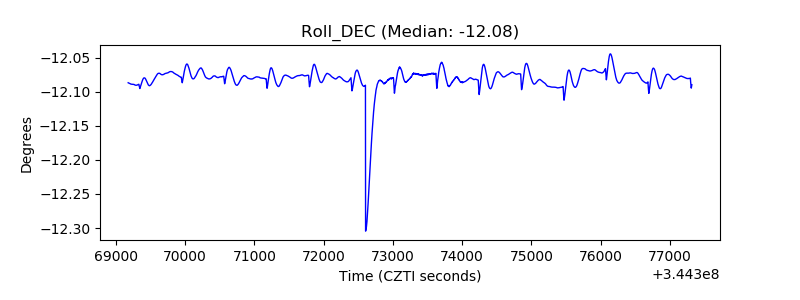 |
| _Roll_RA | 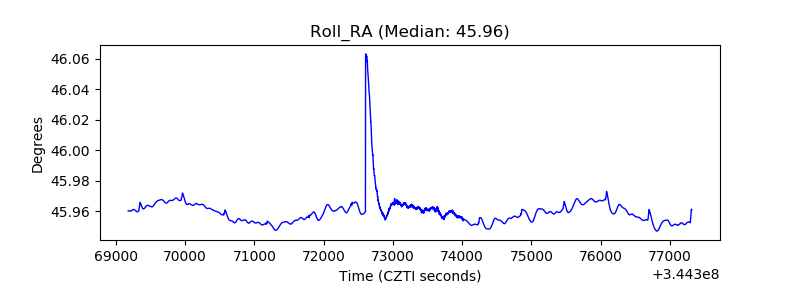 |
| Veto Counter | 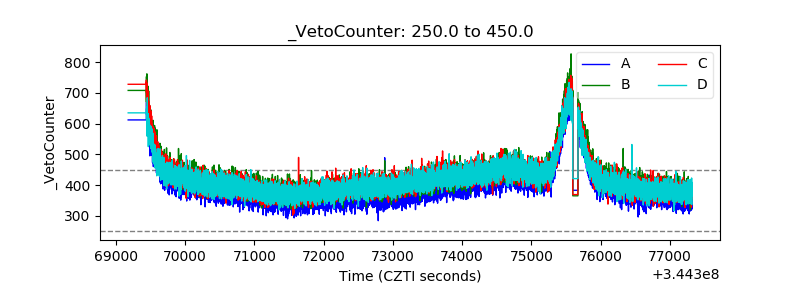 |