| Param | Original file | Final file |
|---|---|---|
| Filename | modeM0/AS1A10_065T03_9000004040_27971cztM0_level2.evt | modeM0/AS1A10_065T03_9000004040_27971cztM0_level2_quad_clean.evt |
| Size (bytes) | 614,880,000 | 115,413,120 |
| Size | 586.4 MB | 110.1 MB |
| Events in quadrant A | 3,908,767 | 771,159 |
| Events in quadrant B | 3,949,357 | 751,917 |
| Events in quadrant C | 3,904,769 | 709,266 |
| Events in quadrant D | 6,321,234 | 711,281 |
| Mode M9 | |||
|---|---|---|---|
| Quadrant | BADHDUFLAG | Total packets | Discarded packets |
| A | 0 | 3 | 0 |
| B | 0 | 3 | 0 |
| C | 0 | 3 | 0 |
| D | 0 | 3 | 0 |
| Mode M0 | |||
|---|---|---|---|
| Quadrant | BADHDUFLAG | Total packets | Discarded packets |
| A | 0 | 16734 | 0 |
| B | 0 | 16857 | 0 |
| C | 0 | 16705 | 0 |
| D | 0 | 24036 | 0 |
| Quadrant | Total seconds | Saturated seconds | Saturation percentage |
|---|---|---|---|
| A | 7930 | 99 | 1.248424% |
| B | 7929 | 188 | 2.371043% |
| C | 7929 | 143 | 1.803506% |
| D | 7929 | 380 | 4.792534% |
Noise dominated data is calculated using 1-second bins in cleaned event files. If a bin has >2000 counts, and if more than 50% of those come from <1% of pixels, then it is considered to be noise-dominated and hence unusable.
| Quadrant | # 1 sec bins | Bins with >0 counts | Bins with >2000 counts | High rate bins dominated by noise | Noise dominated (total time) | Noise dominated (detector-on time) | Marked lightcurve |
|---|---|---|---|---|---|---|---|
| A | 8275 | 7932 | 0 | 0 | 0.00% | 0.00% | 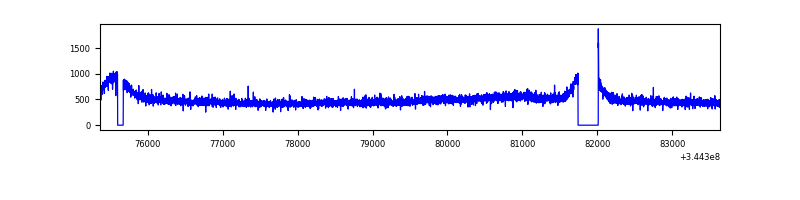 |
| B | 8274 | 7930 | 4 | 4 | 0.05% | 0.05% | 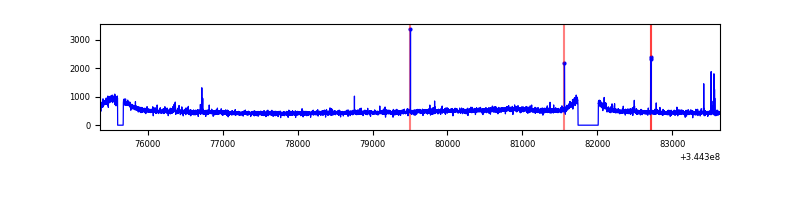 |
| C | 8274 | 7930 | 0 | 0 | 0.00% | 0.00% |  |
| D | 8274 | 7931 | 274 | 274 | 3.31% | 3.45% | 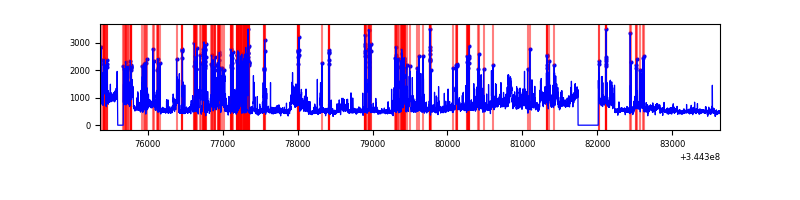 |
Top three noisy pixels from each quadrant. If the there are fewer than three noisy pixels in the level2.evt file, extra rows are filled as -1
| Pixel properties | Quadrant properties | ||||||
|---|---|---|---|---|---|---|---|
| Quadrant | DetID | PixID | Counts | Sigma | Mean | Median | Sigma |
| A | 13 | 254 | 11839 | 53.47 | 1010 | 990 | 202.9 |
| A | 3 | 137 | 10494 | 46.85 | 1010 | 990 | 202.9 |
| A | 0 | 226 | 8451 | 36.78 | 1010 | 990 | 202.9 |
| B | 10 | 245 | 29601 | 146.21 | 992 | 964 | 195.9 |
| B | 12 | 111 | 25138 | 123.43 | 992 | 964 | 195.9 |
| B | 11 | 111 | 22761 | 111.29 | 992 | 964 | 195.9 |
| C | 14 | 238 | 150237 | 661.62 | 953 | 958 | 225.6 |
| C | 2 | 16 | 15173 | 63.0 | 953 | 958 | 225.6 |
| C | 8 | 128 | 13173 | 54.14 | 953 | 958 | 225.6 |
| D | 1 | 52 | 1621131 | 7012.86 | 959 | 932 | 231.0 |
| D | 8 | 195 | 656442 | 2837.3 | 959 | 932 | 231.0 |
| D | 7 | 80 | 295067 | 1273.13 | 959 | 932 | 231.0 |
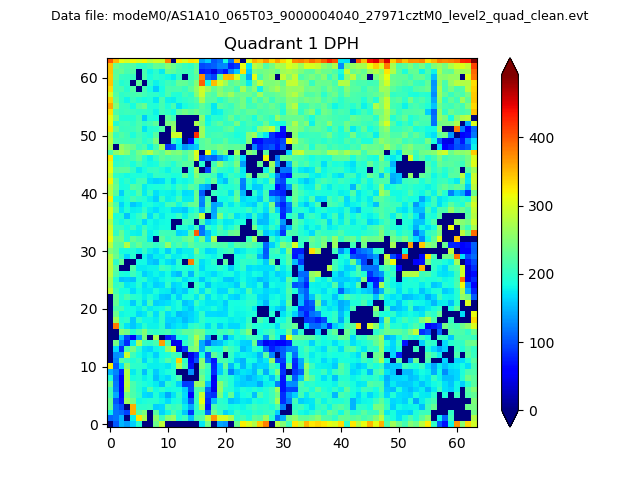
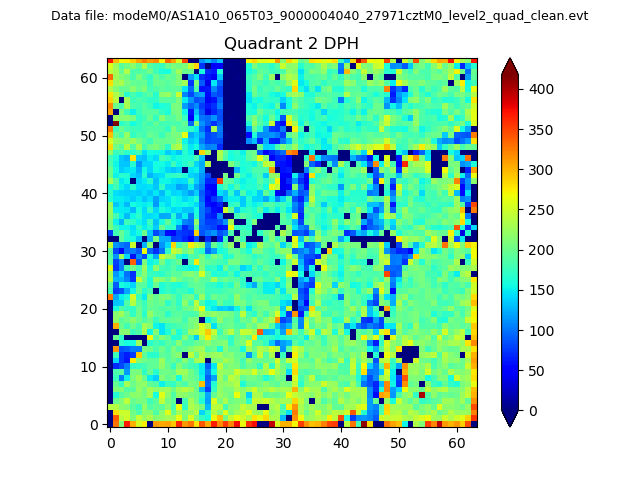
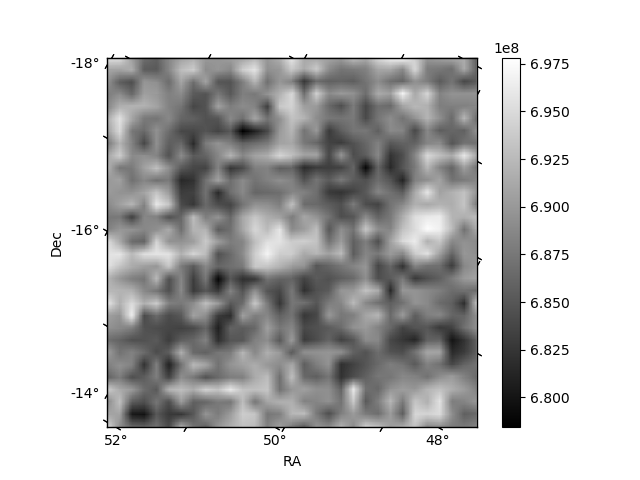
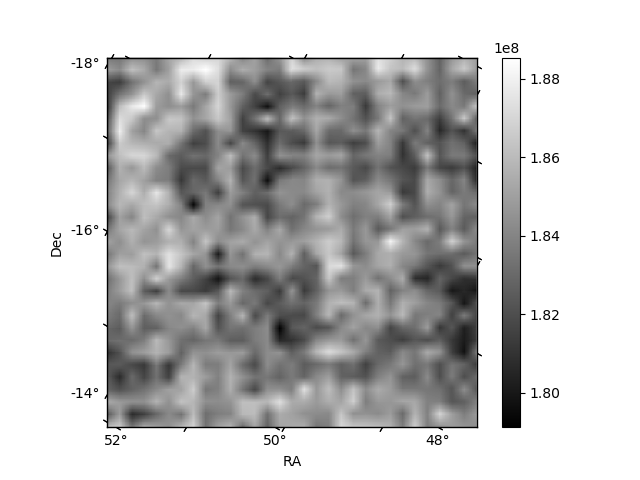
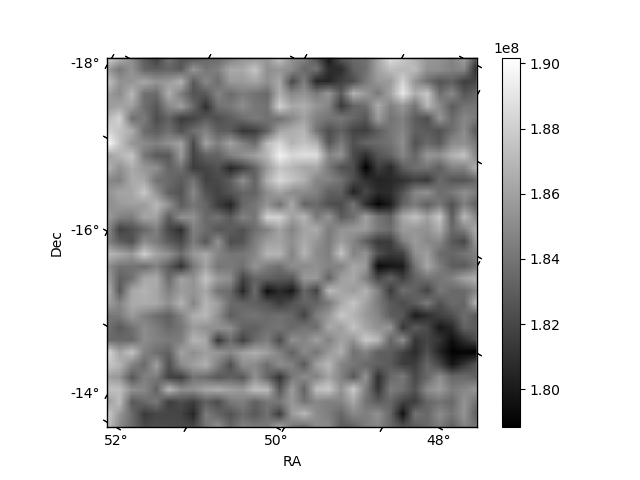
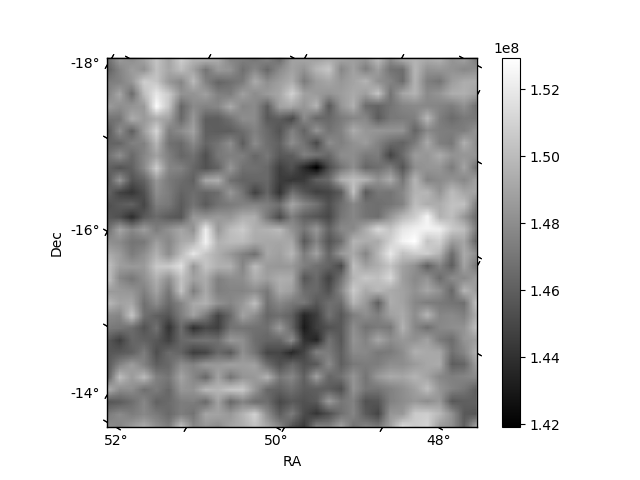
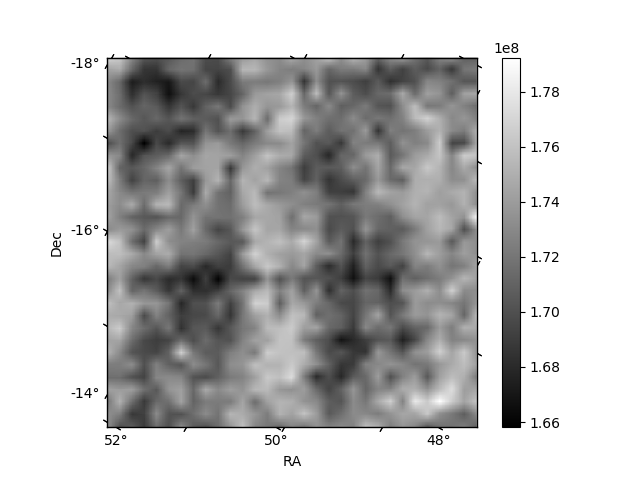
Histogram calculated using DETX and DETY for each event in the final _common_clean file
| Quadrant A | 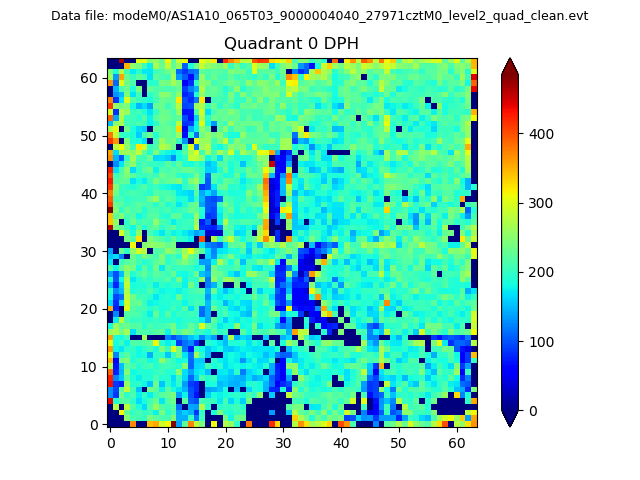 |
 |
Quadrant B |
|---|---|---|---|
| Quadrant D | 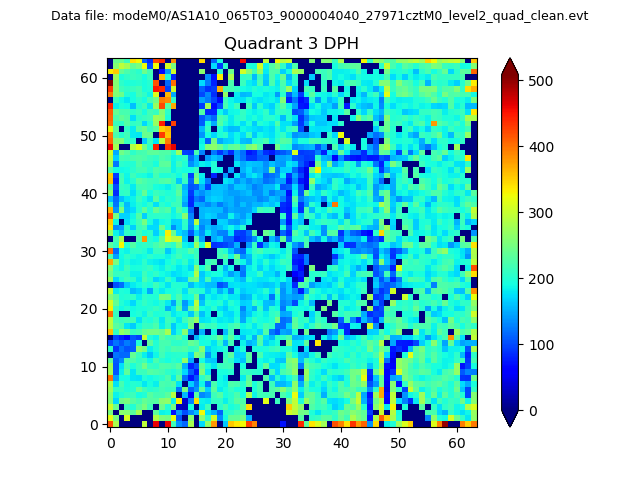 |
 |
Quadrant C |
| Plot type | Count rate plots | Images |
|---|---|---|
| Comparison with Poisson distribution Blue bars denote a histogram of data divided into 1 sec bins. Red curve is a Poisson curve with rate = median count rate of data. |
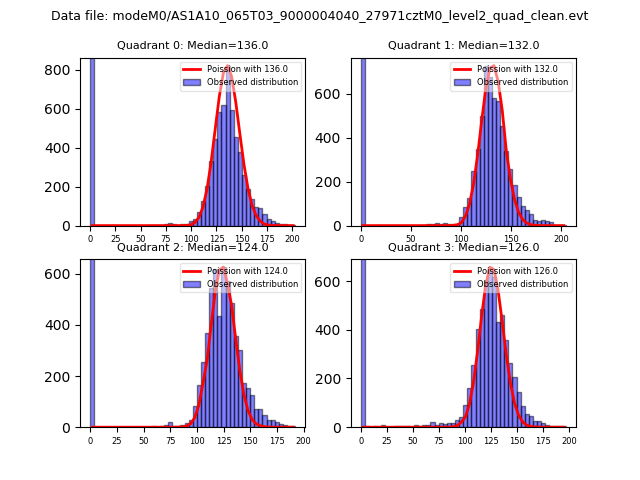 |
 |
| Quadrant-wise count rates Data is divided into 100 sec bins |
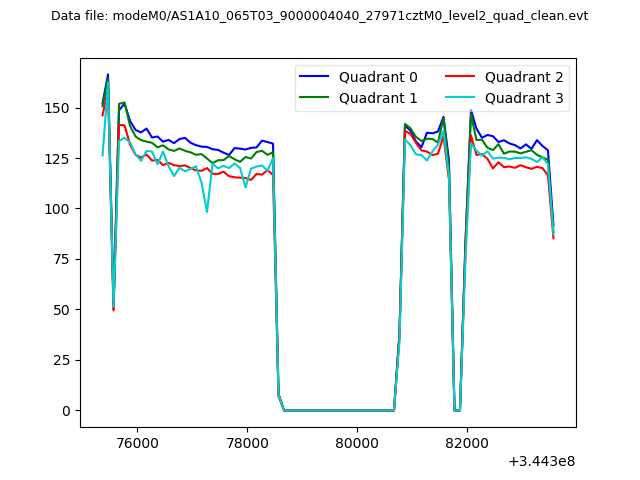 |
|
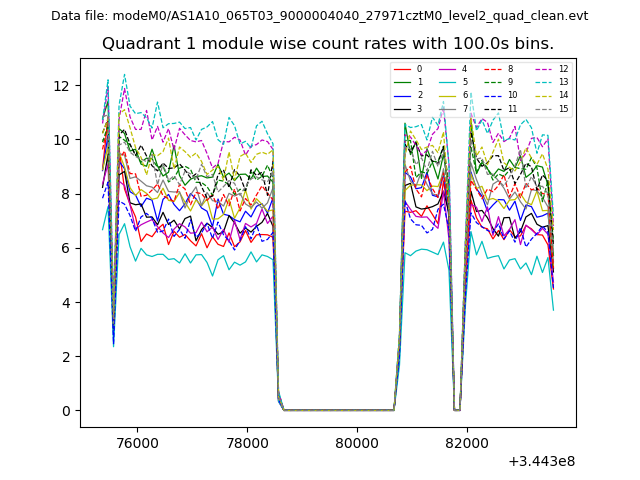
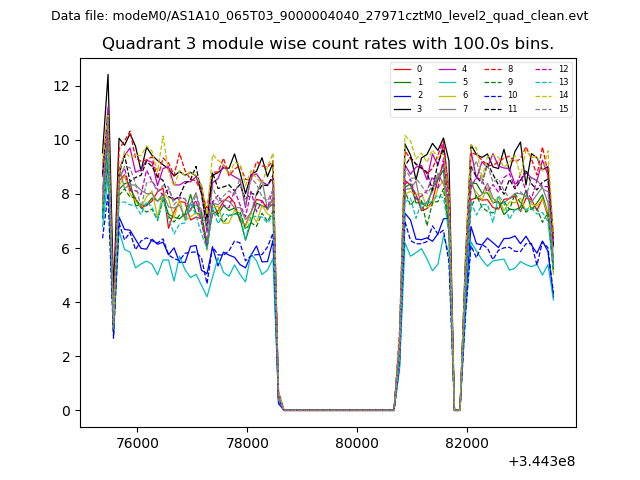
| Module-wise count rates for Quadrant A Data is divided into 100 sec bins |
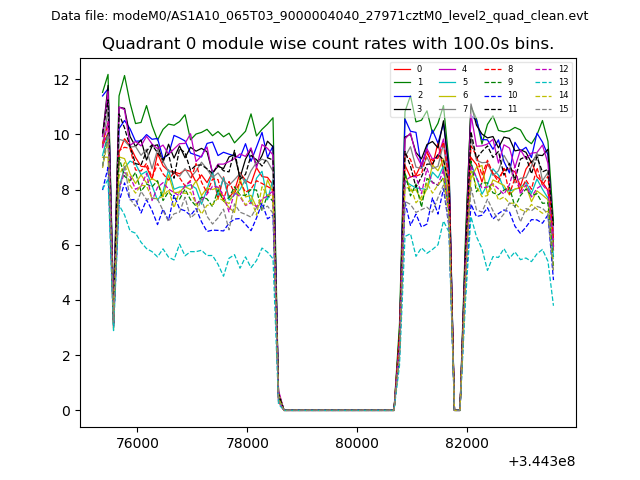 |
 |
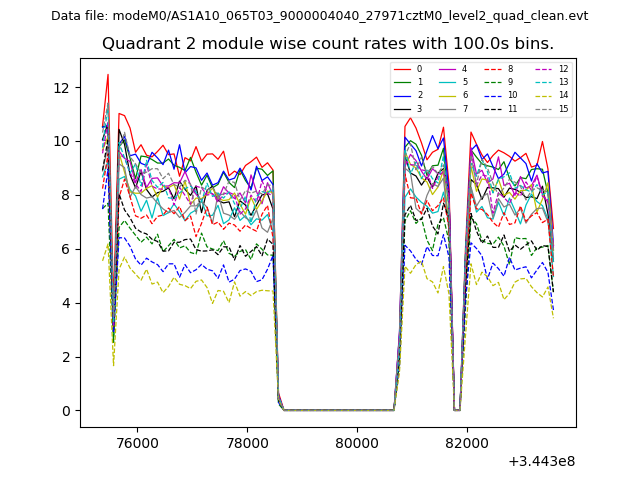
| Module-wise count rates for Quadrant B Data is divided into 100 sec bins |
 |
 |
| Module-wise count rates for Quadrant C Data is divided into 100 sec bins |
 |
 |
| Module-wise count rates for Quadrant D Data is divided into 100 sec bins |
 |
 |
| Parameter | Plot |
|---|---|
| CZT HV Monitor | 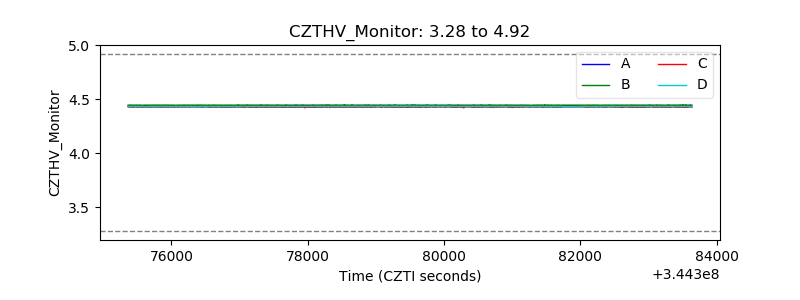 |
| D_VDD | 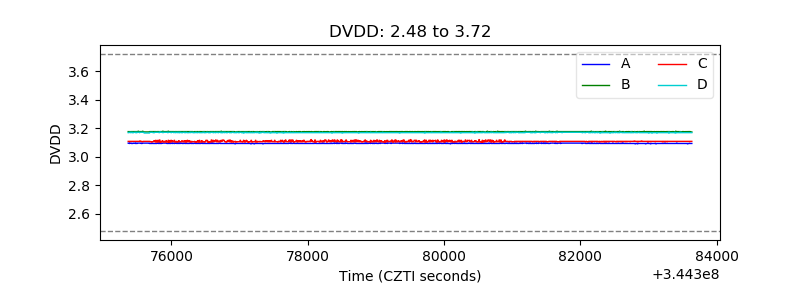 |
| Temperature 1 | 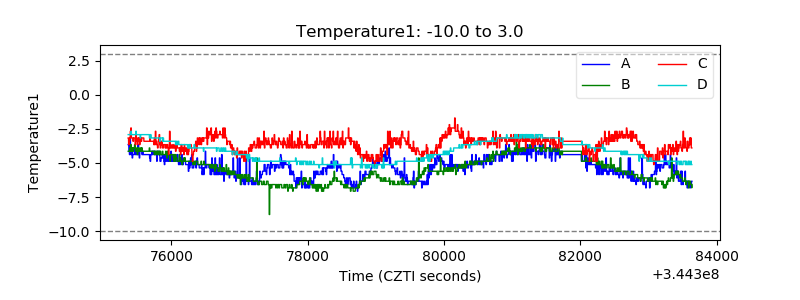 |
| Veto HV Monitor | 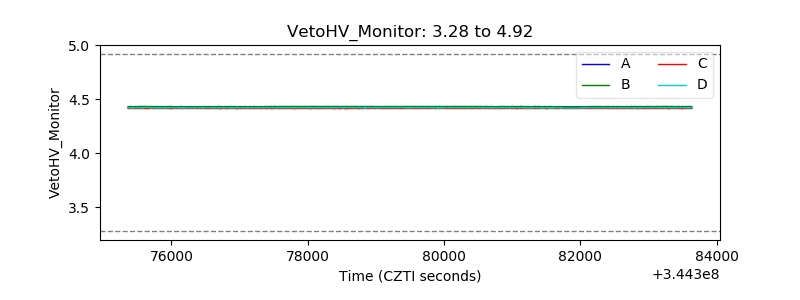 |
| Veto LLD | 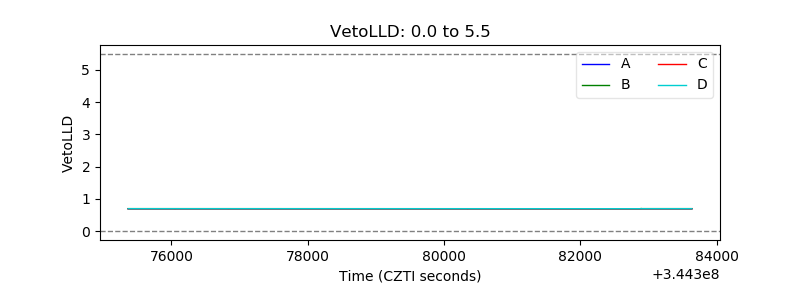 |
| Alpha Counter | 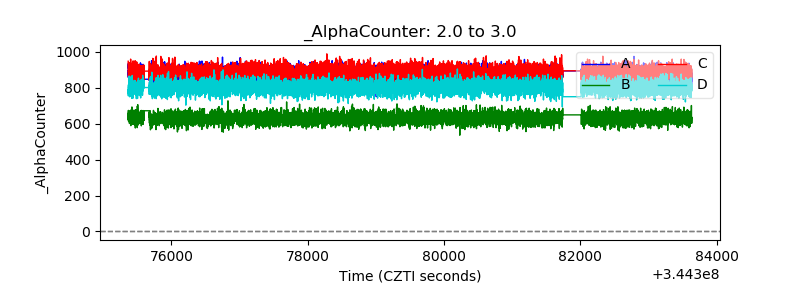 |
| _CPM_Rate | 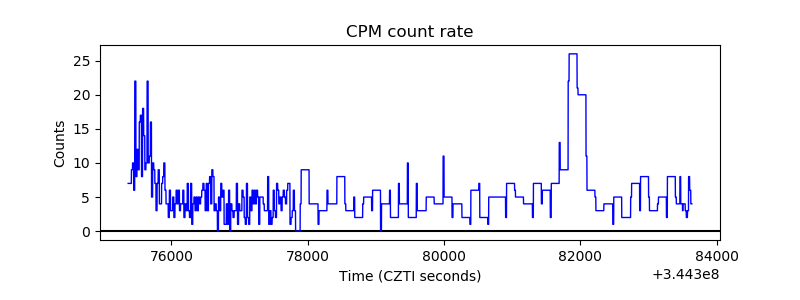 |
| CZT Counter | 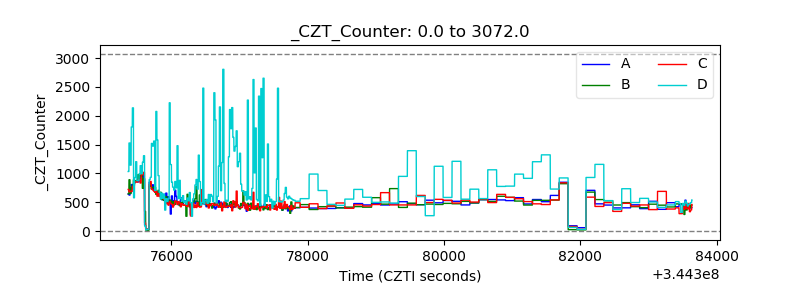 |
| +2.5 Volts monitor | 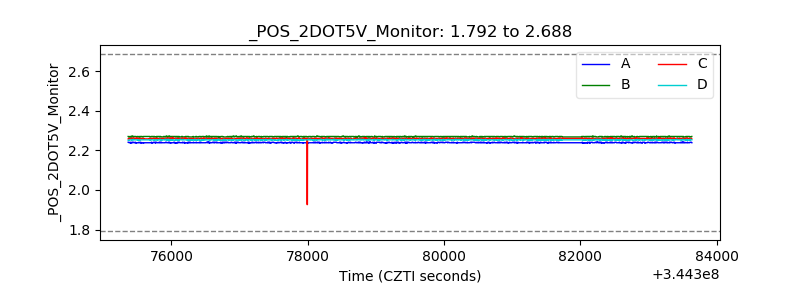 |
| +5 Volts monitor |  |
| _ROLL_ROT | 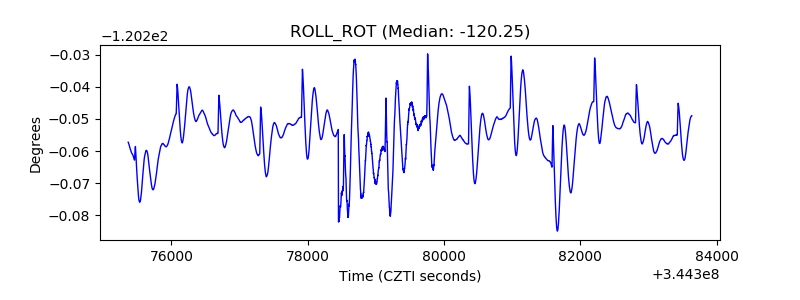 |
| _Roll_DEC | 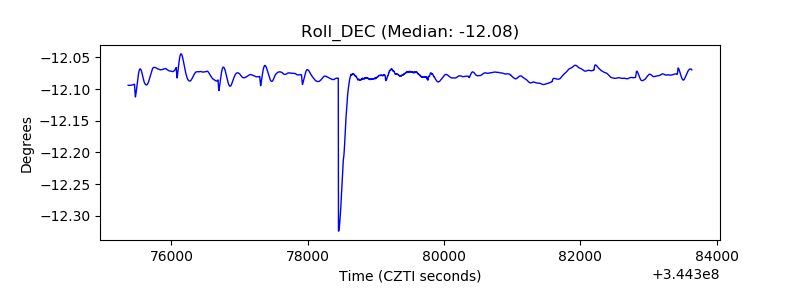 |
| _Roll_RA | 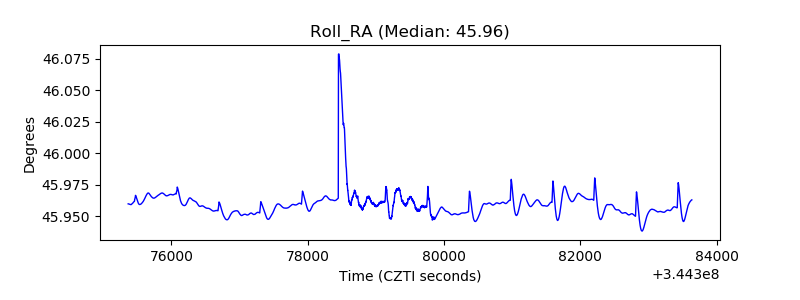 |
| Veto Counter | 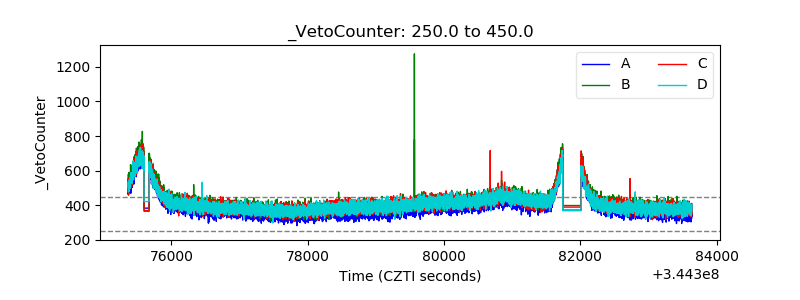 |