| Param | Original file | Final file |
|---|---|---|
| Filename | modeM0/AS1A10_065T03_9000004040_27973cztM0_level2.evt | modeM0/AS1A10_065T03_9000004040_27973cztM0_level2_quad_clean.evt |
| Size (bytes) | 960,868,800 | 181,474,560 |
| Size | 916.4 MB | 173.1 MB |
| Events in quadrant A | 6,401,361 | 1,188,322 |
| Events in quadrant B | 6,505,649 | 1,165,881 |
| Events in quadrant C | 6,469,470 | 1,096,339 |
| Events in quadrant D | 8,817,655 | 1,120,247 |
| Mode M9 | |||
|---|---|---|---|
| Quadrant | BADHDUFLAG | Total packets | Discarded packets |
| A | 0 | 15 | 0 |
| B | 0 | 15 | 0 |
| C | 0 | 15 | 0 |
| D | 0 | 15 | 0 |
| Mode M0 | |||
|---|---|---|---|
| Quadrant | BADHDUFLAG | Total packets | Discarded packets |
| A | 0 | 27522 | 0 |
| B | 0 | 27718 | 0 |
| C | 0 | 27586 | 0 |
| D | 0 | 35061 | 0 |
| Quadrant | Total seconds | Saturated seconds | Saturation percentage |
|---|---|---|---|
| A | 13394 | 79 | 0.589816% |
| B | 13395 | 148 | 1.104890% |
| C | 13395 | 188 | 1.403509% |
| D | 13395 | 157 | 1.172079% |
Noise dominated data is calculated using 1-second bins in cleaned event files. If a bin has >2000 counts, and if more than 50% of those come from <1% of pixels, then it is considered to be noise-dominated and hence unusable.
| Quadrant | # 1 sec bins | Bins with >0 counts | Bins with >2000 counts | High rate bins dominated by noise | Noise dominated (total time) | Noise dominated (detector-on time) | Marked lightcurve |
|---|---|---|---|---|---|---|---|
| A | 14834 | 13395 | 0 | 0 | 0.00% | 0.00% |  |
| B | 14835 | 13395 | 6 | 6 | 0.04% | 0.04% |  |
| C | 14835 | 13395 | 12 | 12 | 0.08% | 0.09% |  |
| D | 14835 | 13396 | 71 | 71 | 0.48% | 0.53% |  |
Top three noisy pixels from each quadrant. If the there are fewer than three noisy pixels in the level2.evt file, extra rows are filled as -1
| Pixel properties | Quadrant properties | ||||||
|---|---|---|---|---|---|---|---|
| Quadrant | DetID | PixID | Counts | Sigma | Mean | Median | Sigma |
| A | 13 | 254 | 20174 | 55.86 | 1651 | 1619 | 332.2 |
| A | 8 | 192 | 17969 | 49.22 | 1651 | 1619 | 332.2 |
| A | 3 | 137 | 16627 | 45.18 | 1651 | 1619 | 332.2 |
| B | 10 | 245 | 65610 | 202.05 | 1629 | 1582 | 316.9 |
| B | 12 | 111 | 40529 | 122.9 | 1629 | 1582 | 316.9 |
| B | 11 | 111 | 36963 | 111.65 | 1629 | 1582 | 316.9 |
| C | 14 | 238 | 250633 | 675.95 | 1571 | 1581 | 368.5 |
| C | 2 | 16 | 74570 | 198.1 | 1571 | 1581 | 368.5 |
| C | 3 | 233 | 21414 | 53.83 | 1571 | 1581 | 368.5 |
| D | 8 | 195 | 1557393 | 4112.15 | 1595 | 1555 | 378.4 |
| D | 1 | 52 | 659990 | 1740.27 | 1595 | 1555 | 378.4 |
| D | 7 | 80 | 563209 | 1484.48 | 1595 | 1555 | 378.4 |
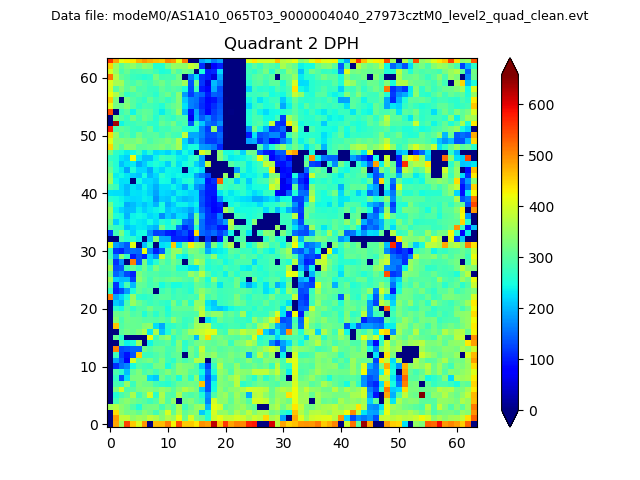
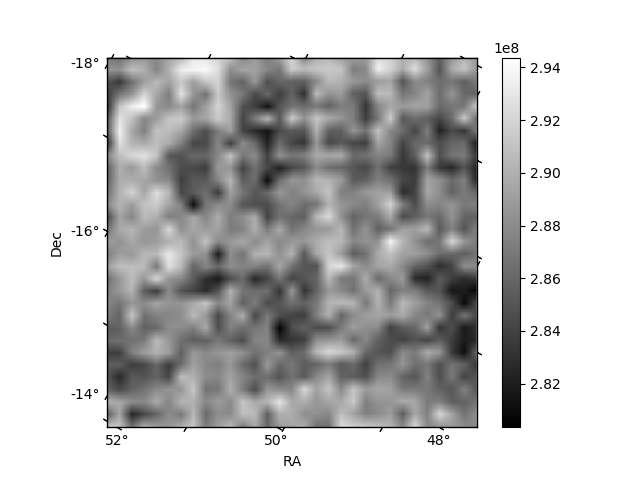
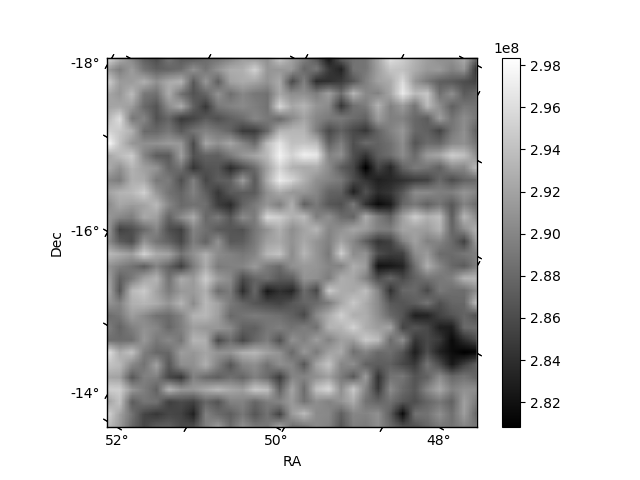
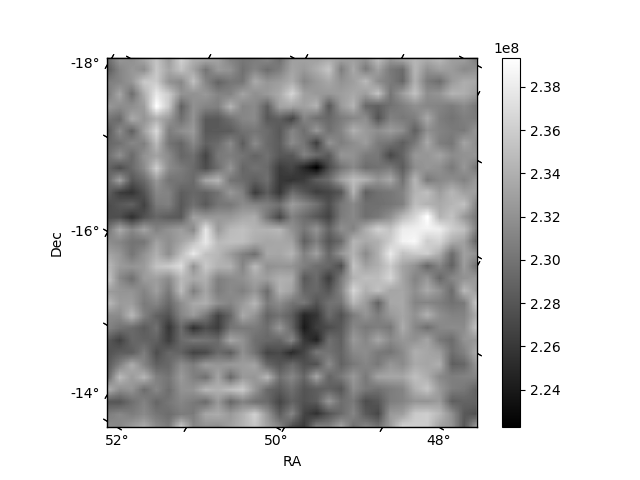
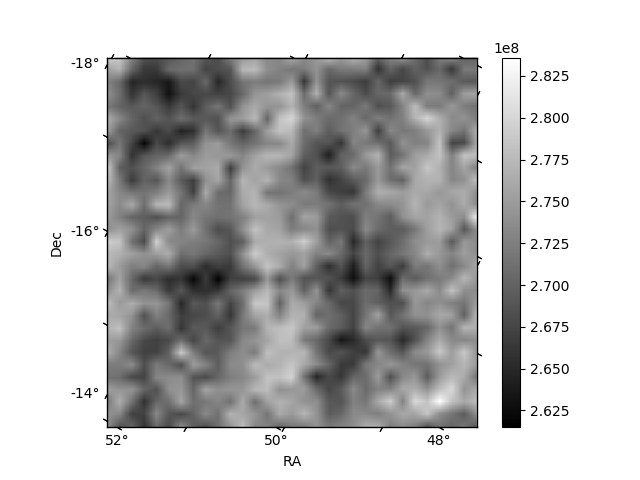
Histogram calculated using DETX and DETY for each event in the final _common_clean file
| Quadrant A | 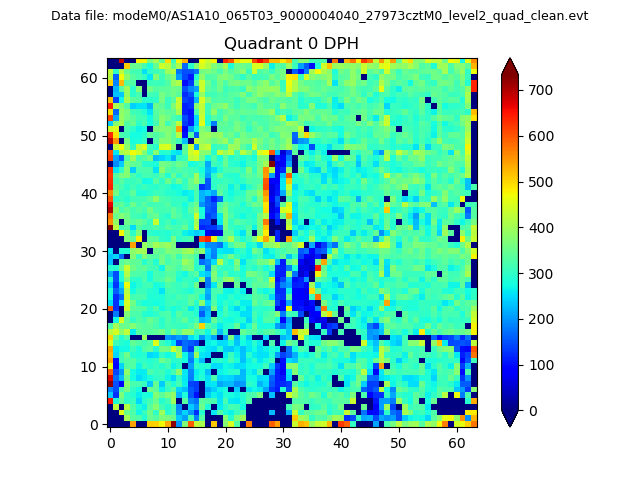 |
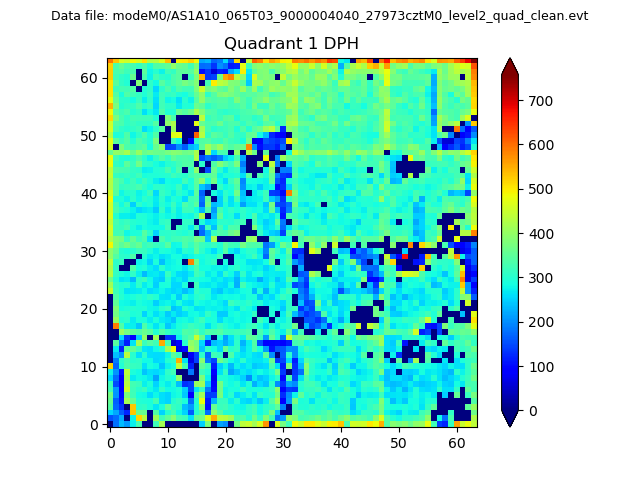 |
Quadrant B |
|---|---|---|---|
| Quadrant D | 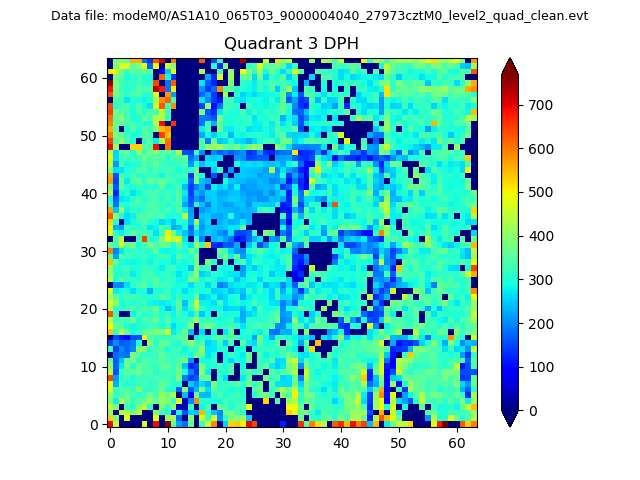 |
 |
Quadrant C |
| Plot type | Count rate plots | Images |
|---|---|---|
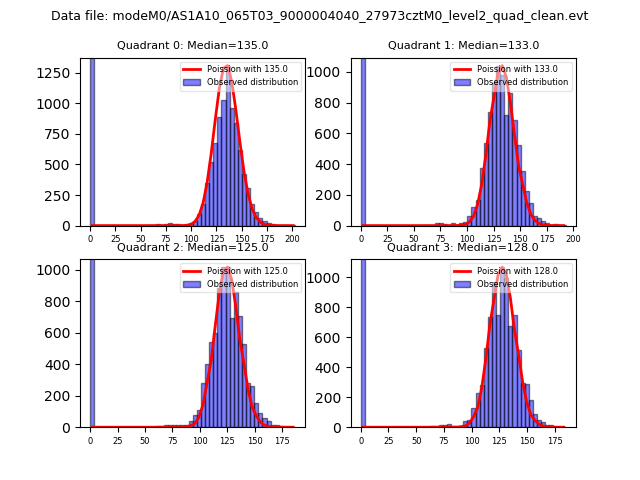
| Comparison with Poisson distribution Blue bars denote a histogram of data divided into 1 sec bins. Red curve is a Poisson curve with rate = median count rate of data. |
 |
 |
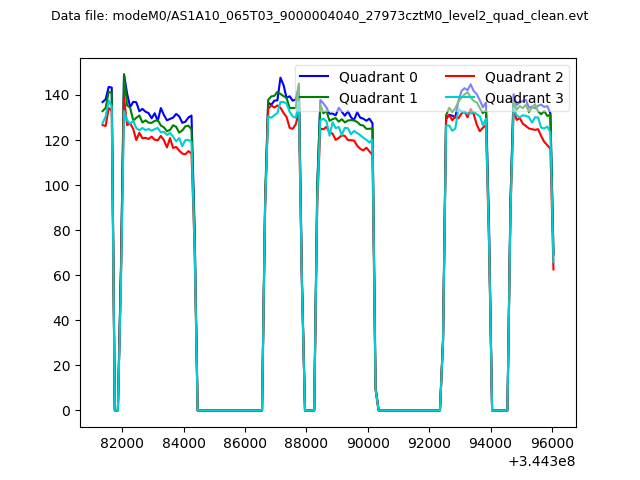
| Quadrant-wise count rates Data is divided into 100 sec bins |
 |
|
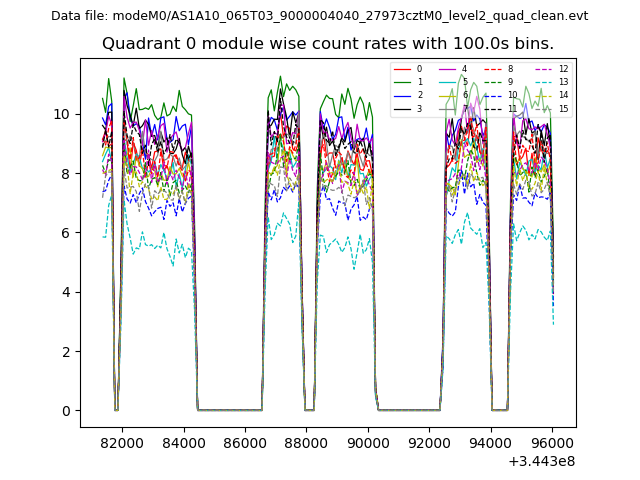
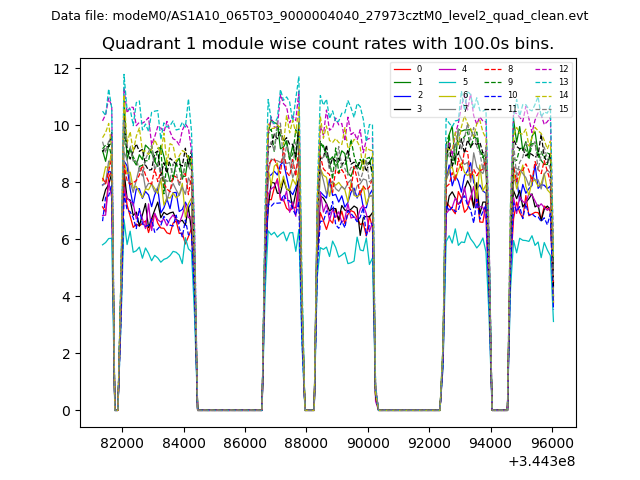
| Module-wise count rates for Quadrant A Data is divided into 100 sec bins |
 |
 |
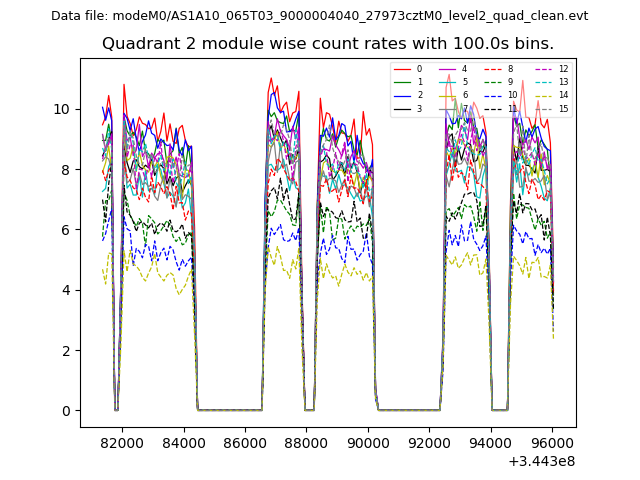
| Module-wise count rates for Quadrant B Data is divided into 100 sec bins |
 |
 |
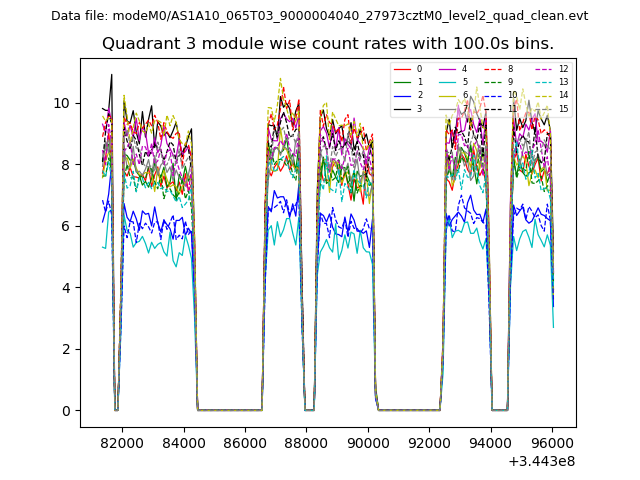
| Module-wise count rates for Quadrant C Data is divided into 100 sec bins |
 |
 |
| Module-wise count rates for Quadrant D Data is divided into 100 sec bins |
 |
 |
| Parameter | Plot |
|---|---|
| CZT HV Monitor | 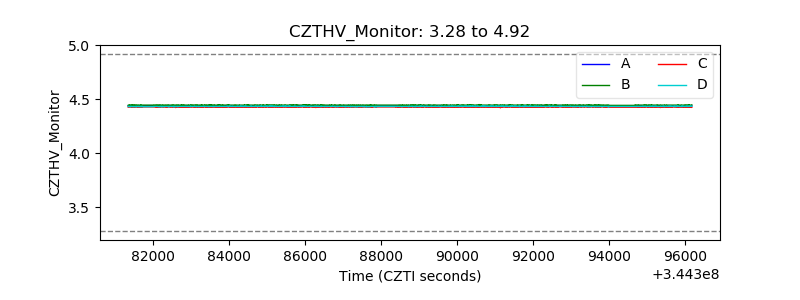 |
| D_VDD | 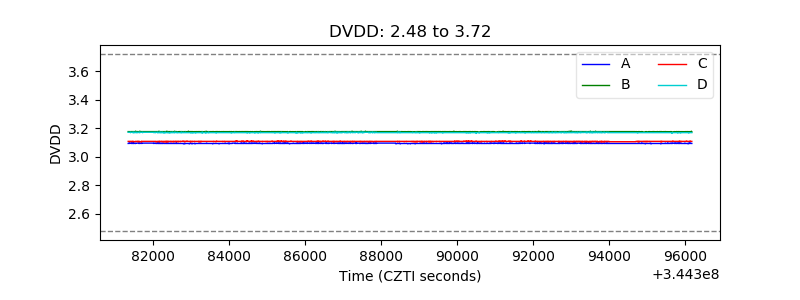 |
| Temperature 1 | 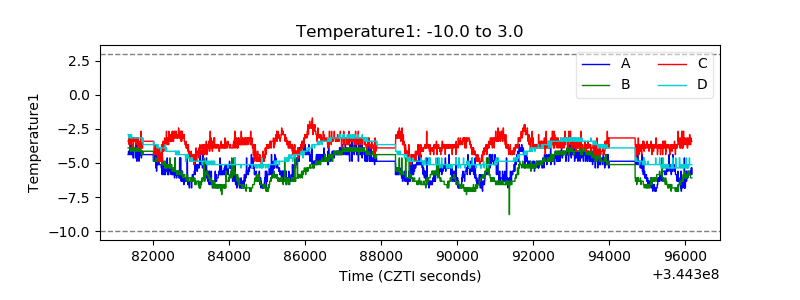 |
| Veto HV Monitor | 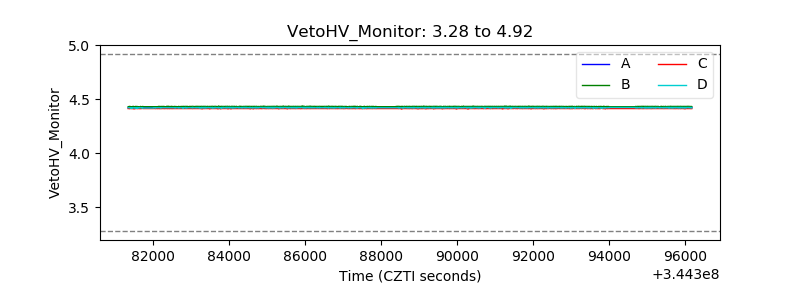 |
| Veto LLD | 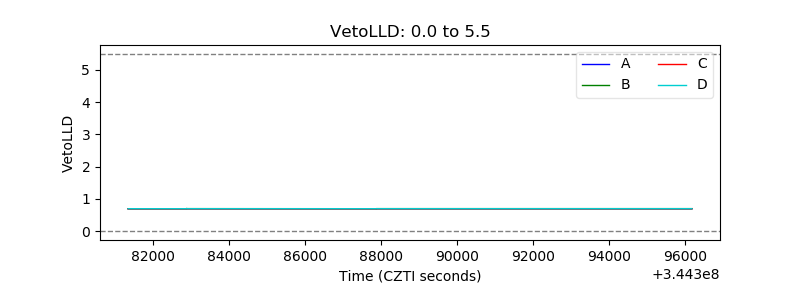 |
| Alpha Counter |  |
| _CPM_Rate | 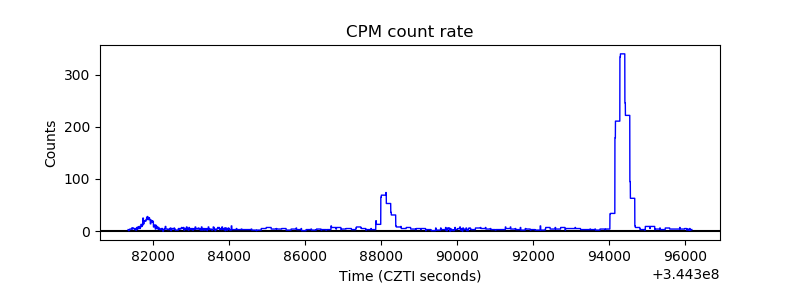 |
| CZT Counter | 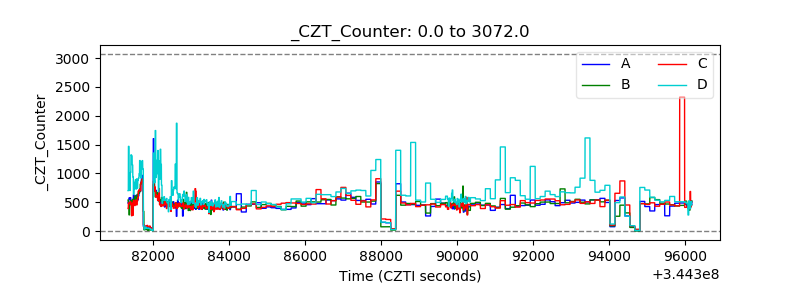 |
| +2.5 Volts monitor |  |
| +5 Volts monitor |  |
| _ROLL_ROT | 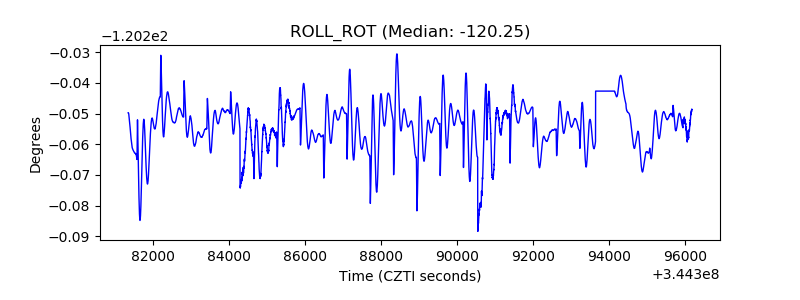 |
| _Roll_DEC | 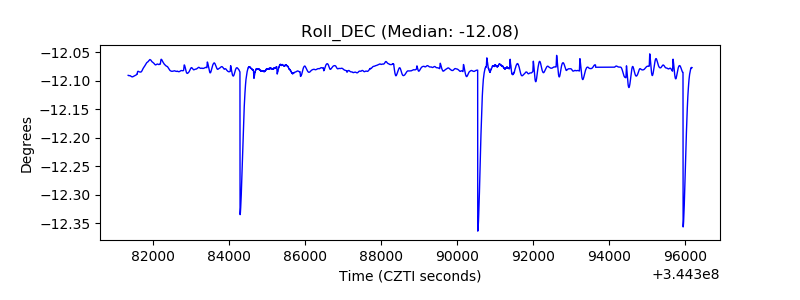 |
| _Roll_RA | 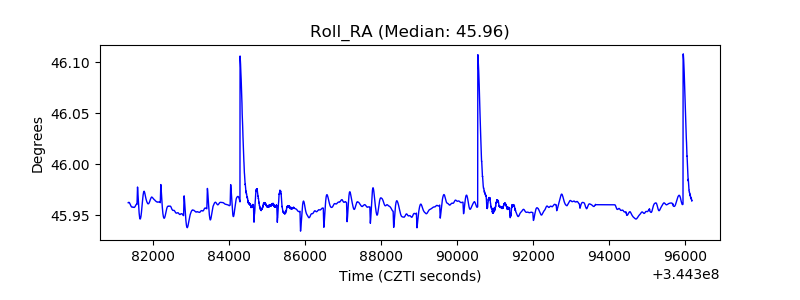 |
| Veto Counter | 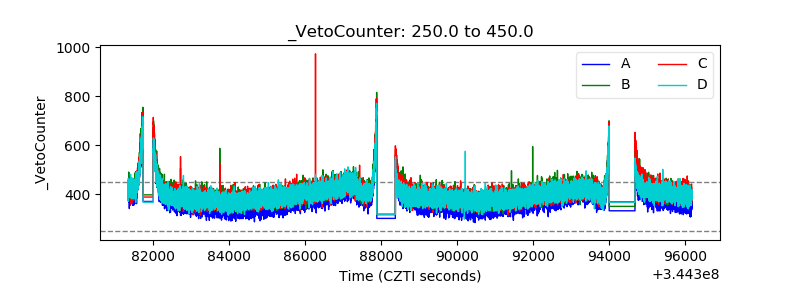 |