| Param | Original file | Final file |
|---|---|---|
| Filename | modeM0/AS1A10_065T03_9000004040_27974cztM0_level2.evt | modeM0/AS1A10_065T03_9000004040_27974cztM0_level2_quad_clean.evt |
| Size (bytes) | 496,146,240 | 89,424,000 |
| Size | 473.2 MB | 85.3 MB |
| Events in quadrant A | 3,286,227 | 578,878 |
| Events in quadrant B | 3,416,873 | 569,674 |
| Events in quadrant C | 3,362,751 | 538,431 |
| Events in quadrant D | 4,494,648 | 543,294 |
| Mode M9 | |||
|---|---|---|---|
| Quadrant | BADHDUFLAG | Total packets | Discarded packets |
| A | 0 | 16 | 0 |
| B | 0 | 16 | 0 |
| C | 0 | 16 | 0 |
| D | 0 | 16 | 0 |
| Mode M0 | |||
|---|---|---|---|
| Quadrant | BADHDUFLAG | Total packets | Discarded packets |
| A | 0 | 13971 | 0 |
| B | 0 | 14439 | 0 |
| C | 0 | 14107 | 0 |
| D | 0 | 17857 | 0 |
| Quadrant | Total seconds | Saturated seconds | Saturation percentage |
|---|---|---|---|
| A | 6860 | 33 | 0.481050% |
| B | 6860 | 54 | 0.787172% |
| C | 6860 | 92 | 1.341108% |
| D | 6860 | 87 | 1.268222% |
Noise dominated data is calculated using 1-second bins in cleaned event files. If a bin has >2000 counts, and if more than 50% of those come from <1% of pixels, then it is considered to be noise-dominated and hence unusable.
| Quadrant | # 1 sec bins | Bins with >0 counts | Bins with >2000 counts | High rate bins dominated by noise | Noise dominated (total time) | Noise dominated (detector-on time) | Marked lightcurve |
|---|---|---|---|---|---|---|---|
| A | 8390 | 6861 | 1 | 1 | 0.01% | 0.01% | 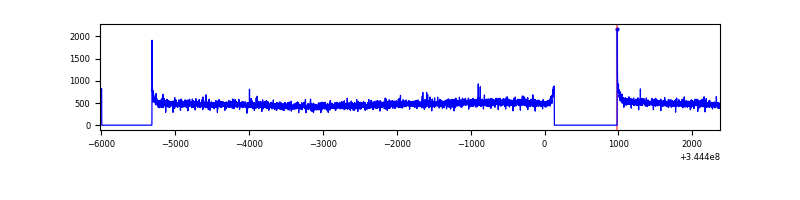 |
| B | 8390 | 6860 | 1 | 1 | 0.01% | 0.01% | 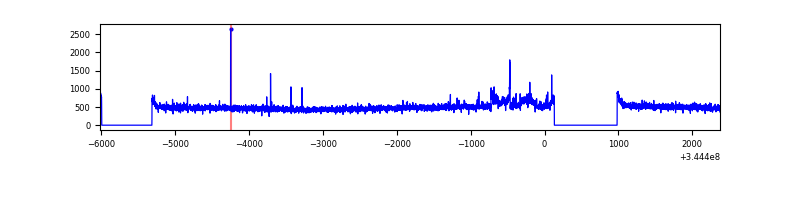 |
| C | 8390 | 6860 | 12 | 12 | 0.14% | 0.17% | 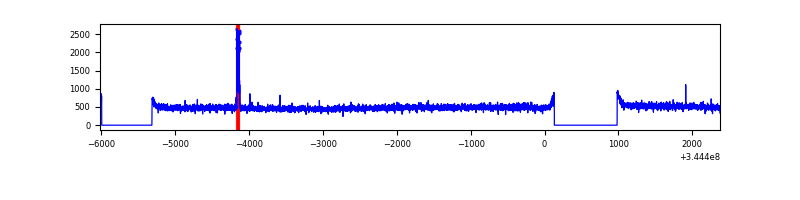 |
| D | 8390 | 6860 | 35 | 35 | 0.42% | 0.51% | 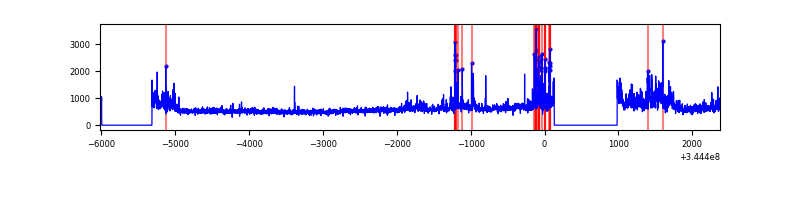 |
Top three noisy pixels from each quadrant. If the there are fewer than three noisy pixels in the level2.evt file, extra rows are filled as -1
| Pixel properties | Quadrant properties | ||||||
|---|---|---|---|---|---|---|---|
| Quadrant | DetID | PixID | Counts | Sigma | Mean | Median | Sigma |
| A | 8 | 192 | 11285 | 61.0 | 847 | 829 | 171.4 |
| A | 13 | 254 | 10771 | 58.01 | 847 | 829 | 171.4 |
| A | 6 | 16 | 9151 | 48.55 | 847 | 829 | 171.4 |
| B | 10 | 245 | 108767 | 663.63 | 837 | 814 | 162.7 |
| B | 12 | 111 | 20485 | 120.93 | 837 | 814 | 162.7 |
| B | 11 | 111 | 18922 | 111.32 | 837 | 814 | 162.7 |
| C | 14 | 238 | 129057 | 667.82 | 813 | 818 | 192.0 |
| C | 2 | 16 | 51760 | 265.29 | 813 | 818 | 192.0 |
| C | 3 | 233 | 16924 | 83.87 | 813 | 818 | 192.0 |
| D | 8 | 195 | 792147 | 4070.57 | 820 | 799 | 194.4 |
| D | 1 | 52 | 400211 | 2054.51 | 820 | 799 | 194.4 |
| D | 7 | 80 | 182384 | 934.04 | 820 | 799 | 194.4 |
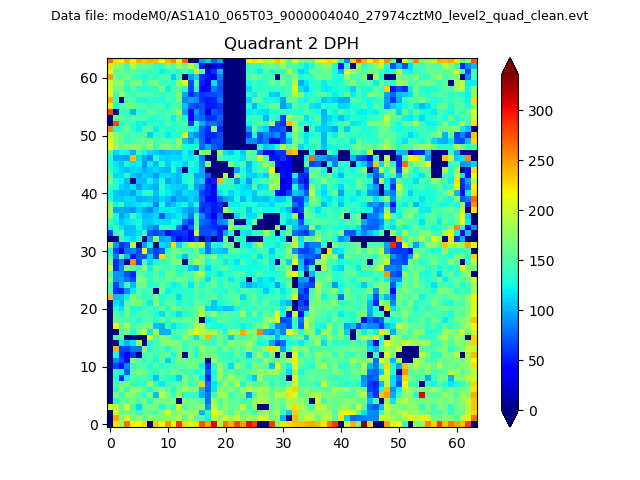
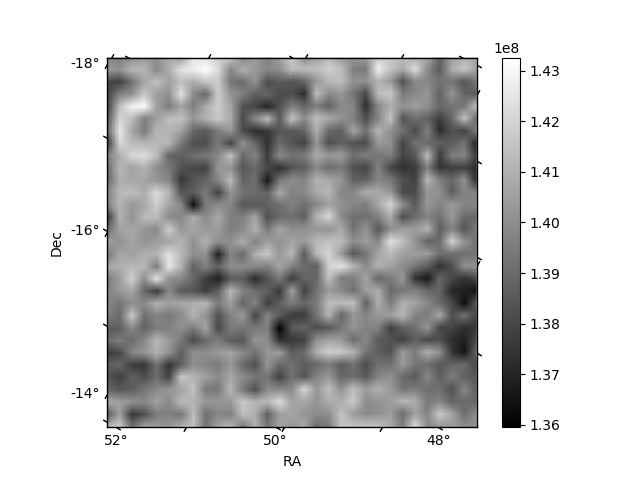
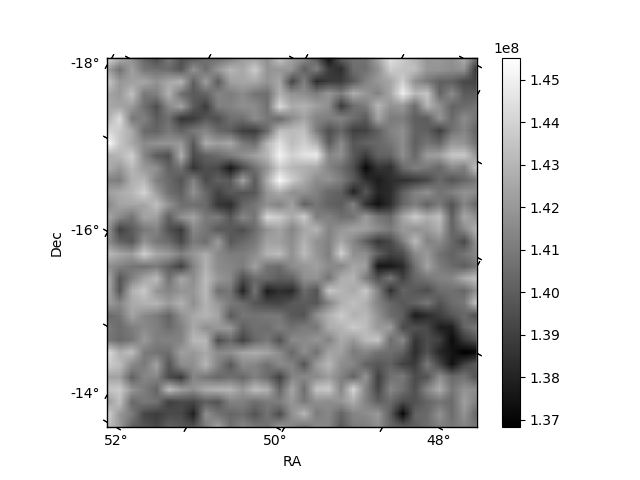
Histogram calculated using DETX and DETY for each event in the final _common_clean file
| Quadrant A | 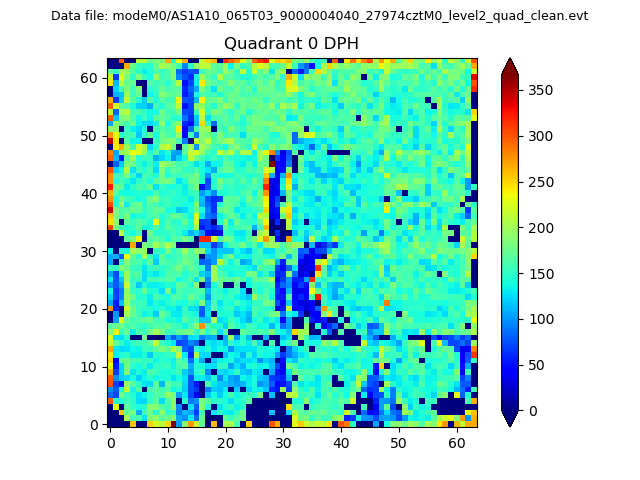 |
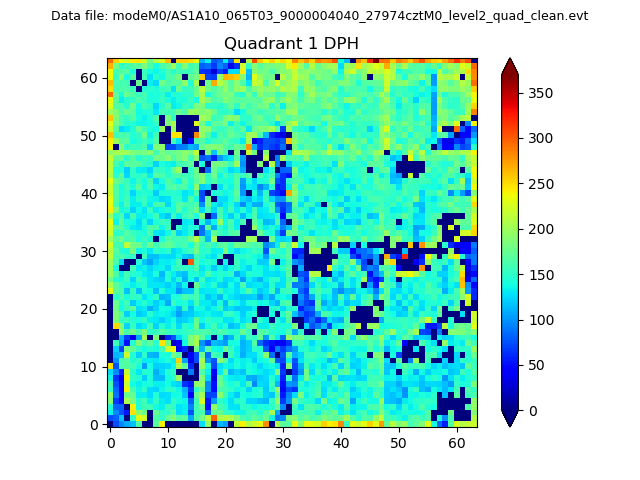 |
Quadrant B |
|---|---|---|---|
| Quadrant D | 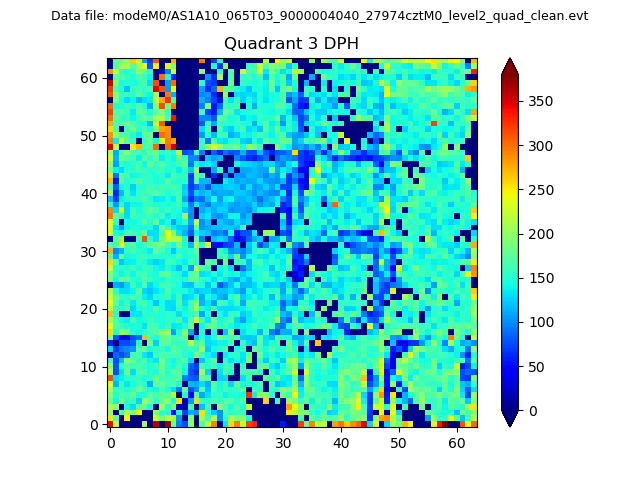 |
 |
Quadrant C |
| Plot type | Count rate plots | Images |
|---|---|---|
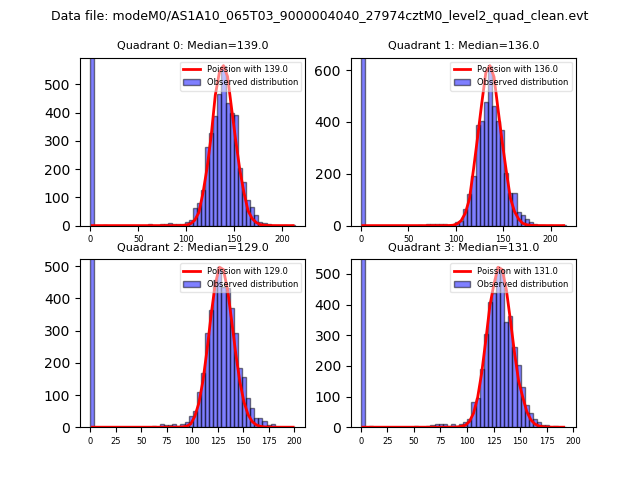
| Comparison with Poisson distribution Blue bars denote a histogram of data divided into 1 sec bins. Red curve is a Poisson curve with rate = median count rate of data. |
 |
 |
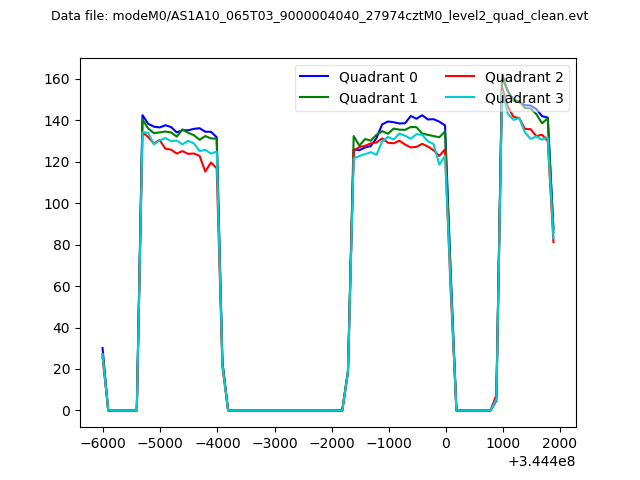
| Quadrant-wise count rates Data is divided into 100 sec bins |
 |
|
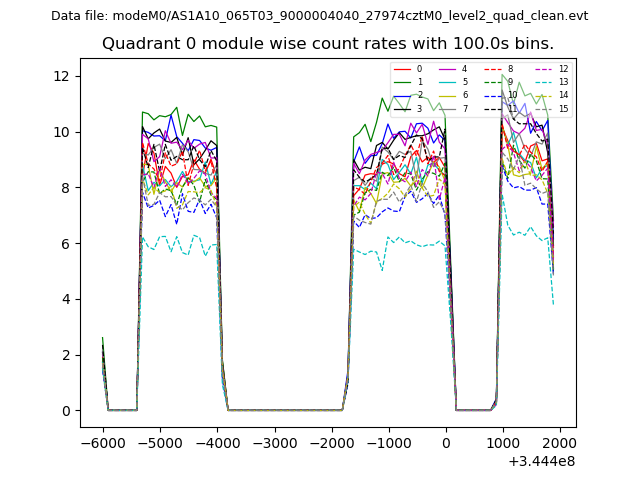
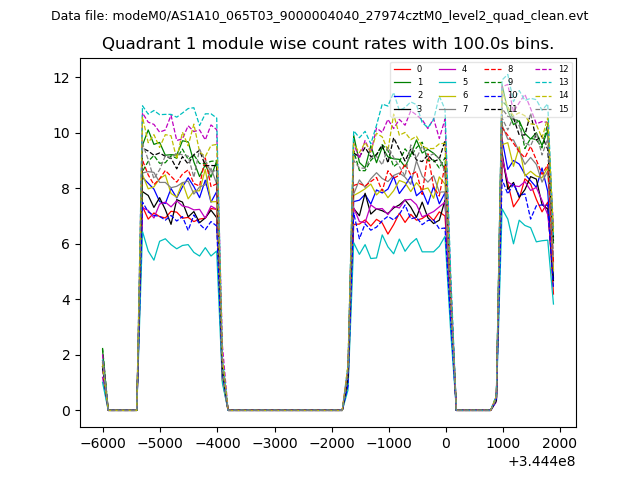
| Module-wise count rates for Quadrant A Data is divided into 100 sec bins |
 |
 |
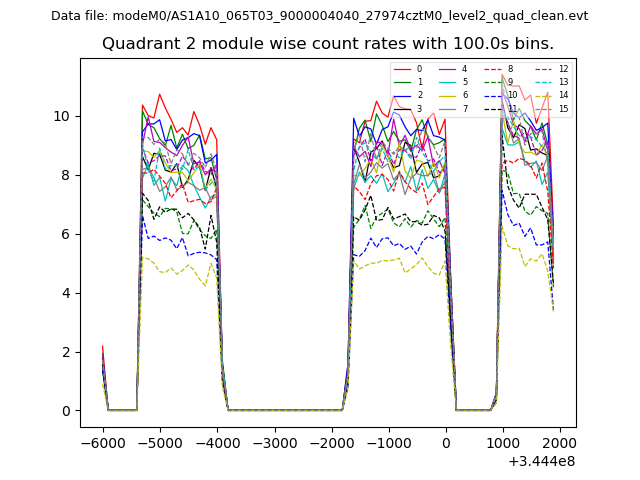
| Module-wise count rates for Quadrant B Data is divided into 100 sec bins |
 |
 |
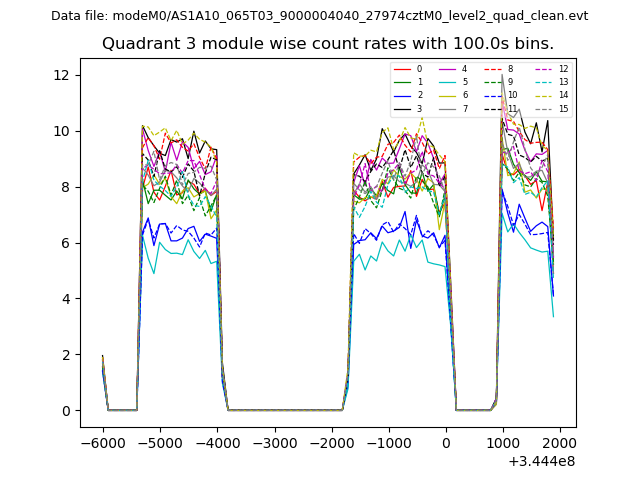
| Module-wise count rates for Quadrant C Data is divided into 100 sec bins |
 |
 |
| Module-wise count rates for Quadrant D Data is divided into 100 sec bins |
 |
 |
| Parameter | Plot |
|---|---|
| CZT HV Monitor | 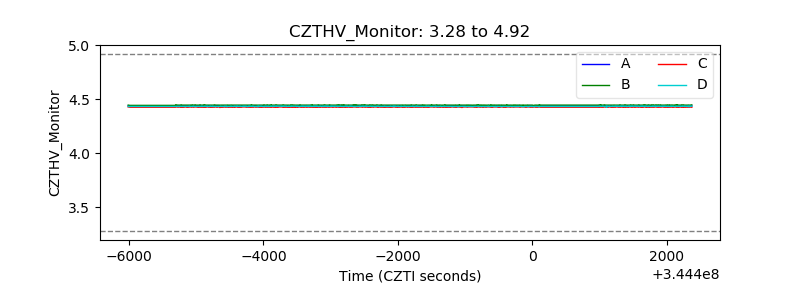 |
| D_VDD | 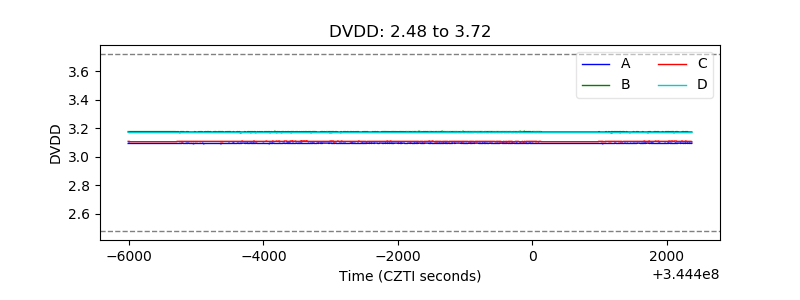 |
| Temperature 1 |  |
| Veto HV Monitor | 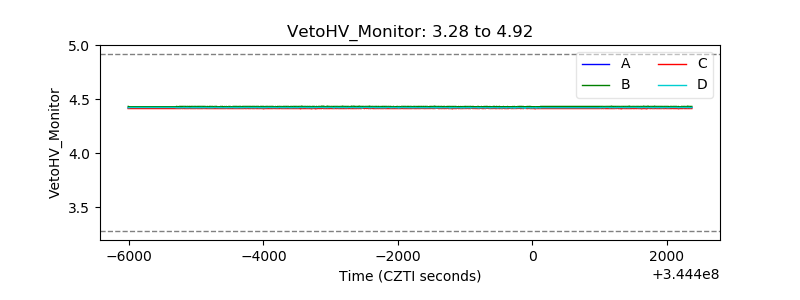 |
| Veto LLD | 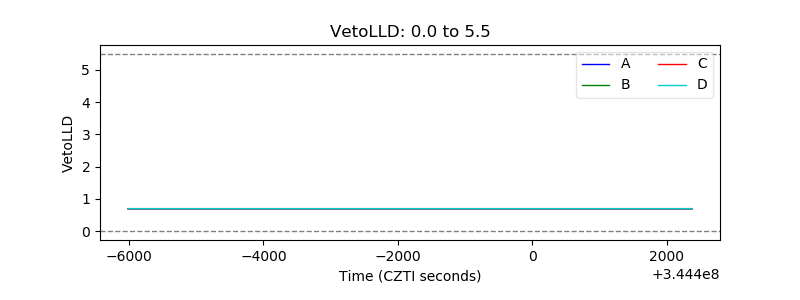 |
| Alpha Counter | 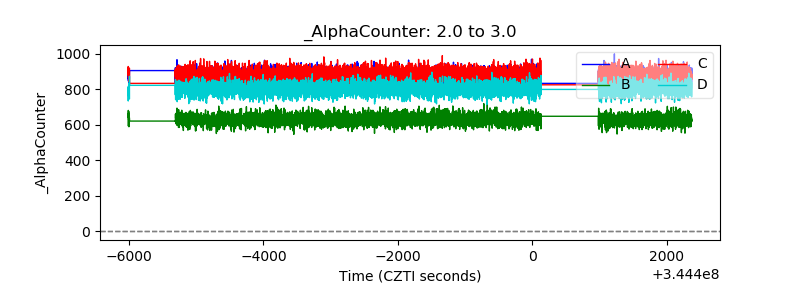 |
| _CPM_Rate | 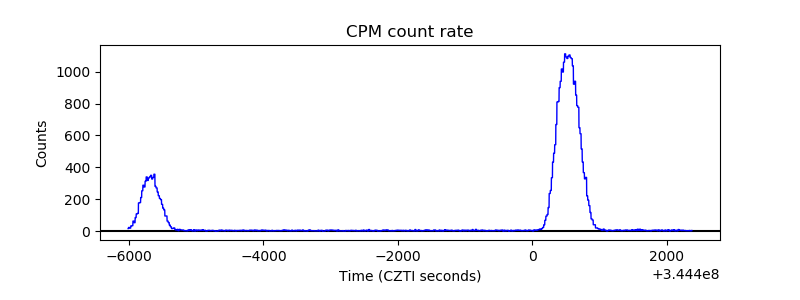 |
| CZT Counter | 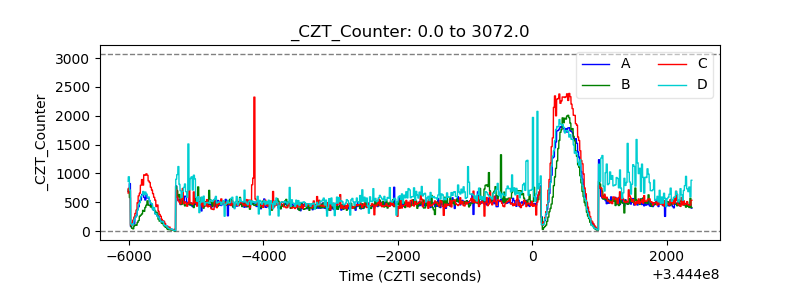 |
| +2.5 Volts monitor |  |
| +5 Volts monitor |  |
| _ROLL_ROT |  |
| _Roll_DEC |  |
| _Roll_RA | 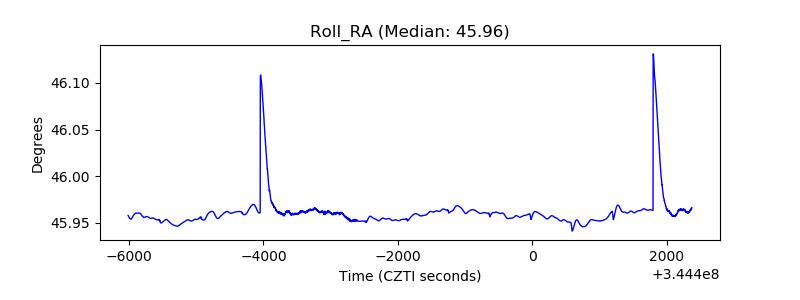 |
| Veto Counter | 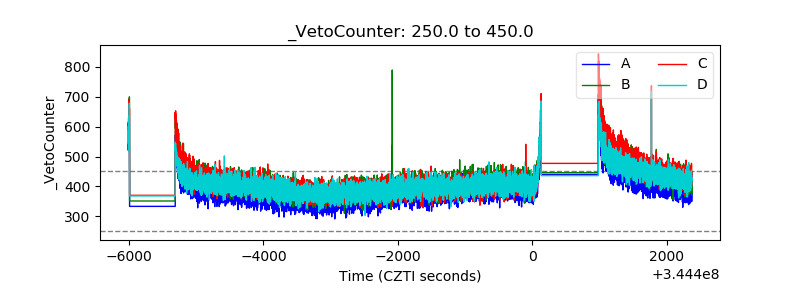 |