| Param | Original file | Final file |
|---|---|---|
| Filename | modeM0/AS1A10_065T03_9000004040_27975cztM0_level2.evt | modeM0/AS1A10_065T03_9000004040_27975cztM0_level2_quad_clean.evt |
| Size (bytes) | 545,705,280 | 90,529,920 |
| Size | 520.4 MB | 86.3 MB |
| Events in quadrant A | 3,541,178 | 580,444 |
| Events in quadrant B | 3,606,470 | 574,558 |
| Events in quadrant C | 3,659,874 | 543,222 |
| Events in quadrant D | 5,233,600 | 544,545 |
| Mode M9 | |||
|---|---|---|---|
| Quadrant | BADHDUFLAG | Total packets | Discarded packets |
| A | 0 | 20 | 0 |
| B | 0 | 20 | 0 |
| C | 0 | 20 | 0 |
| D | 0 | 20 | 0 |
| Mode M0 | |||
|---|---|---|---|
| Quadrant | BADHDUFLAG | Total packets | Discarded packets |
| A | 0 | 14839 | 0 |
| B | 0 | 15075 | 0 |
| C | 0 | 15210 | 0 |
| D | 0 | 20476 | 0 |
| Quadrant | Total seconds | Saturated seconds | Saturation percentage |
|---|---|---|---|
| A | 7174 | 47 | 0.655144% |
| B | 7175 | 65 | 0.905923% |
| C | 7175 | 102 | 1.421603% |
| D | 7174 | 184 | 2.564817% |
Noise dominated data is calculated using 1-second bins in cleaned event files. If a bin has >2000 counts, and if more than 50% of those come from <1% of pixels, then it is considered to be noise-dominated and hence unusable.
| Quadrant | # 1 sec bins | Bins with >0 counts | Bins with >2000 counts | High rate bins dominated by noise | Noise dominated (total time) | Noise dominated (detector-on time) | Marked lightcurve |
|---|---|---|---|---|---|---|---|
| A | 9039 | 7175 | 2 | 2 | 0.02% | 0.03% | 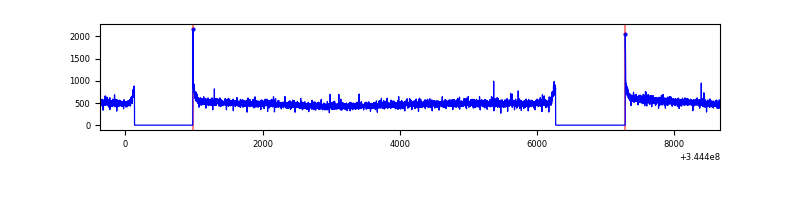 |
| B | 9040 | 7175 | 0 | 0 | 0.00% | 0.00% | 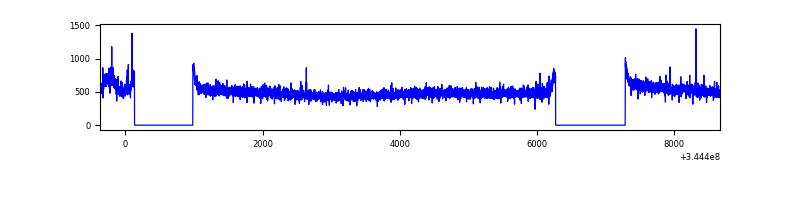 |
| C | 9040 | 7175 | 0 | 0 | 0.00% | 0.00% | 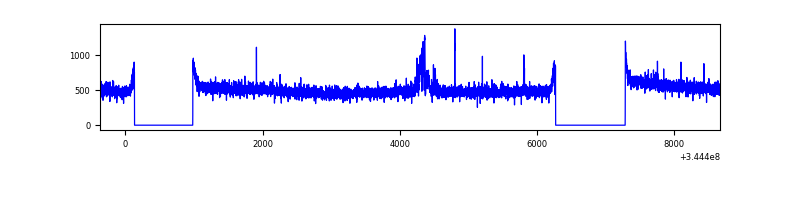 |
| D | 9039 | 7174 | 121 | 121 | 1.34% | 1.69% | 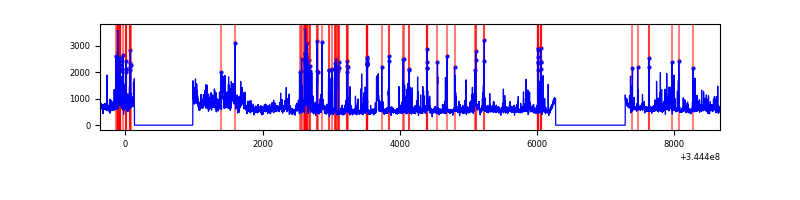 |
Top three noisy pixels from each quadrant. If the there are fewer than three noisy pixels in the level2.evt file, extra rows are filled as -1
| Pixel properties | Quadrant properties | ||||||
|---|---|---|---|---|---|---|---|
| Quadrant | DetID | PixID | Counts | Sigma | Mean | Median | Sigma |
| A | 8 | 192 | 11722 | 58.51 | 914 | 895 | 185.0 |
| A | 13 | 254 | 11048 | 54.87 | 914 | 895 | 185.0 |
| A | 3 | 137 | 8853 | 43.01 | 914 | 895 | 185.0 |
| B | 10 | 245 | 52840 | 296.79 | 906 | 883 | 175.1 |
| B | 12 | 111 | 21946 | 120.32 | 906 | 883 | 175.1 |
| B | 11 | 111 | 20071 | 109.61 | 906 | 883 | 175.1 |
| C | 14 | 238 | 141110 | 678.39 | 881 | 889 | 206.7 |
| C | 3 | 233 | 78408 | 375.04 | 881 | 889 | 206.7 |
| C | 2 | 16 | 10583 | 46.9 | 881 | 889 | 206.7 |
| D | 1 | 52 | 1040142 | 4946.16 | 885 | 864 | 210.1 |
| D | 8 | 195 | 797609 | 3791.89 | 885 | 864 | 210.1 |
| D | 7 | 80 | 44720 | 208.72 | 885 | 864 | 210.1 |
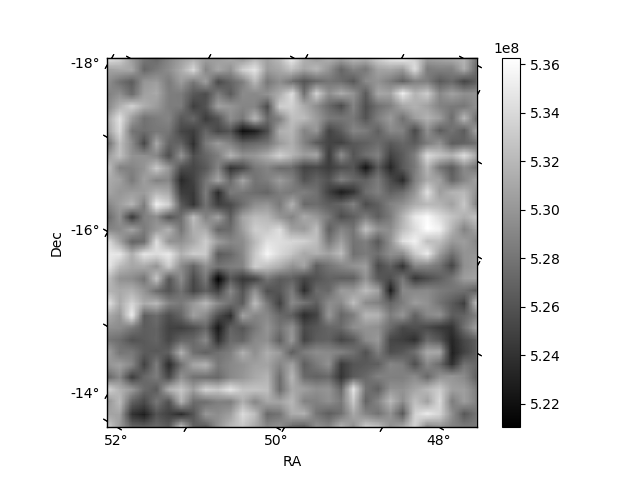
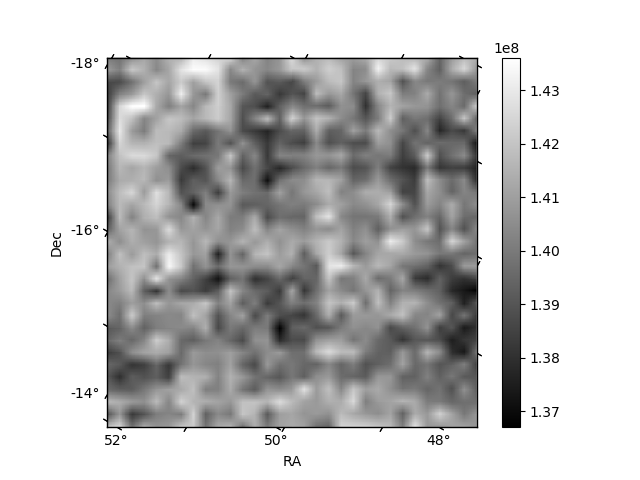
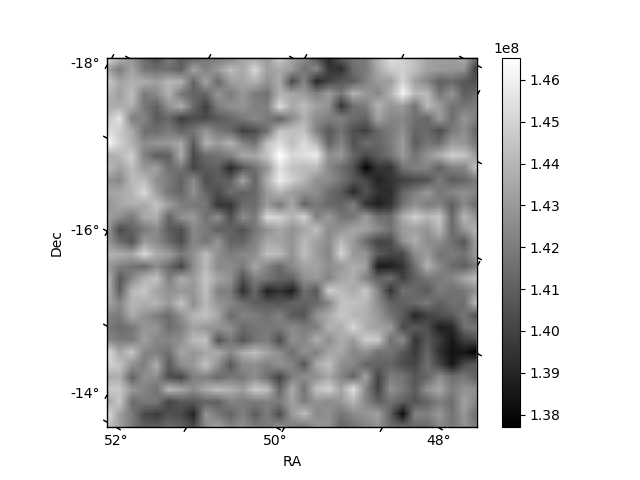
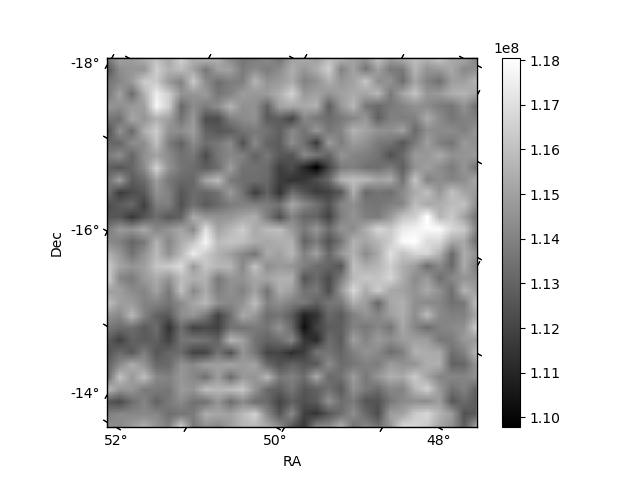
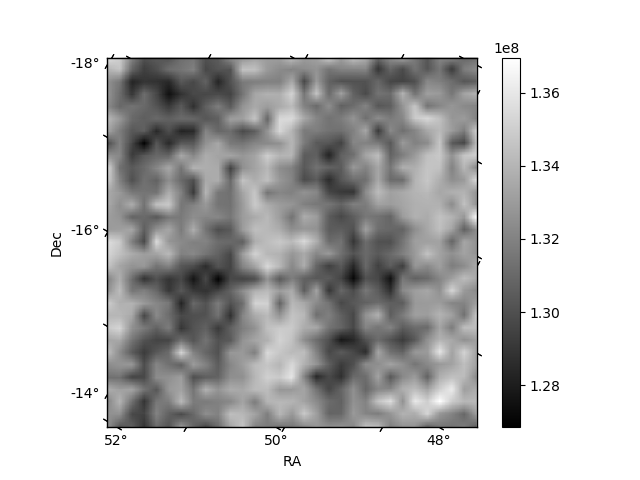
Histogram calculated using DETX and DETY for each event in the final _common_clean file
| Quadrant A | 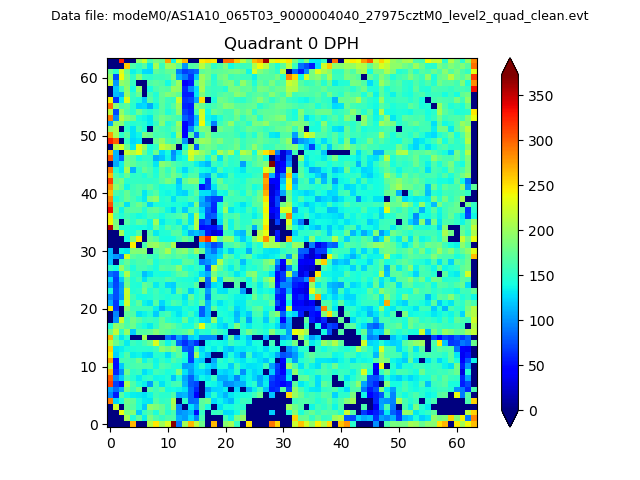 |
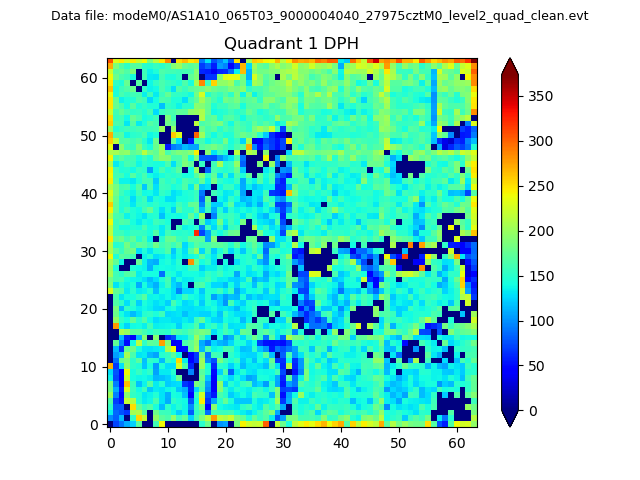 |
Quadrant B |
|---|---|---|---|
| Quadrant D | 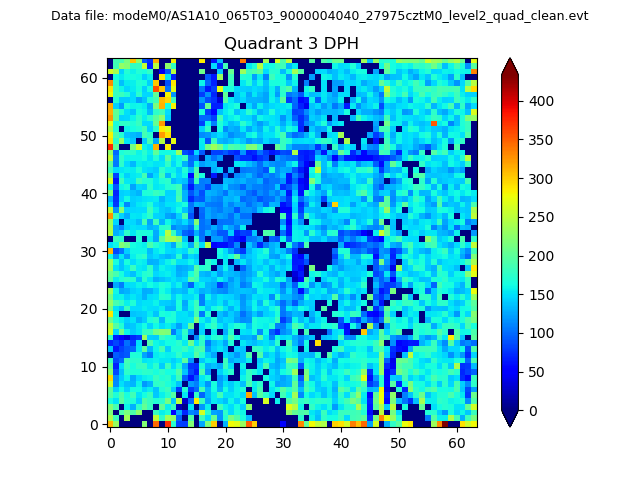 |
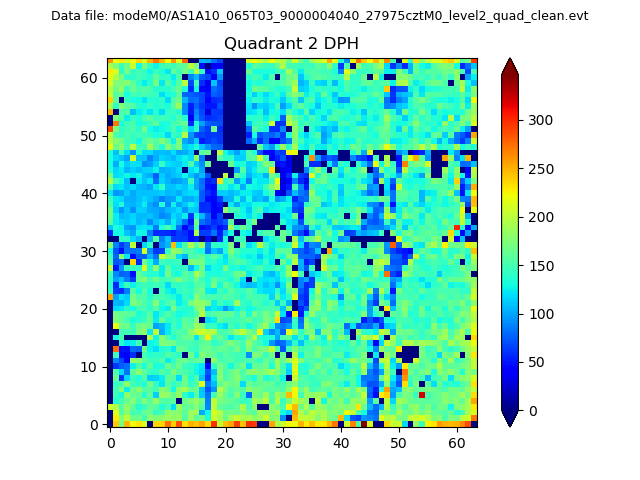 |
Quadrant C |
| Plot type | Count rate plots | Images |
|---|---|---|
| Comparison with Poisson distribution Blue bars denote a histogram of data divided into 1 sec bins. Red curve is a Poisson curve with rate = median count rate of data. |
 |
 |
| Quadrant-wise count rates Data is divided into 100 sec bins |
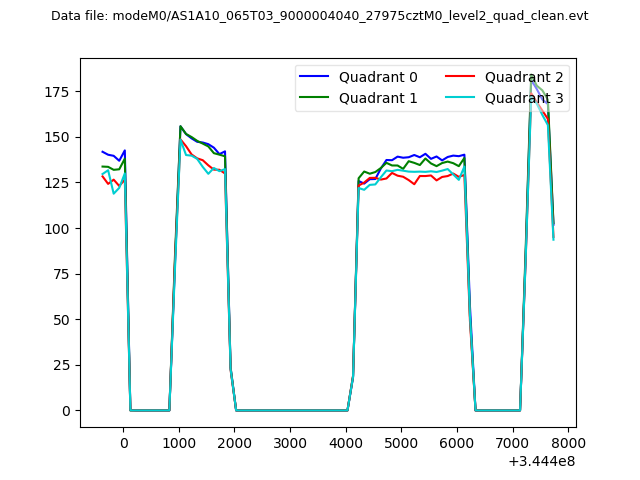 |
|
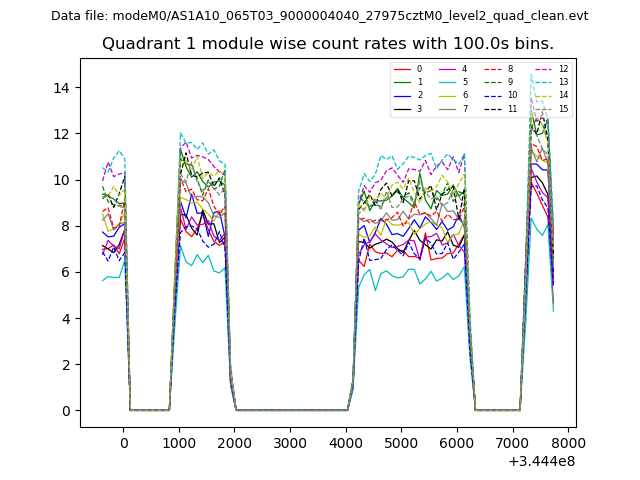
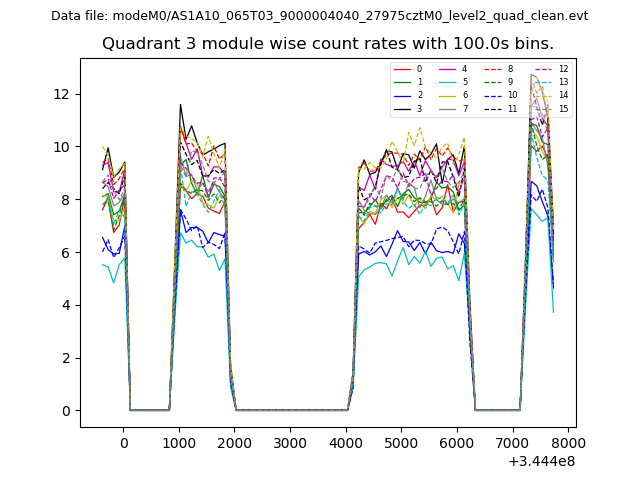
| Module-wise count rates for Quadrant A Data is divided into 100 sec bins |
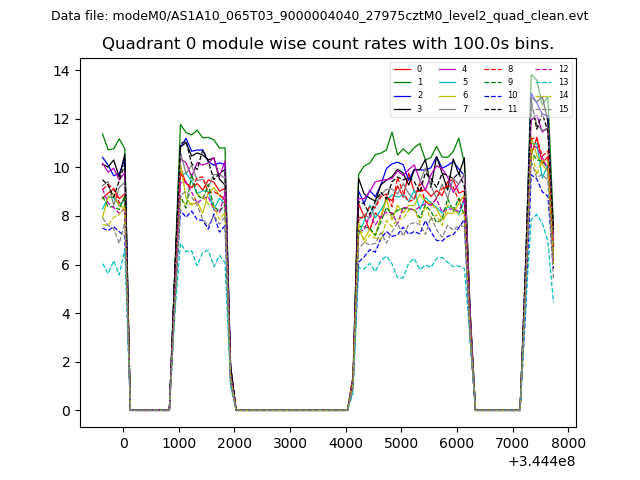 |
 |
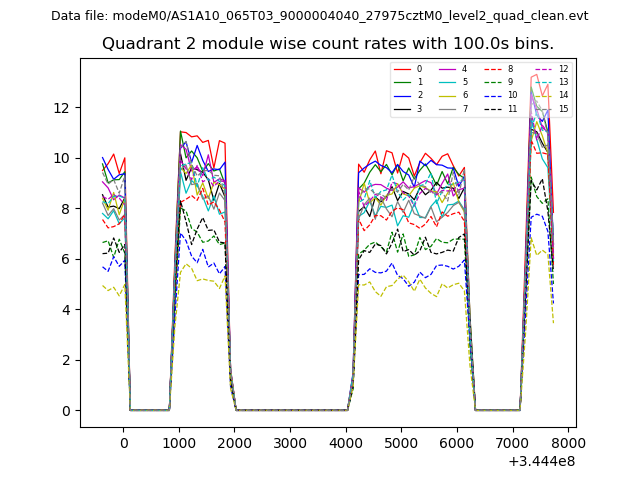
| Module-wise count rates for Quadrant B Data is divided into 100 sec bins |
 |
 |
| Module-wise count rates for Quadrant C Data is divided into 100 sec bins |
 |
 |
| Module-wise count rates for Quadrant D Data is divided into 100 sec bins |
 |
 |
| Parameter | Plot |
|---|---|
| CZT HV Monitor | 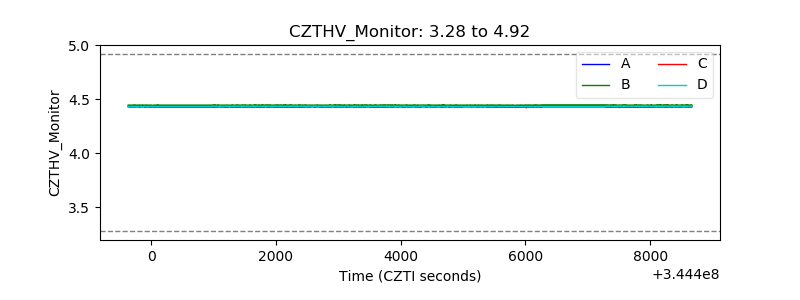 |
| D_VDD | 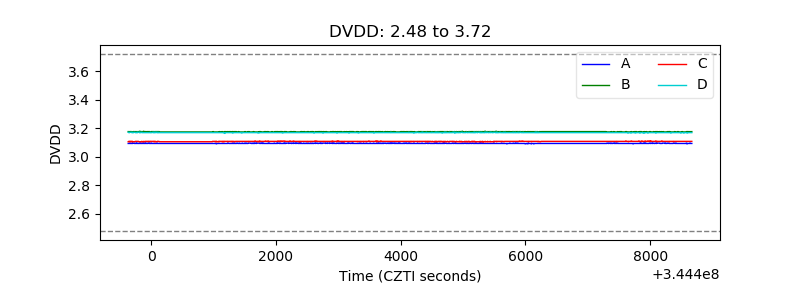 |
| Temperature 1 | 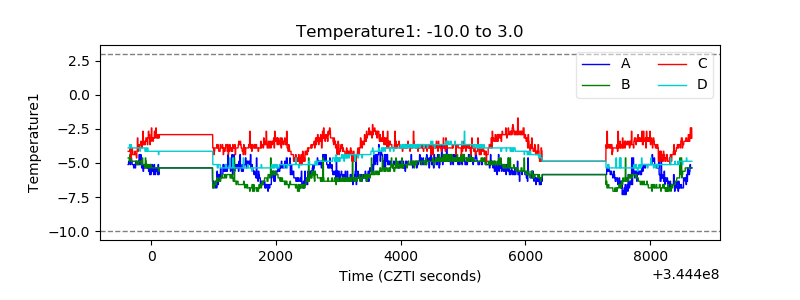 |
| Veto HV Monitor | 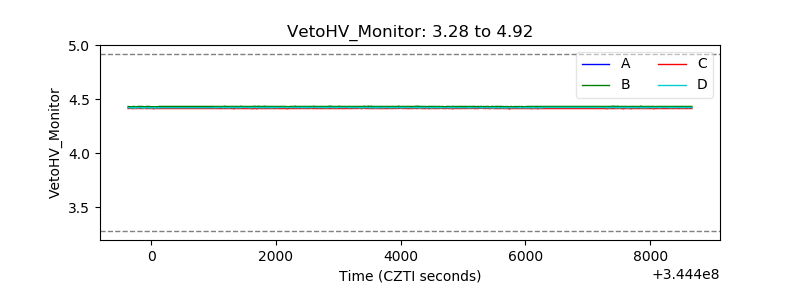 |
| Veto LLD | 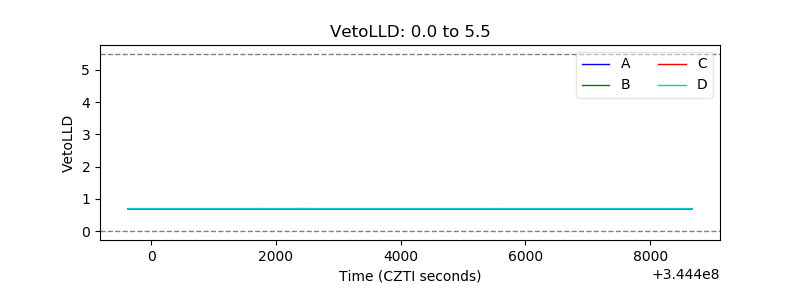 |
| Alpha Counter |  |
| _CPM_Rate | 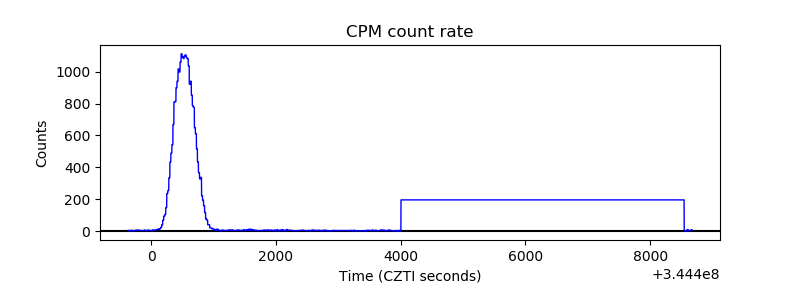 |
| CZT Counter | 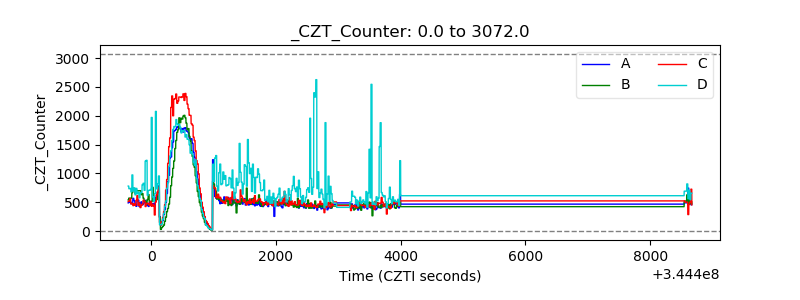 |
| +2.5 Volts monitor |  |
| +5 Volts monitor | 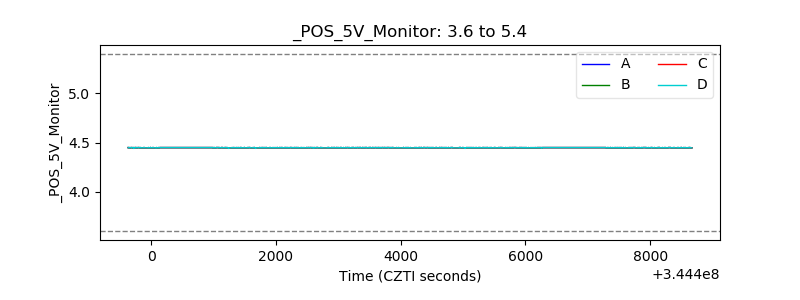 |
| _ROLL_ROT | 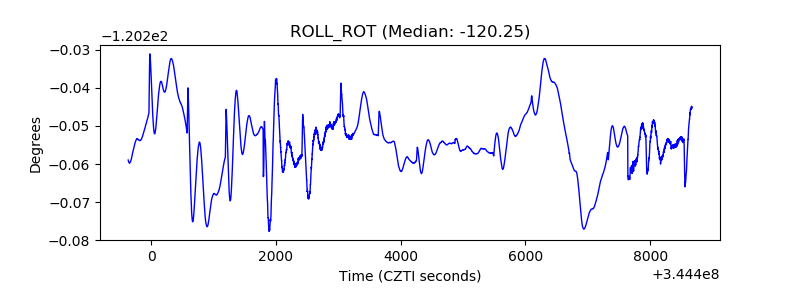 |
| _Roll_DEC | 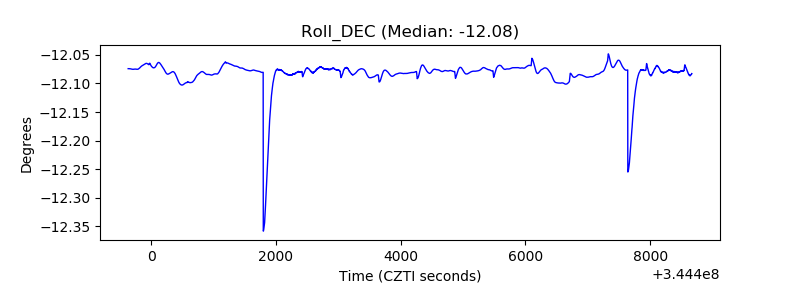 |
| _Roll_RA | 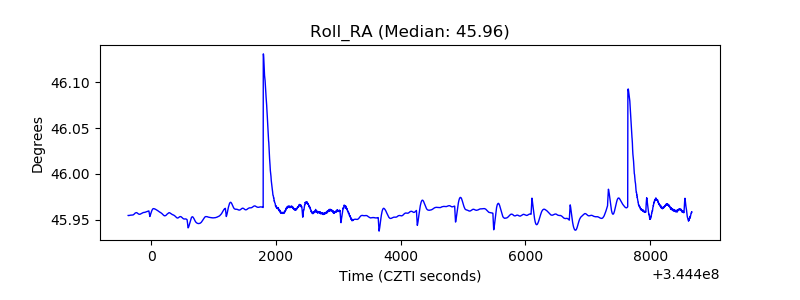 |
| Veto Counter | 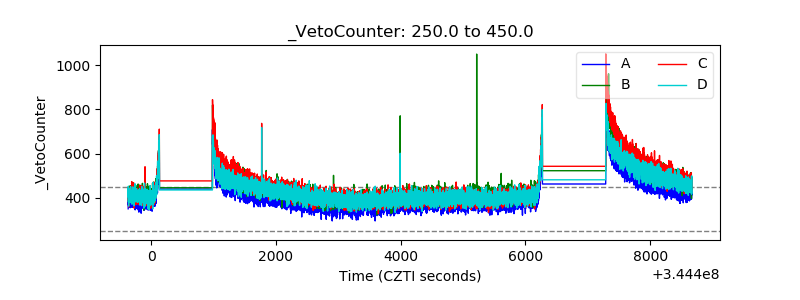 |