| Param | Original file | Final file |
|---|---|---|
| Filename | modeM0/AS1A10_065T03_9000004040_27977cztM0_level2.evt | modeM0/AS1A10_065T03_9000004040_27977cztM0_level2_quad_clean.evt |
| Size (bytes) | 531,544,320 | 70,407,360 |
| Size | 506.9 MB | 67.1 MB |
| Events in quadrant A | 3,303,224 | 435,883 |
| Events in quadrant B | 3,346,760 | 437,312 |
| Events in quadrant C | 4,401,182 | 405,143 |
| Events in quadrant D | 4,615,726 | 409,931 |
| Mode M9 | |||
|---|---|---|---|
| Quadrant | BADHDUFLAG | Total packets | Discarded packets |
| A | 0 | 17 | 0 |
| B | 0 | 18 | 0 |
| C | 0 | 18 | 0 |
| D | 0 | 18 | 0 |
| Mode M0 | |||
|---|---|---|---|
| Quadrant | BADHDUFLAG | Total packets | Discarded packets |
| A | 0 | 13718 | 0 |
| B | 0 | 13882 | 0 |
| C | 0 | 17145 | 0 |
| D | 0 | 18101 | 0 |
| Quadrant | Total seconds | Saturated seconds | Saturation percentage |
|---|---|---|---|
| A | 6358 | 56 | 0.880780% |
| B | 6358 | 77 | 1.211073% |
| C | 6358 | 553 | 8.697704% |
| D | 6358 | 198 | 3.114187% |
Noise dominated data is calculated using 1-second bins in cleaned event files. If a bin has >2000 counts, and if more than 50% of those come from <1% of pixels, then it is considered to be noise-dominated and hence unusable.
| Quadrant | # 1 sec bins | Bins with >0 counts | Bins with >2000 counts | High rate bins dominated by noise | Noise dominated (total time) | Noise dominated (detector-on time) | Marked lightcurve |
|---|---|---|---|---|---|---|---|
| A | 7483 | 6358 | 1 | 1 | 0.01% | 0.02% | 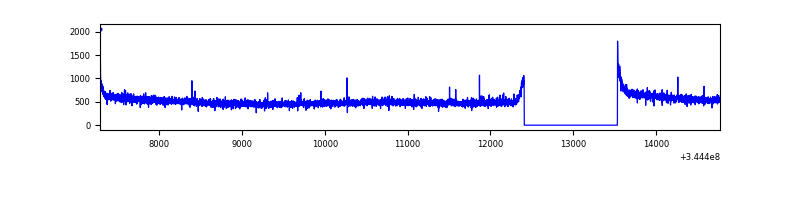 |
| B | 7483 | 6358 | 0 | 0 | 0.00% | 0.00% | 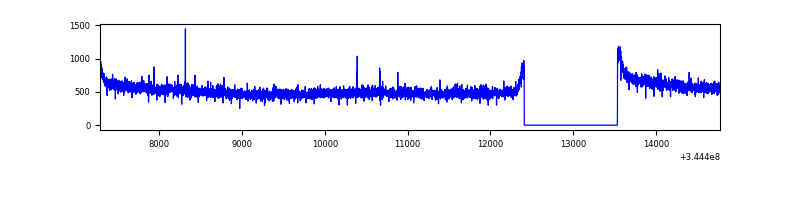 |
| C | 7483 | 6358 | 303 | 303 | 4.05% | 4.77% | 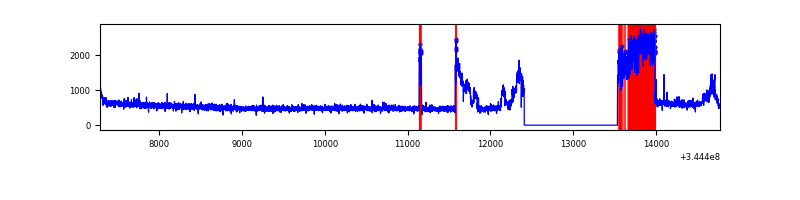 |
| D | 7483 | 6358 | 99 | 99 | 1.32% | 1.56% | 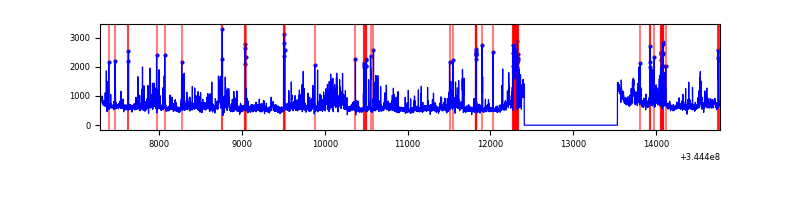 |
Top three noisy pixels from each quadrant. If the there are fewer than three noisy pixels in the level2.evt file, extra rows are filled as -1
| Pixel properties | Quadrant properties | ||||||
|---|---|---|---|---|---|---|---|
| Quadrant | DetID | PixID | Counts | Sigma | Mean | Median | Sigma |
| A | 8 | 192 | 9364 | 50.39 | 853 | 837 | 169.2 |
| A | 13 | 254 | 9173 | 49.26 | 853 | 837 | 169.2 |
| A | 3 | 137 | 8004 | 42.35 | 853 | 837 | 169.2 |
| B | 12 | 111 | 20066 | 119.87 | 851 | 831 | 160.5 |
| B | 11 | 111 | 18096 | 107.59 | 851 | 831 | 160.5 |
| B | 14 | 111 | 17802 | 105.76 | 851 | 831 | 160.5 |
| C | 2 | 16 | 1108282 | 5956.56 | 799 | 807 | 185.9 |
| C | 14 | 238 | 127748 | 682.75 | 799 | 807 | 185.9 |
| C | 3 | 233 | 54715 | 289.94 | 799 | 807 | 185.9 |
| D | 1 | 52 | 895138 | 4591.86 | 825 | 806 | 194.8 |
| D | 8 | 195 | 578794 | 2967.62 | 825 | 806 | 194.8 |
| D | 7 | 80 | 26011 | 129.41 | 825 | 806 | 194.8 |
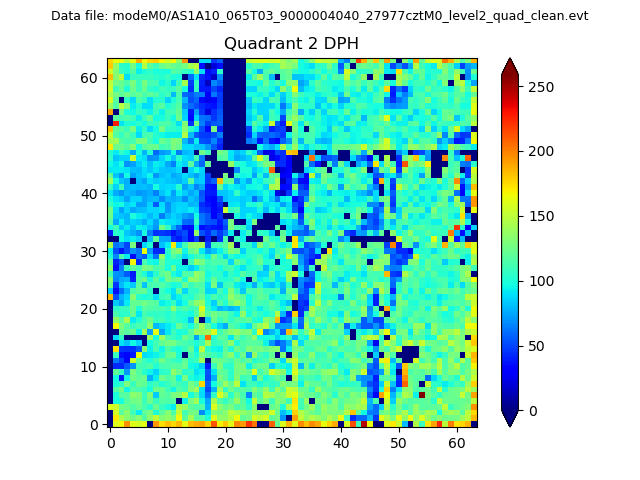
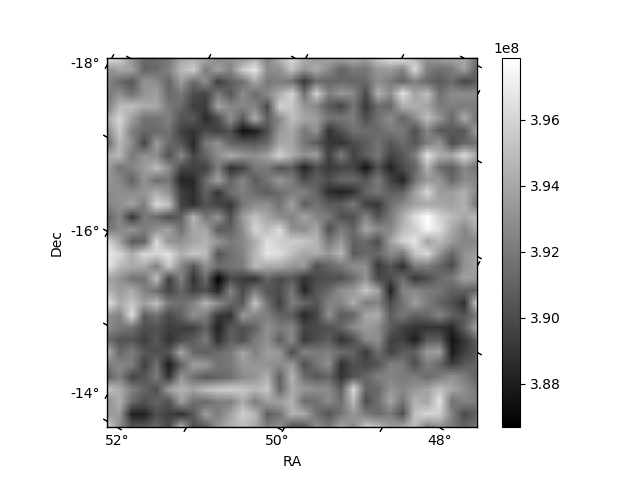
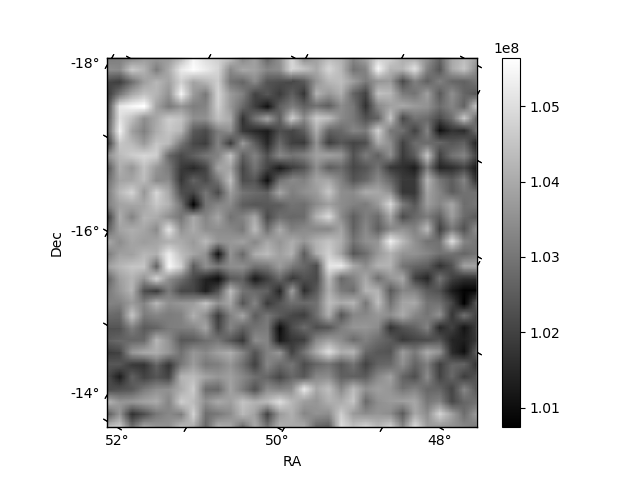
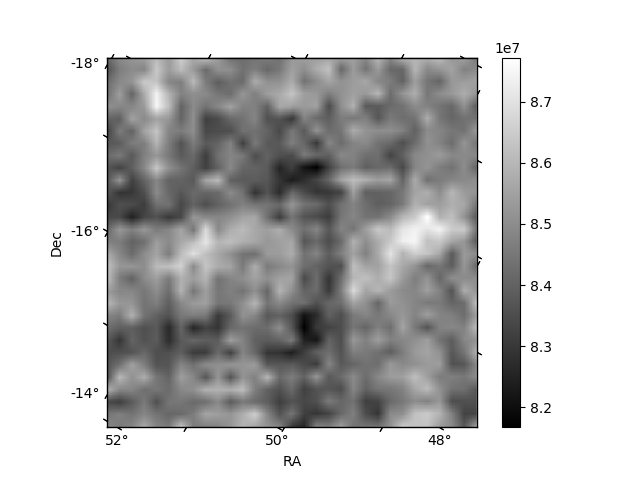
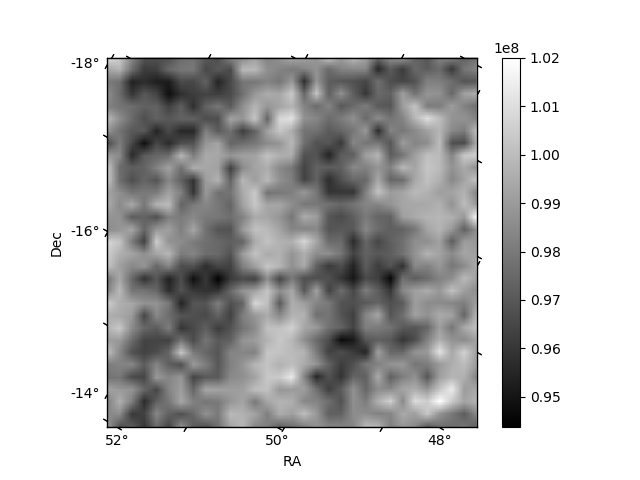
Histogram calculated using DETX and DETY for each event in the final _common_clean file
| Quadrant A | 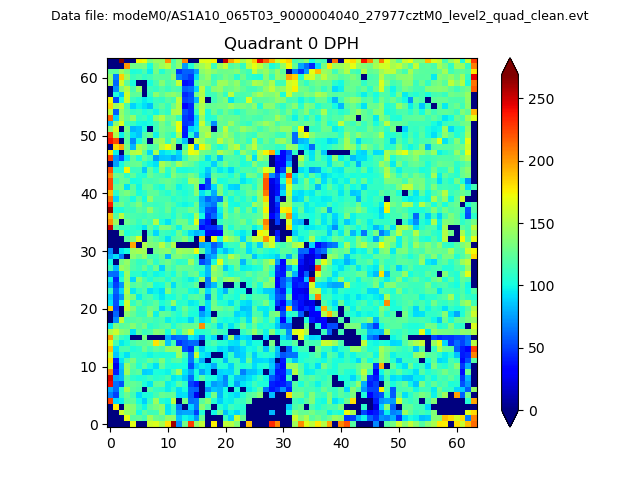 |
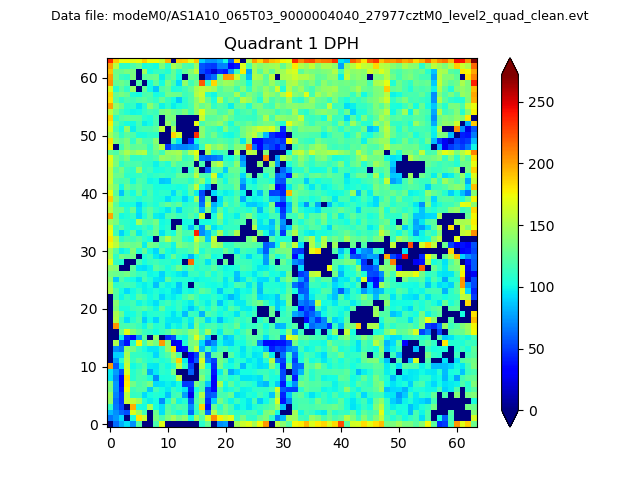 |
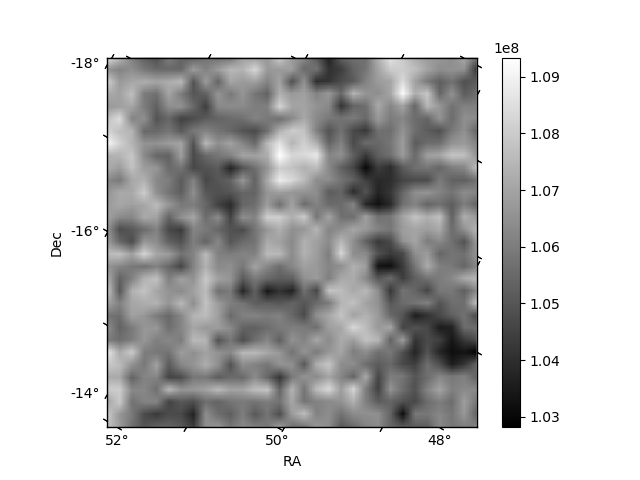
Quadrant B |
|---|---|---|---|
| Quadrant D | 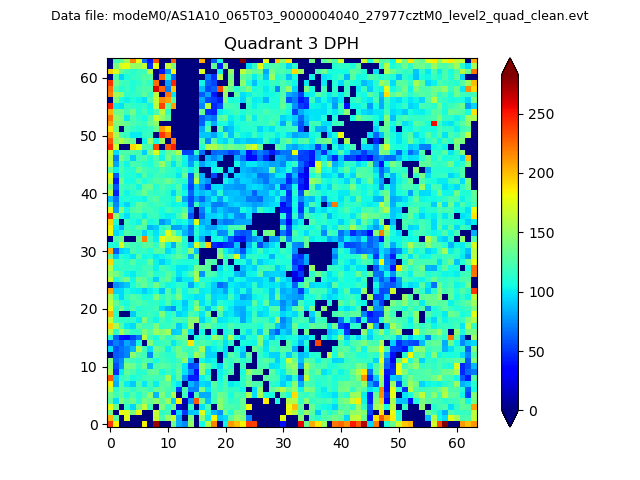 |
 |
Quadrant C |
| Plot type | Count rate plots | Images |
|---|---|---|
| Comparison with Poisson distribution Blue bars denote a histogram of data divided into 1 sec bins. Red curve is a Poisson curve with rate = median count rate of data. |
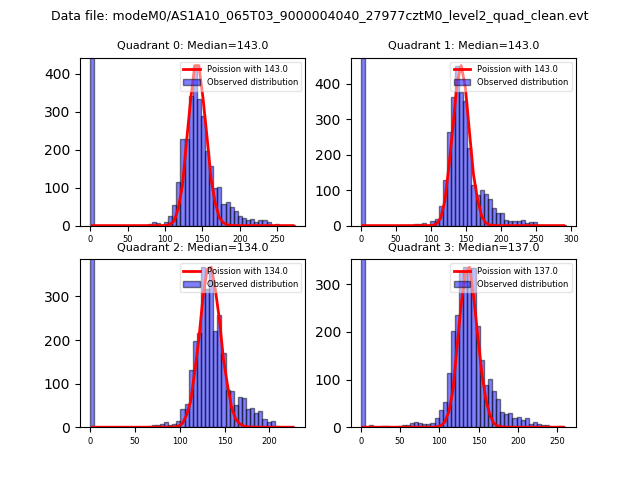 |
 |
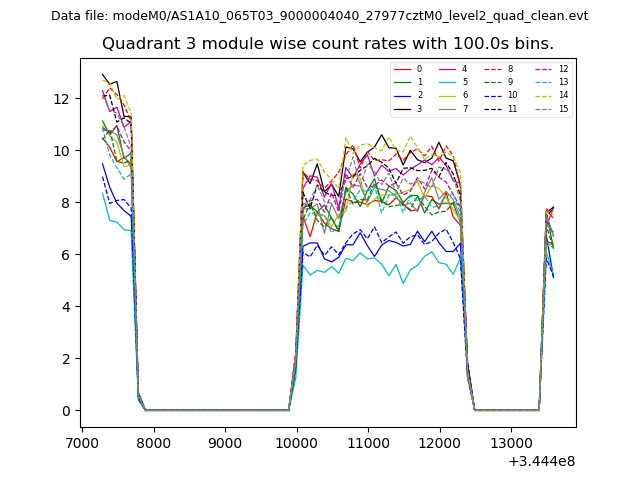
| Quadrant-wise count rates Data is divided into 100 sec bins |
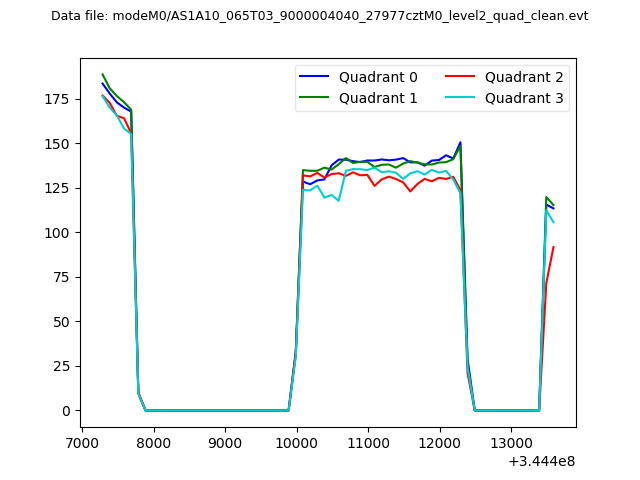 |
|
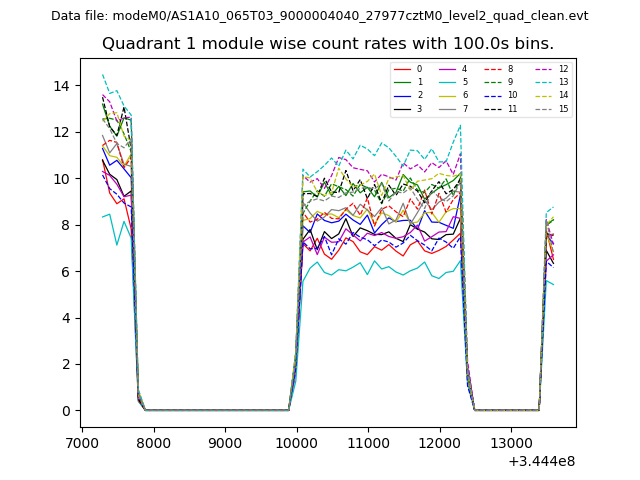
| Module-wise count rates for Quadrant A Data is divided into 100 sec bins |
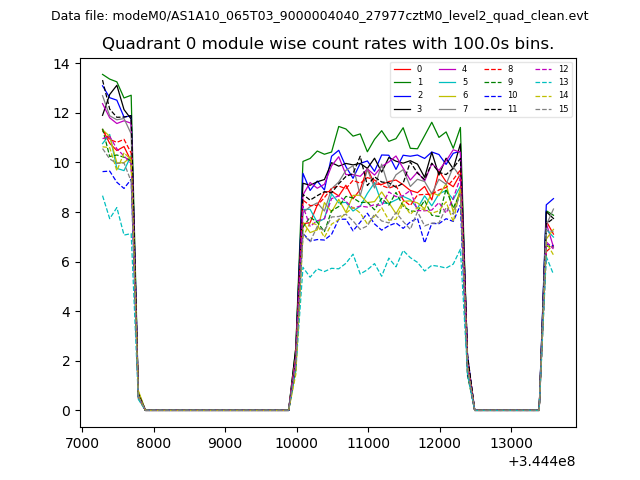 |
 |
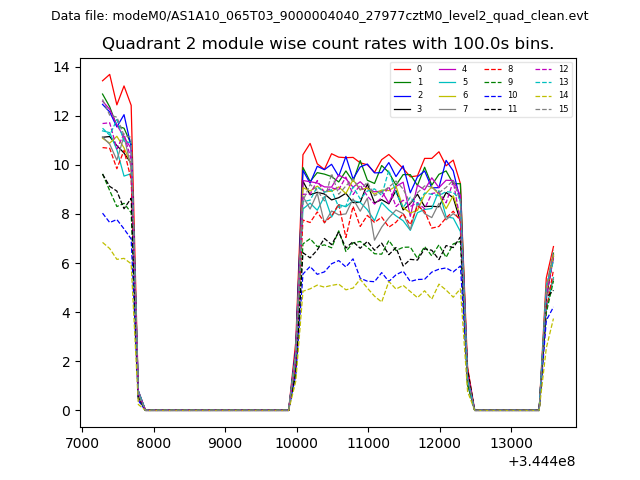
| Module-wise count rates for Quadrant B Data is divided into 100 sec bins |
 |
 |
| Module-wise count rates for Quadrant C Data is divided into 100 sec bins |
 |
 |
| Module-wise count rates for Quadrant D Data is divided into 100 sec bins |
 |
 |
| Parameter | Plot |
|---|---|
| CZT HV Monitor | 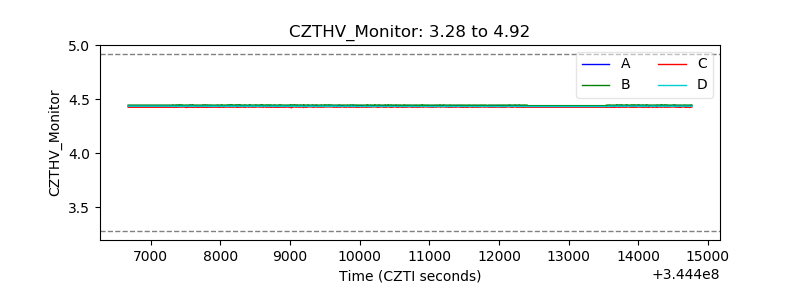 |
| D_VDD | 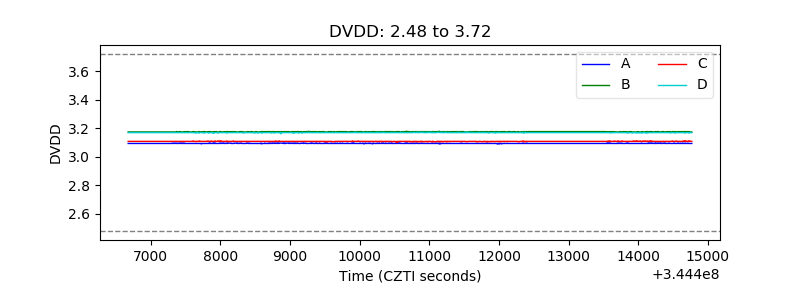 |
| Temperature 1 | 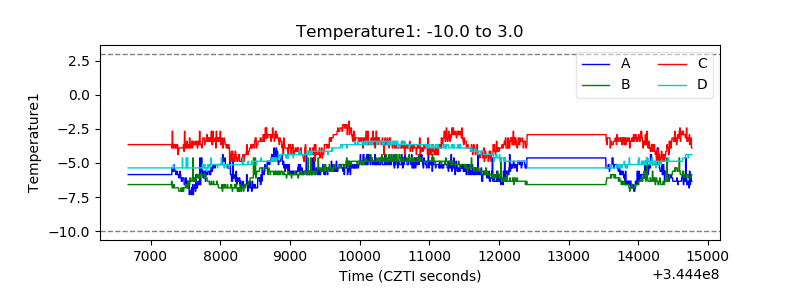 |
| Veto HV Monitor | 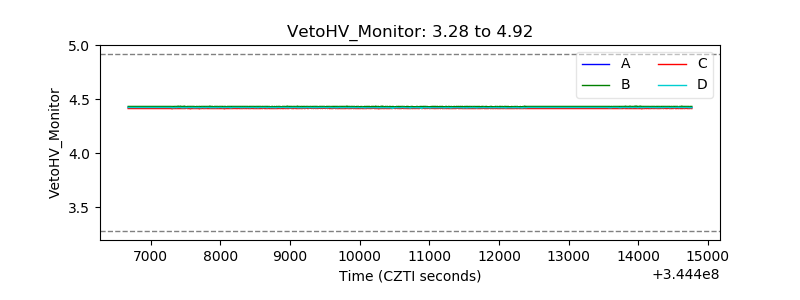 |
| Veto LLD | 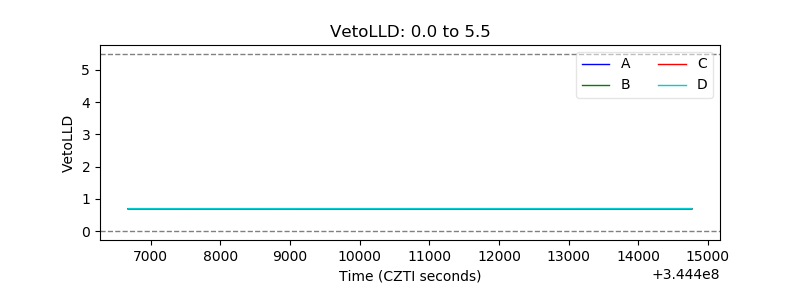 |
| Alpha Counter | 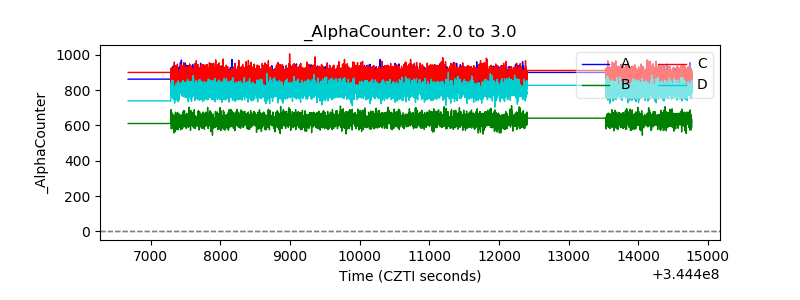 |
| _CPM_Rate | 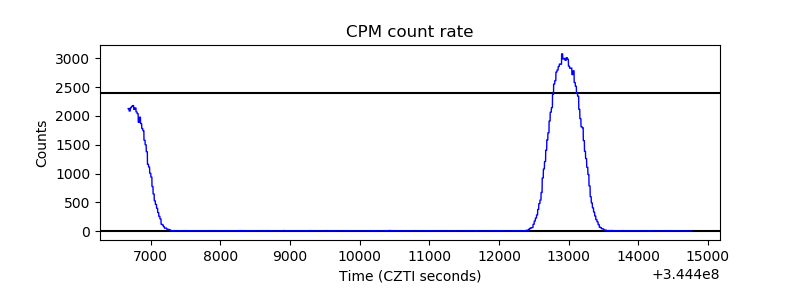 |
| CZT Counter | 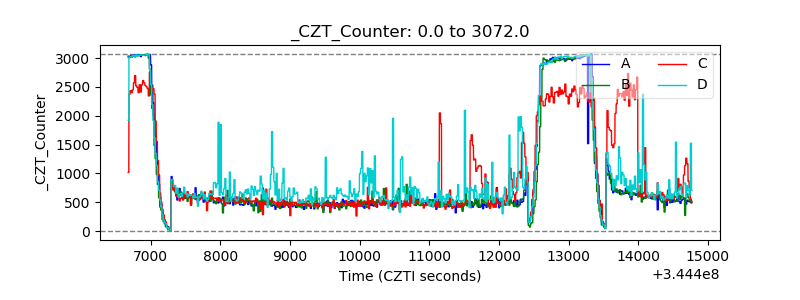 |
| +2.5 Volts monitor |  |
| +5 Volts monitor |  |
| _ROLL_ROT | 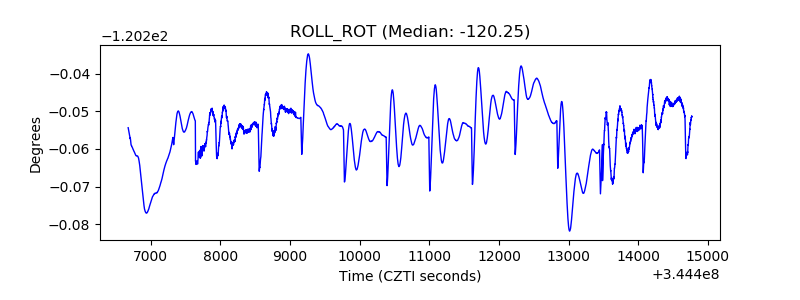 |
| _Roll_DEC | 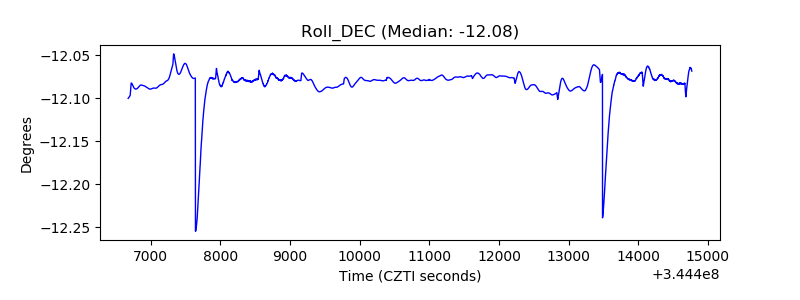 |
| _Roll_RA | 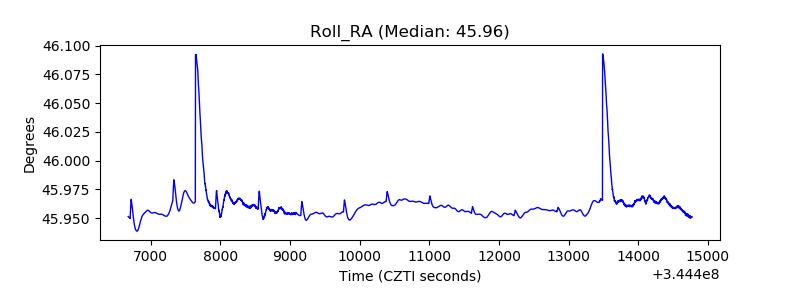 |
| Veto Counter | 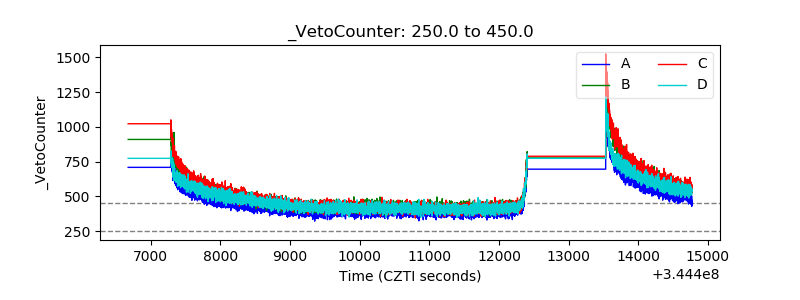 |