| Param | Original file | Final file |
|---|---|---|
| Filename | modeM0/AS1A10_065T03_9000004040_27978cztM0_level2.evt | modeM0/AS1A10_065T03_9000004040_27978cztM0_level2_quad_clean.evt |
| Size (bytes) | 603,146,880 | 67,034,880 |
| Size | 575.2 MB | 63.9 MB |
| Events in quadrant A | 3,514,839 | 413,940 |
| Events in quadrant B | 3,562,287 | 414,246 |
| Events in quadrant C | 4,620,690 | 386,547 |
| Events in quadrant D | 6,141,234 | 373,889 |
| Mode M9 | |||
|---|---|---|---|
| Quadrant | BADHDUFLAG | Total packets | Discarded packets |
| A | 0 | 15 | 0 |
| B | 0 | 16 | 0 |
| C | 0 | 16 | 0 |
| D | 0 | 16 | 0 |
| Mode M0 | |||
|---|---|---|---|
| Quadrant | BADHDUFLAG | Total packets | Discarded packets |
| A | 0 | 14351 | 0 |
| B | 0 | 14555 | 0 |
| C | 0 | 18038 | 0 |
| D | 0 | 22618 | 0 |
| Quadrant | Total seconds | Saturated seconds | Saturation percentage |
|---|---|---|---|
| A | 6317 | 78 | 1.234763% |
| B | 6317 | 91 | 1.440557% |
| C | 6316 | 544 | 8.613046% |
| D | 6316 | 550 | 8.708043% |
Noise dominated data is calculated using 1-second bins in cleaned event files. If a bin has >2000 counts, and if more than 50% of those come from <1% of pixels, then it is considered to be noise-dominated and hence unusable.
| Quadrant | # 1 sec bins | Bins with >0 counts | Bins with >2000 counts | High rate bins dominated by noise | Noise dominated (total time) | Noise dominated (detector-on time) | Marked lightcurve |
|---|---|---|---|---|---|---|---|
| A | 7582 | 6317 | 1 | 1 | 0.01% | 0.02% | 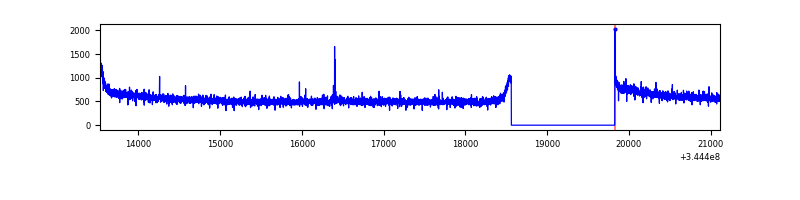 |
| B | 7582 | 6317 | 1 | 1 | 0.01% | 0.02% | 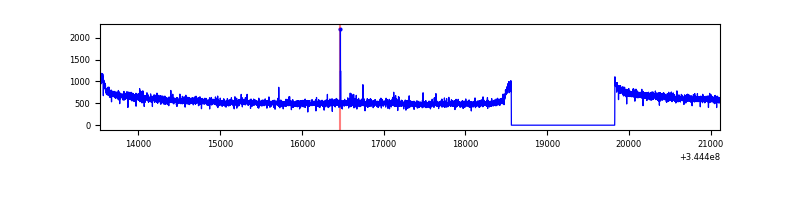 |
| C | 7581 | 6316 | 291 | 291 | 3.84% | 4.61% |  |
| D | 7581 | 6316 | 540 | 540 | 7.12% | 8.55% | 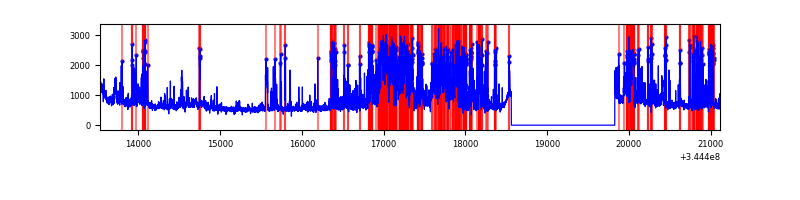 |
Top three noisy pixels from each quadrant. If the there are fewer than three noisy pixels in the level2.evt file, extra rows are filled as -1
| Pixel properties | Quadrant properties | ||||||
|---|---|---|---|---|---|---|---|
| Quadrant | DetID | PixID | Counts | Sigma | Mean | Median | Sigma |
| A | 1 | 113 | 10258 | 52.22 | 904 | 889 | 179.4 |
| A | 13 | 254 | 9556 | 48.3 | 904 | 889 | 179.4 |
| A | 8 | 192 | 8746 | 43.79 | 904 | 889 | 179.4 |
| B | 12 | 111 | 20291 | 114.4 | 903 | 882 | 169.7 |
| B | 11 | 111 | 18274 | 102.51 | 903 | 882 | 169.7 |
| B | 14 | 111 | 17782 | 99.61 | 903 | 882 | 169.7 |
| C | 2 | 16 | 1169513 | 5956.73 | 849 | 858 | 196.2 |
| C | 14 | 238 | 136801 | 692.91 | 849 | 858 | 196.2 |
| C | 3 | 233 | 9073 | 41.87 | 849 | 858 | 196.2 |
| D | 1 | 52 | 1690500 | 8461.97 | 859 | 842 | 199.7 |
| D | 8 | 195 | 1140546 | 5707.75 | 859 | 842 | 199.7 |
| D | 7 | 238 | 40782 | 200.02 | 859 | 842 | 199.7 |
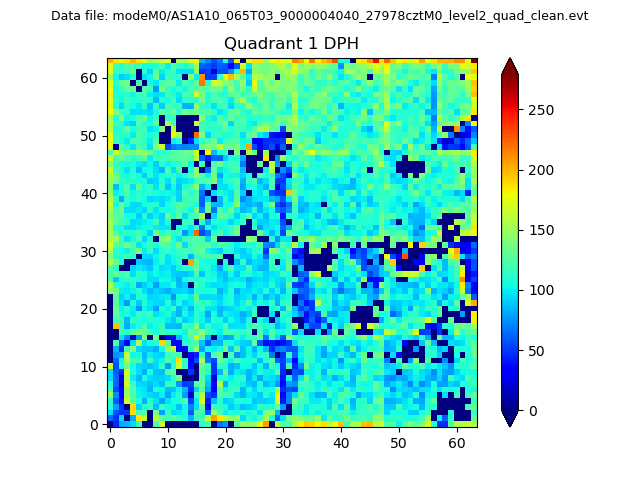
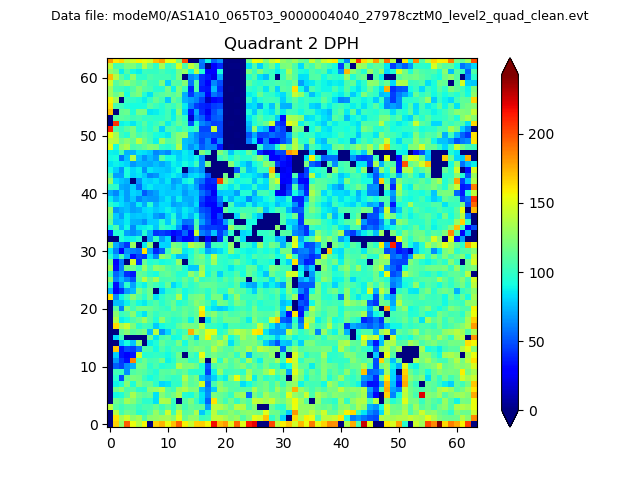
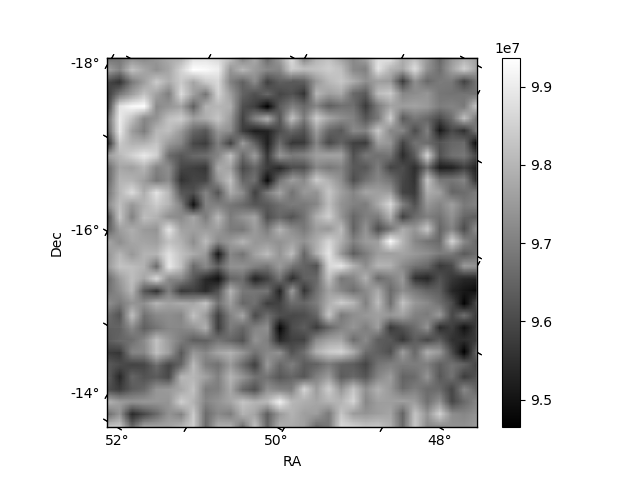
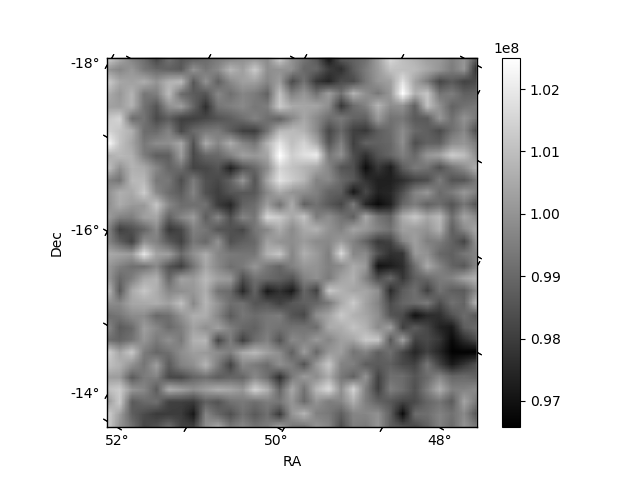
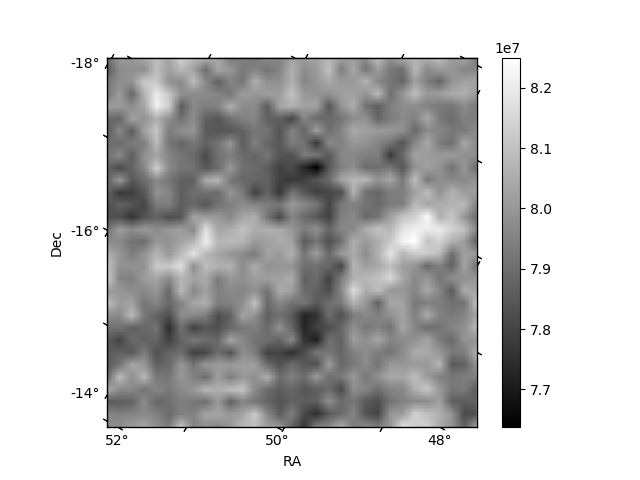
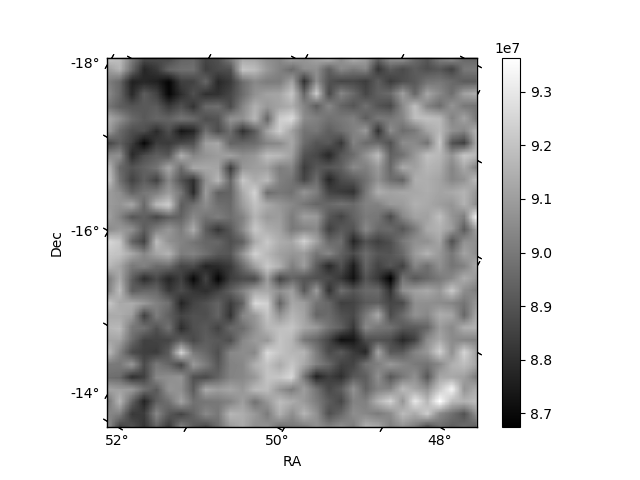
Histogram calculated using DETX and DETY for each event in the final _common_clean file
| Quadrant A | 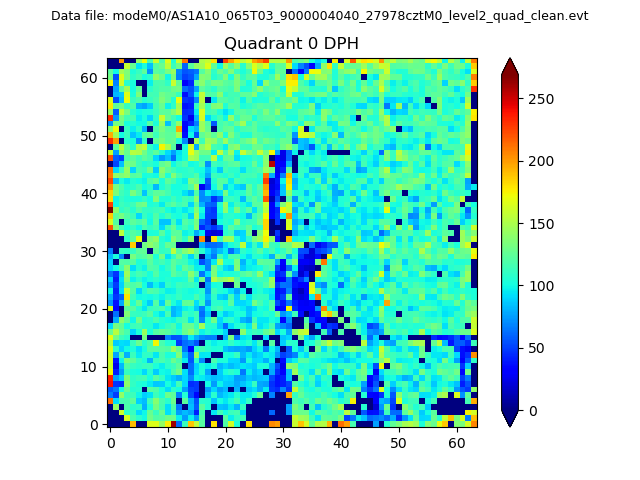 |
 |
Quadrant B |
|---|---|---|---|
| Quadrant D | 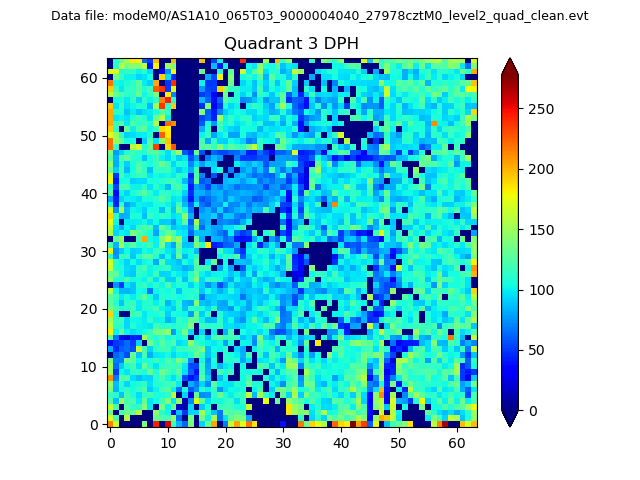 |
 |
Quadrant C |
| Plot type | Count rate plots | Images |
|---|---|---|
| Comparison with Poisson distribution Blue bars denote a histogram of data divided into 1 sec bins. Red curve is a Poisson curve with rate = median count rate of data. |
 |
 |
| Quadrant-wise count rates Data is divided into 100 sec bins |
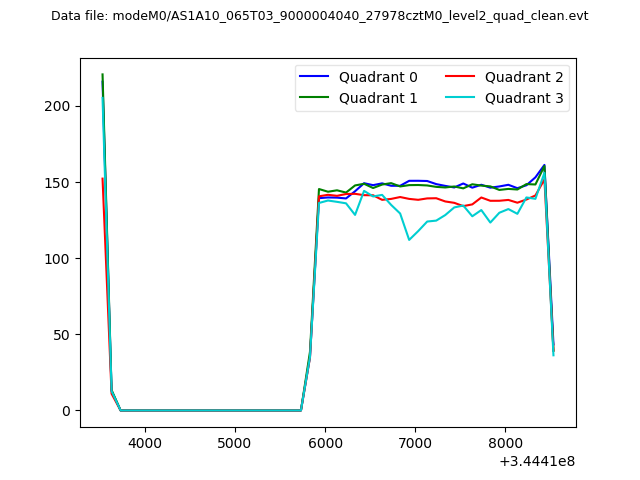 |
|
| Module-wise count rates for Quadrant A Data is divided into 100 sec bins |
 |
 |
| Module-wise count rates for Quadrant B Data is divided into 100 sec bins |
 |
 |
| Module-wise count rates for Quadrant C Data is divided into 100 sec bins |
 |
 |
| Module-wise count rates for Quadrant D Data is divided into 100 sec bins |
 |
 |
| Parameter | Plot |
|---|---|
| CZT HV Monitor |  |
| D_VDD | 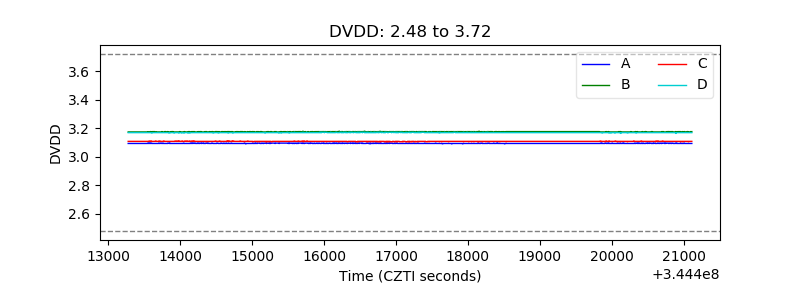 |
| Temperature 1 | 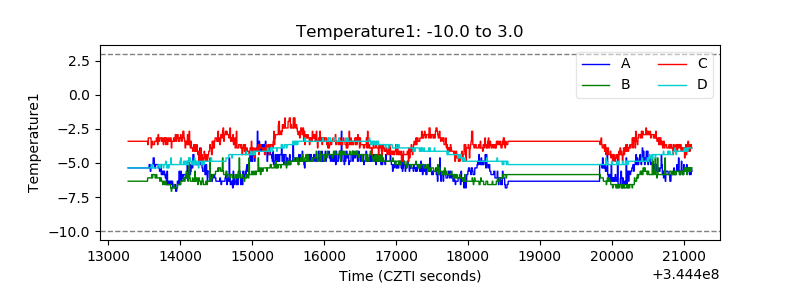 |
| Veto HV Monitor | 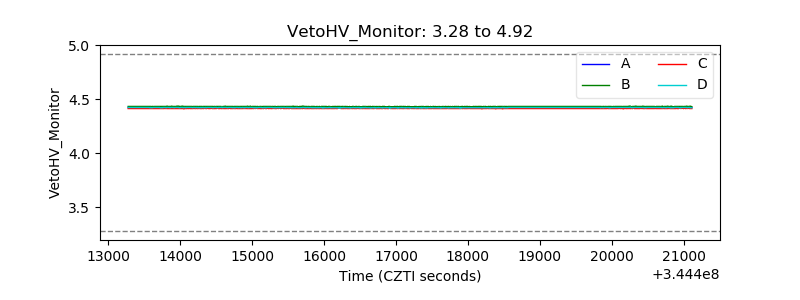 |
| Veto LLD |  |
| Alpha Counter | 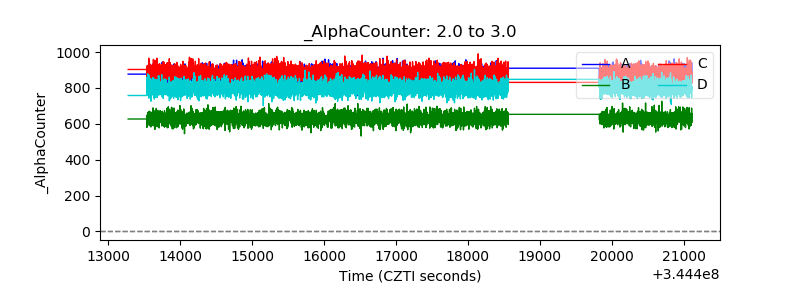 |
| _CPM_Rate | 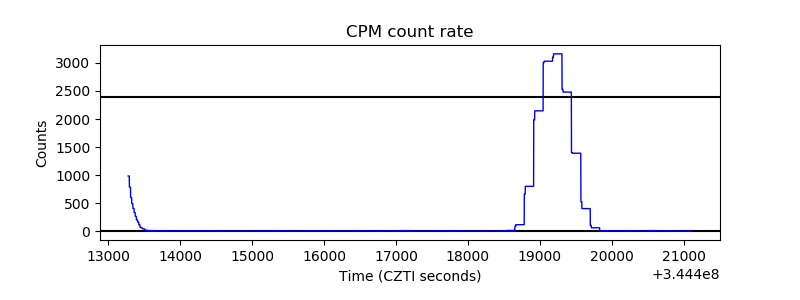 |
| CZT Counter | 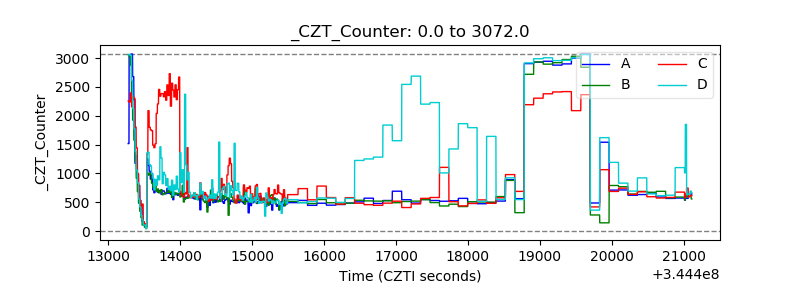 |
| +2.5 Volts monitor |  |
| +5 Volts monitor | 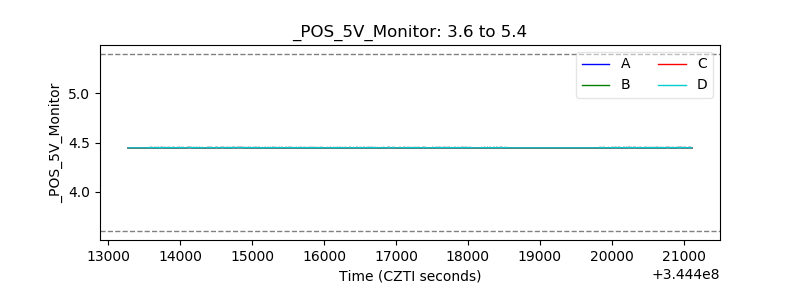 |
| _ROLL_ROT |  |
| _Roll_DEC | 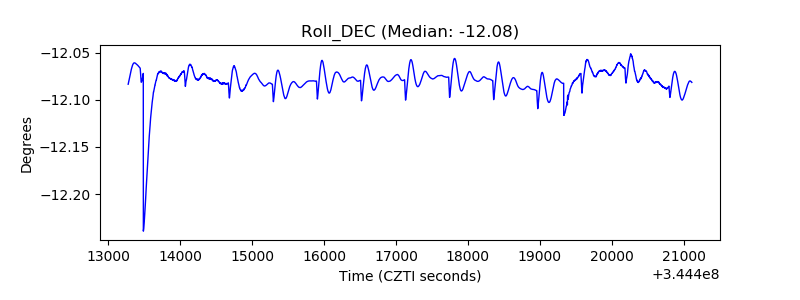 |
| _Roll_RA | 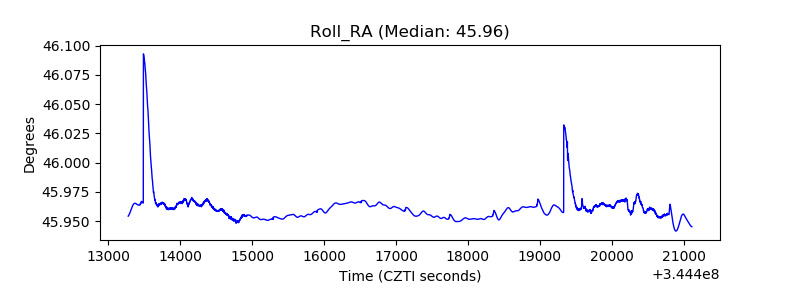 |
| Veto Counter |  |