| Param | Original file | Final file |
|---|---|---|
| Filename | modeM0/AS1A10_065T03_9000004040_27979cztM0_level2.evt | modeM0/AS1A10_065T03_9000004040_27979cztM0_level2_quad_clean.evt |
| Size (bytes) | 580,014,720 | 73,762,560 |
| Size | 553.1 MB | 70.3 MB |
| Events in quadrant A | 3,603,140 | 466,868 |
| Events in quadrant B | 3,664,066 | 466,972 |
| Events in quadrant C | 3,675,664 | 442,219 |
| Events in quadrant D | 6,200,853 | 421,932 |
| Mode M9 | |||
|---|---|---|---|
| Quadrant | BADHDUFLAG | Total packets | Discarded packets |
| A | 0 | 18 | 0 |
| B | 0 | 19 | 0 |
| C | 0 | 19 | 0 |
| D | 0 | 19 | 0 |
| Mode M0 | |||
|---|---|---|---|
| Quadrant | BADHDUFLAG | Total packets | Discarded packets |
| A | 0 | 14678 | 0 |
| B | 0 | 14956 | 0 |
| C | 0 | 15074 | 0 |
| D | 0 | 23139 | 0 |
| Quadrant | Total seconds | Saturated seconds | Saturation percentage |
|---|---|---|---|
| A | 6233 | 91 | 1.459971% |
| B | 6233 | 125 | 2.005455% |
| C | 6232 | 177 | 2.840180% |
| D | 6232 | 605 | 9.707959% |
Noise dominated data is calculated using 1-second bins in cleaned event files. If a bin has >2000 counts, and if more than 50% of those come from <1% of pixels, then it is considered to be noise-dominated and hence unusable.
| Quadrant | # 1 sec bins | Bins with >0 counts | Bins with >2000 counts | High rate bins dominated by noise | Noise dominated (total time) | Noise dominated (detector-on time) | Marked lightcurve |
|---|---|---|---|---|---|---|---|
| A | 7548 | 6234 | 1 | 1 | 0.01% | 0.02% | 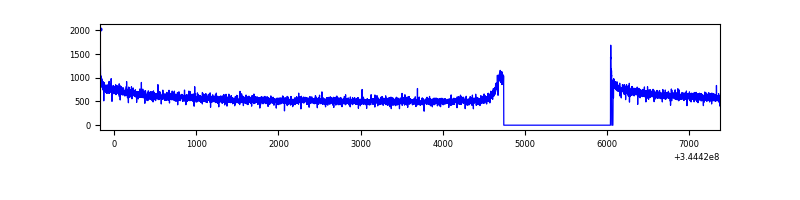 |
| B | 7548 | 6234 | 12 | 12 | 0.16% | 0.19% | 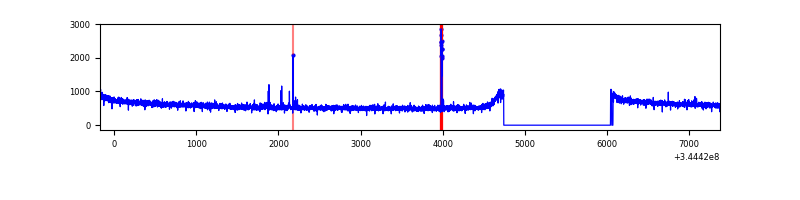 |
| C | 7547 | 6233 | 1 | 1 | 0.01% | 0.02% | 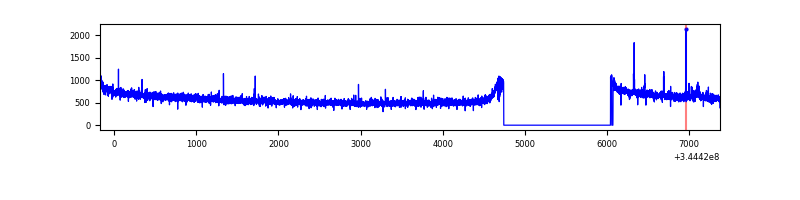 |
| D | 7547 | 6232 | 467 | 467 | 6.19% | 7.49% | 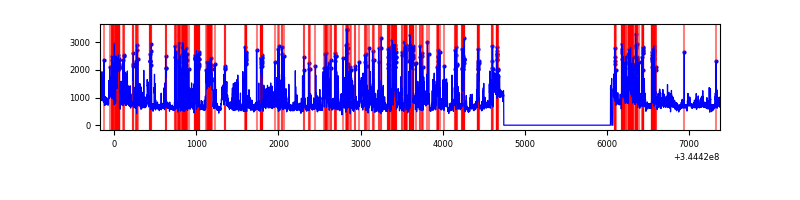 |
Top three noisy pixels from each quadrant. If the there are fewer than three noisy pixels in the level2.evt file, extra rows are filled as -1
| Pixel properties | Quadrant properties | ||||||
|---|---|---|---|---|---|---|---|
| Quadrant | DetID | PixID | Counts | Sigma | Mean | Median | Sigma |
| A | 8 | 192 | 9202 | 45.21 | 931 | 916 | 183.3 |
| A | 13 | 254 | 8625 | 42.06 | 931 | 916 | 183.3 |
| A | 3 | 137 | 8137 | 39.4 | 931 | 916 | 183.3 |
| B | 15 | 33 | 28208 | 158.86 | 927 | 909 | 171.8 |
| B | 12 | 111 | 20302 | 112.85 | 927 | 909 | 171.8 |
| B | 11 | 111 | 18834 | 104.31 | 927 | 909 | 171.8 |
| C | 14 | 238 | 146346 | 707.42 | 896 | 906 | 205.6 |
| C | 2 | 16 | 23591 | 110.34 | 896 | 906 | 205.6 |
| C | 3 | 233 | 14408 | 65.67 | 896 | 906 | 205.6 |
| D | 1 | 52 | 2299748 | 11312.88 | 867 | 848 | 203.2 |
| D | 8 | 195 | 477562 | 2345.91 | 867 | 848 | 203.2 |
| D | 6 | 112 | 57188 | 277.25 | 867 | 848 | 203.2 |
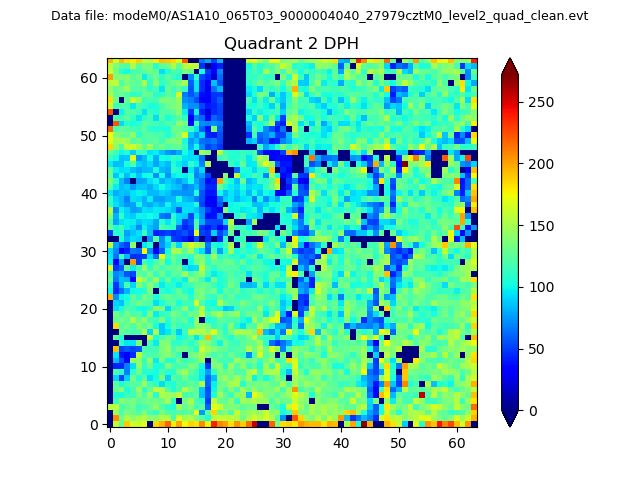
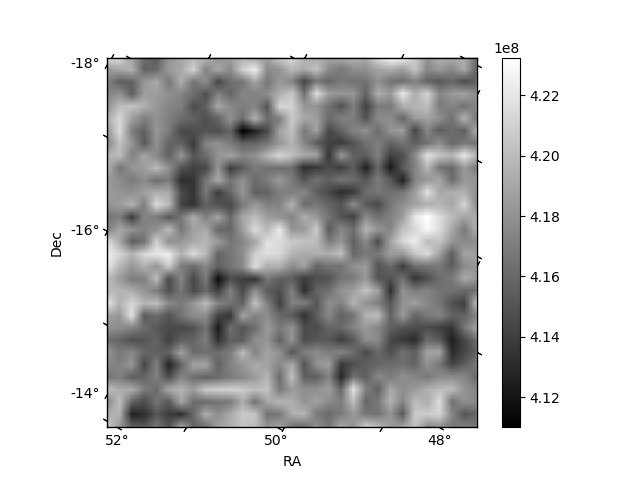
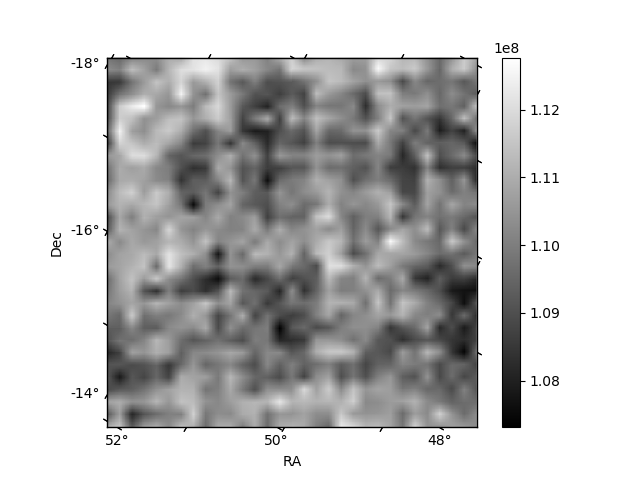
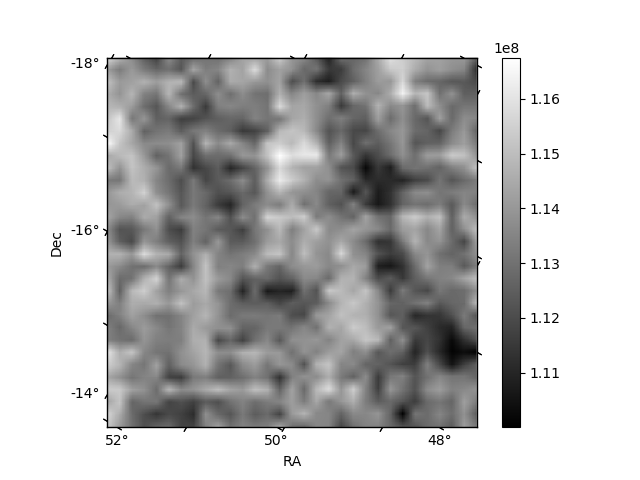
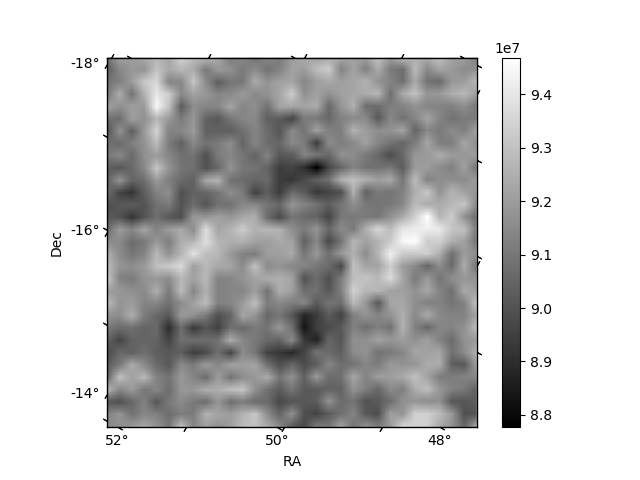
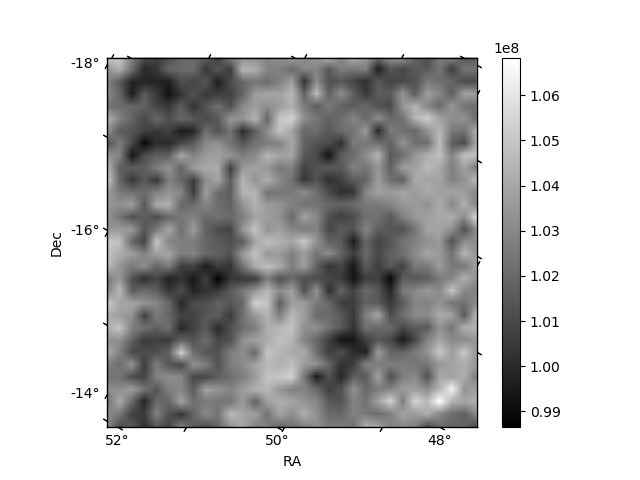
Histogram calculated using DETX and DETY for each event in the final _common_clean file
| Quadrant A | 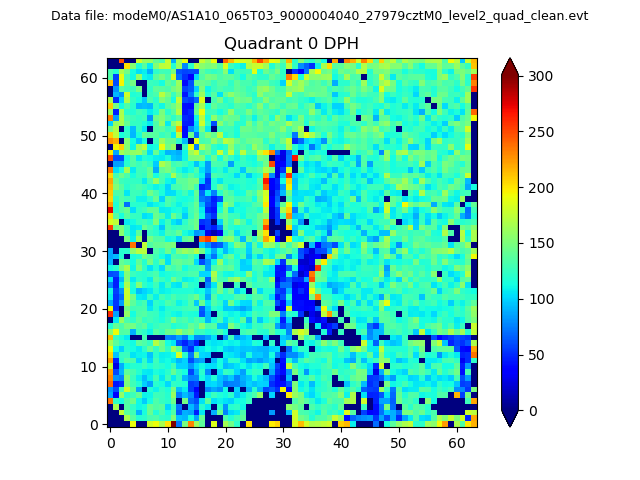 |
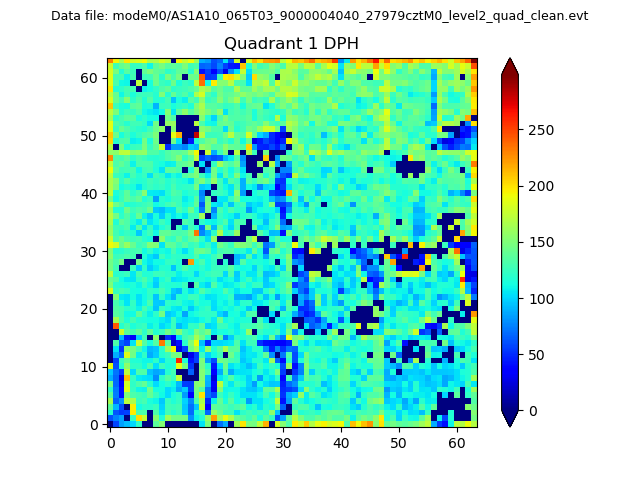 |
Quadrant B |
|---|---|---|---|
| Quadrant D | 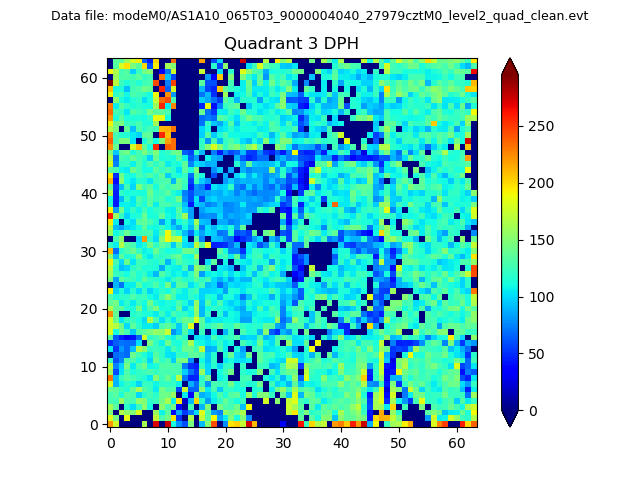 |
 |
Quadrant C |
| Plot type | Count rate plots | Images |
|---|---|---|
| Comparison with Poisson distribution Blue bars denote a histogram of data divided into 1 sec bins. Red curve is a Poisson curve with rate = median count rate of data. |
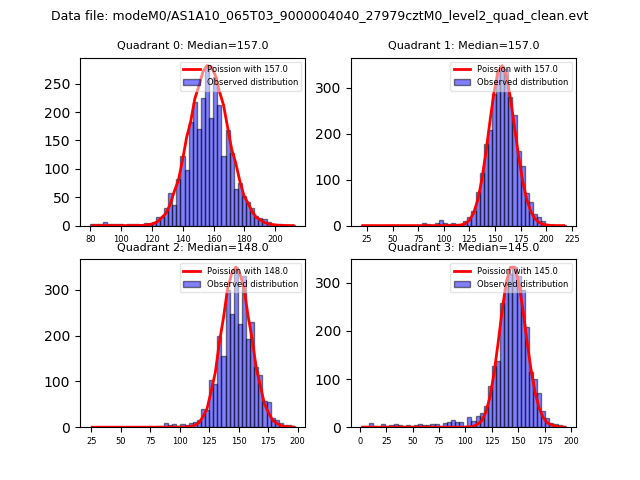 |
 |
| Quadrant-wise count rates Data is divided into 100 sec bins |
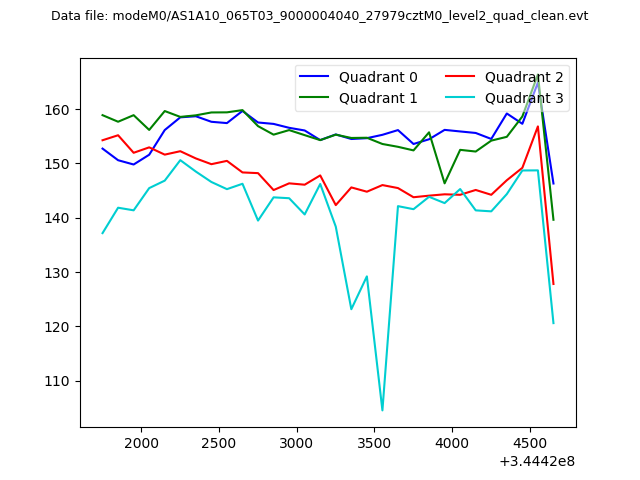 |
|
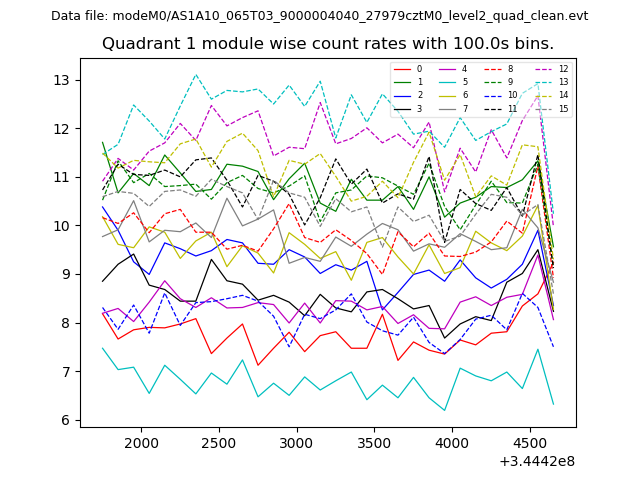
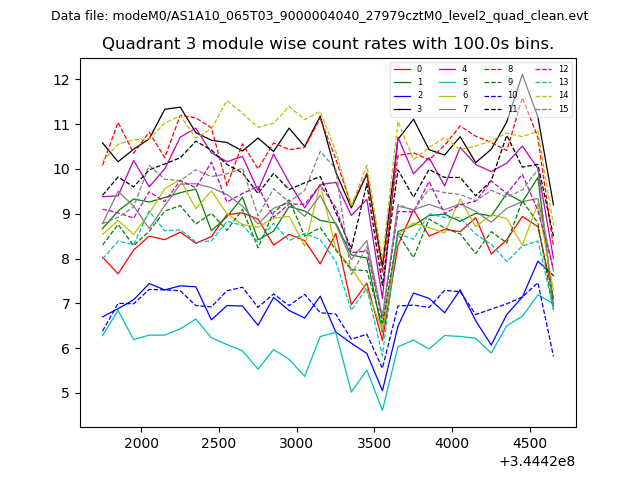
| Module-wise count rates for Quadrant A Data is divided into 100 sec bins |
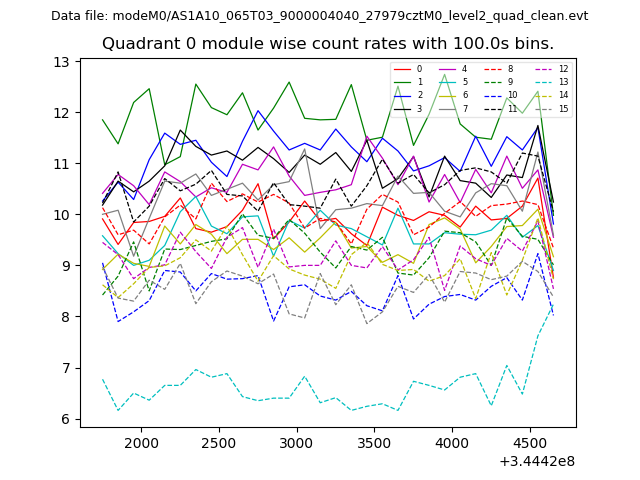 |
 |
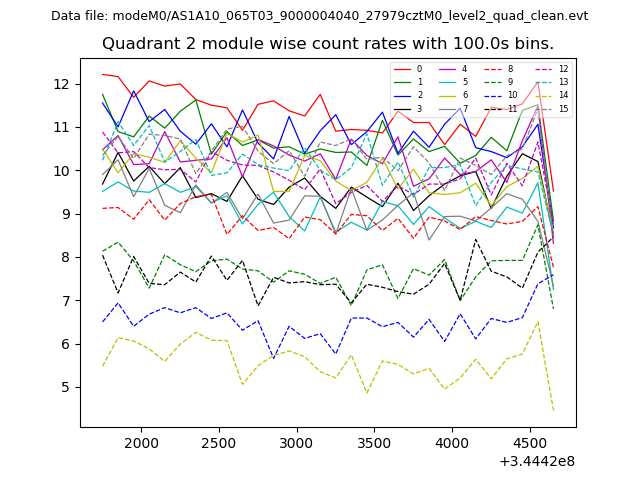
| Module-wise count rates for Quadrant B Data is divided into 100 sec bins |
 |
 |
| Module-wise count rates for Quadrant C Data is divided into 100 sec bins |
 |
 |
| Module-wise count rates for Quadrant D Data is divided into 100 sec bins |
 |
 |
| Parameter | Plot |
|---|---|
| CZT HV Monitor | 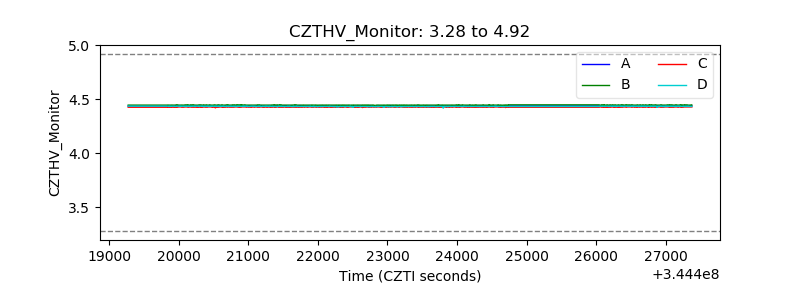 |
| D_VDD |  |
| Temperature 1 | 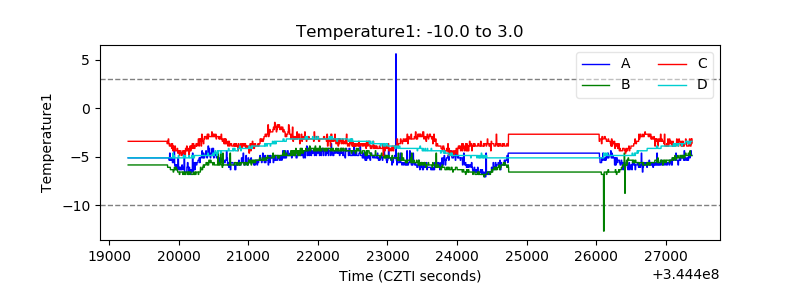 |
| Veto HV Monitor | 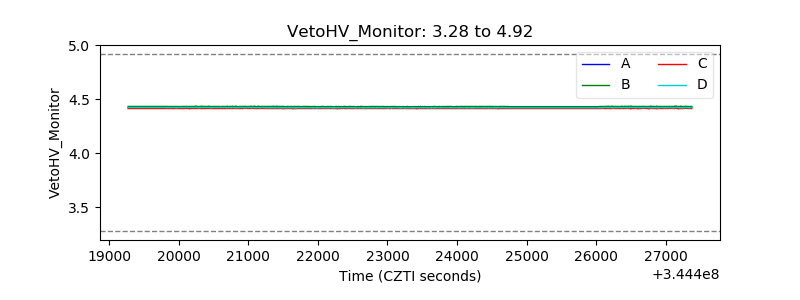 |
| Veto LLD | 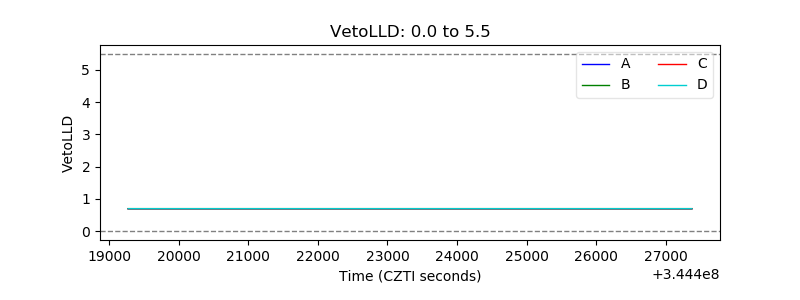 |
| Alpha Counter | 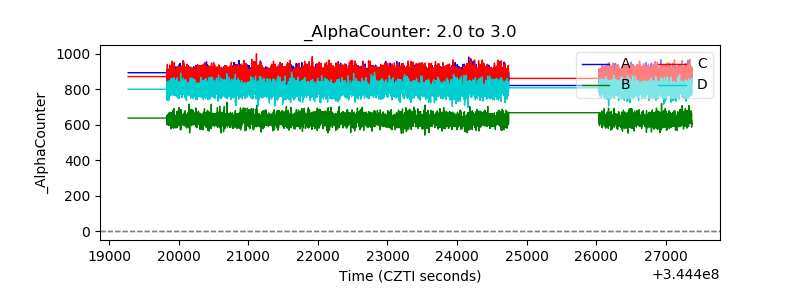 |
| _CPM_Rate | 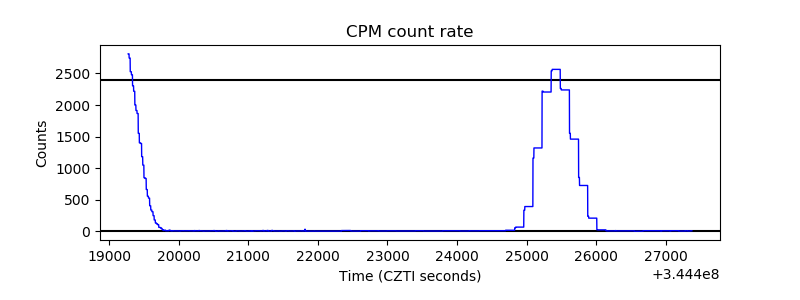 |
| CZT Counter | 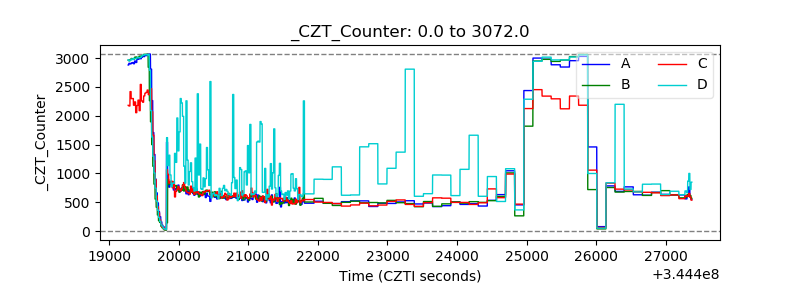 |
| +2.5 Volts monitor |  |
| +5 Volts monitor |  |
| _ROLL_ROT | 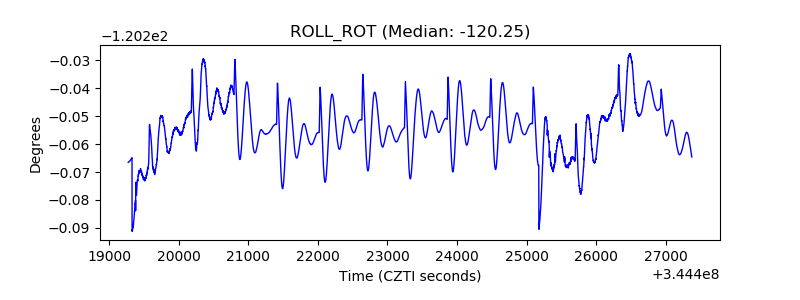 |
| _Roll_DEC | 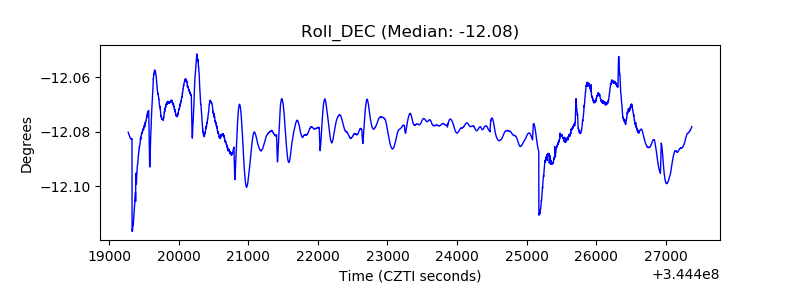 |
| _Roll_RA | 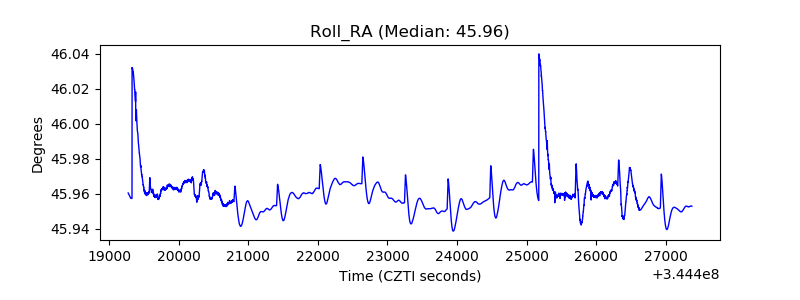 |
| Veto Counter | 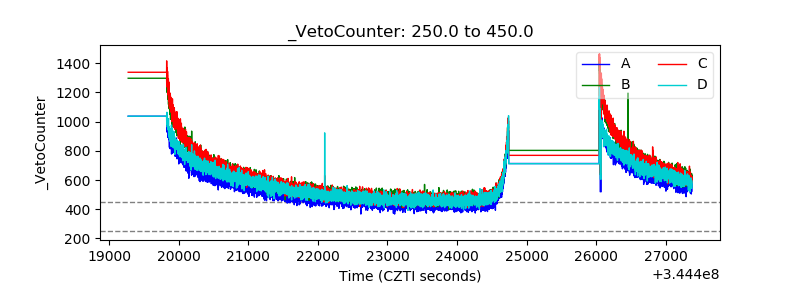 |