| Param | Original file | Final file |
|---|---|---|
| Filename | modeM0/AS1A10_065T03_9000004040_27981cztM0_level2.evt | modeM0/AS1A10_065T03_9000004040_27981cztM0_level2_quad_clean.evt |
| Size (bytes) | 542,090,880 | 97,277,760 |
| Size | 517.0 MB | 92.8 MB |
| Events in quadrant A | 3,892,609 | 652,233 |
| Events in quadrant B | 3,379,429 | 662,704 |
| Events in quadrant C | 3,520,736 | 614,183 |
| Events in quadrant D | 5,213,957 | 593,628 |
| Mode M9 | |||
|---|---|---|---|
| Quadrant | BADHDUFLAG | Total packets | Discarded packets |
| A | 0 | 13 | 0 |
| B | 0 | 13 | 0 |
| C | 0 | 13 | 0 |
| D | 0 | 13 | 0 |
| Mode M0 | |||
|---|---|---|---|
| Quadrant | BADHDUFLAG | Total packets | Discarded packets |
| A | 0 | 15365 | 0 |
| B | 0 | 13788 | 0 |
| C | 0 | 14364 | 0 |
| D | 0 | 20048 | 0 |
| Quadrant | Total seconds | Saturated seconds | Saturation percentage |
|---|---|---|---|
| A | 6056 | 249 | 4.111625% |
| B | 6057 | 141 | 2.327885% |
| C | 6057 | 205 | 3.384514% |
| D | 6057 | 387 | 6.389302% |
Noise dominated data is calculated using 1-second bins in cleaned event files. If a bin has >2000 counts, and if more than 50% of those come from <1% of pixels, then it is considered to be noise-dominated and hence unusable.
| Quadrant | # 1 sec bins | Bins with >0 counts | Bins with >2000 counts | High rate bins dominated by noise | Noise dominated (total time) | Noise dominated (detector-on time) | Marked lightcurve |
|---|---|---|---|---|---|---|---|
| A | 7316 | 6056 | 159 | 159 | 2.17% | 2.63% | 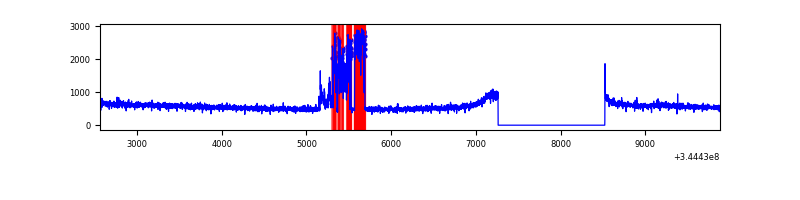 |
| B | 7317 | 6057 | 2 | 2 | 0.03% | 0.03% | 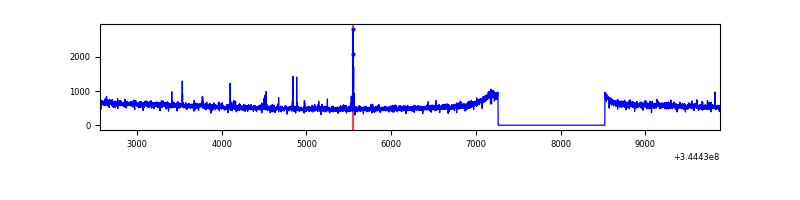 |
| C | 7317 | 6057 | 31 | 31 | 0.42% | 0.51% | 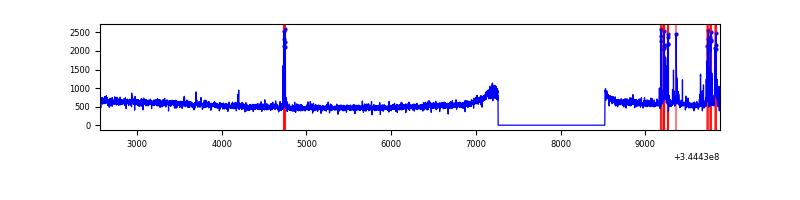 |
| D | 7317 | 6057 | 321 | 321 | 4.39% | 5.30% | 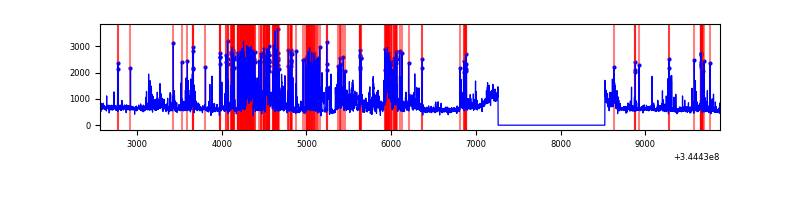 |
Top three noisy pixels from each quadrant. If the there are fewer than three noisy pixels in the level2.evt file, extra rows are filled as -1
| Pixel properties | Quadrant properties | ||||||
|---|---|---|---|---|---|---|---|
| Quadrant | DetID | PixID | Counts | Sigma | Mean | Median | Sigma |
| A | 6 | 16 | 563727 | 3295.57 | 863 | 850 | 170.8 |
| A | 13 | 254 | 8132 | 42.64 | 863 | 850 | 170.8 |
| A | 3 | 137 | 7763 | 40.47 | 863 | 850 | 170.8 |
| B | 12 | 111 | 19606 | 116.21 | 855 | 836 | 161.5 |
| B | 15 | 33 | 17809 | 105.09 | 855 | 836 | 161.5 |
| B | 11 | 111 | 17801 | 105.04 | 855 | 836 | 161.5 |
| C | 10 | 22 | 199834 | 1064.31 | 812 | 821 | 187.0 |
| C | 14 | 238 | 132887 | 706.28 | 812 | 821 | 187.0 |
| C | 3 | 233 | 26191 | 135.68 | 812 | 821 | 187.0 |
| D | 1 | 52 | 1299929 | 6776.4 | 814 | 796 | 191.7 |
| D | 8 | 195 | 770575 | 4015.24 | 814 | 796 | 191.7 |
| D | 7 | 80 | 57577 | 296.18 | 814 | 796 | 191.7 |
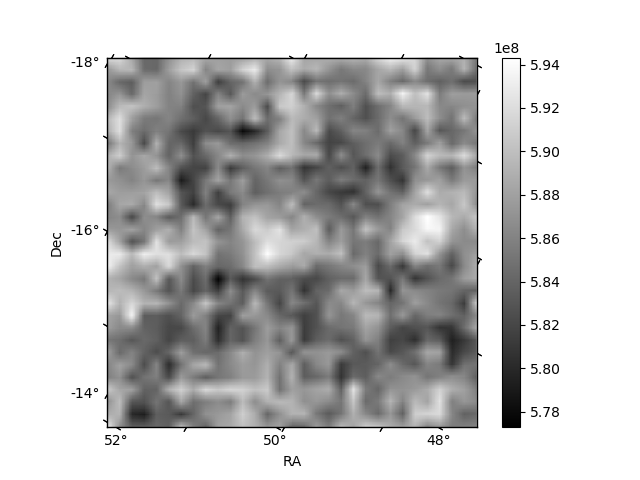
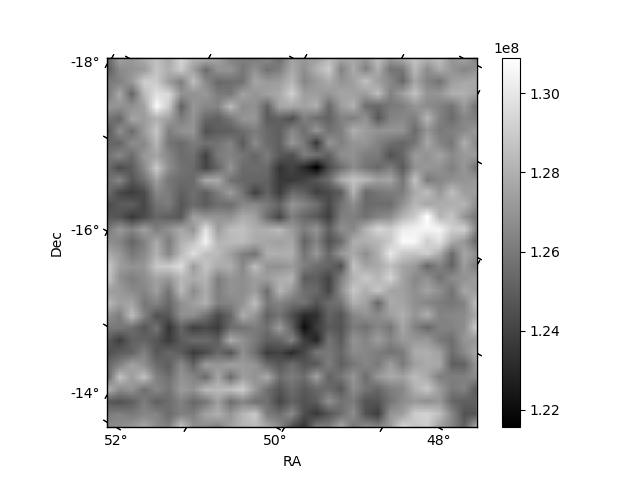
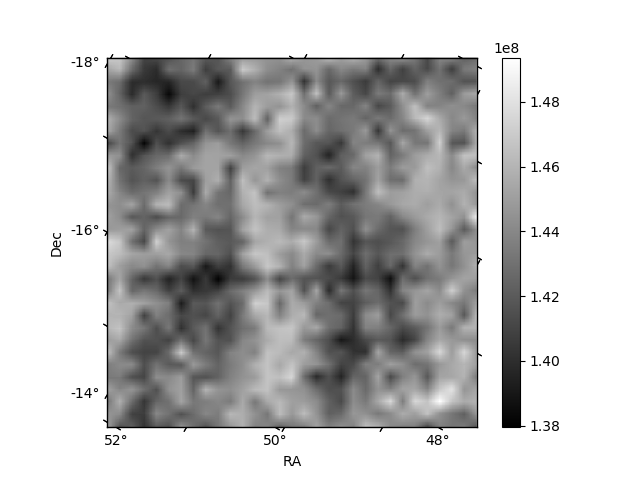
Histogram calculated using DETX and DETY for each event in the final _common_clean file
| Quadrant A | 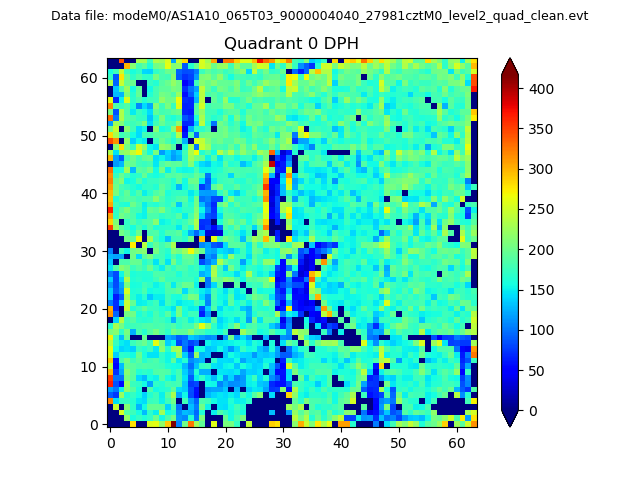 |
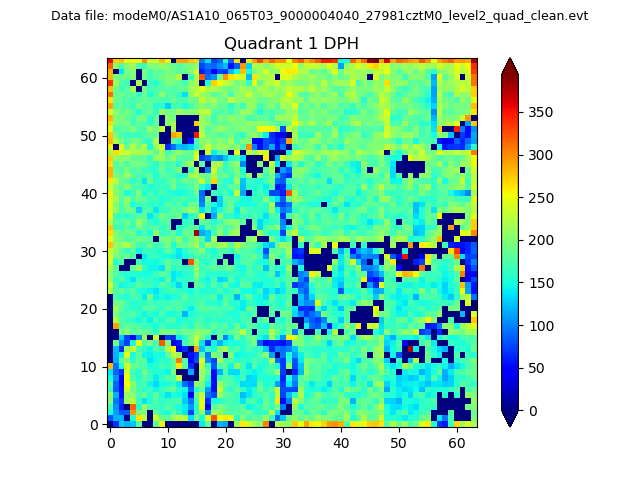 |
Quadrant B |
|---|---|---|---|
| Quadrant D |  |
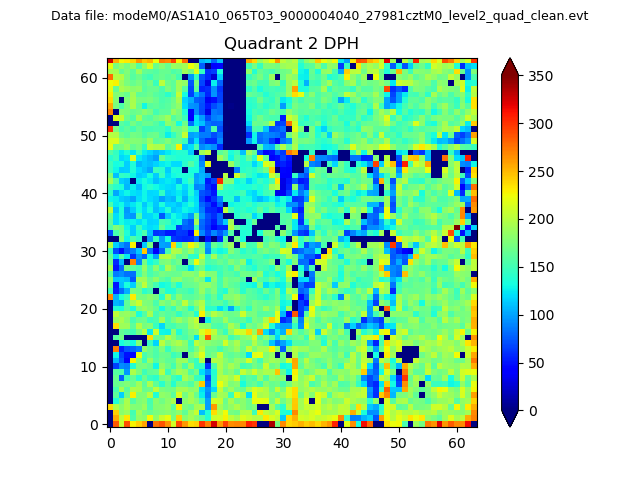 |
Quadrant C |
| Plot type | Count rate plots | Images |
|---|---|---|
| Comparison with Poisson distribution Blue bars denote a histogram of data divided into 1 sec bins. Red curve is a Poisson curve with rate = median count rate of data. |
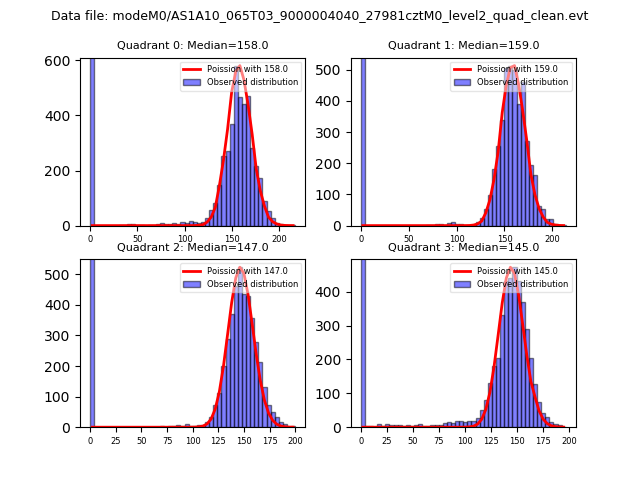 |
 |
| Quadrant-wise count rates Data is divided into 100 sec bins |
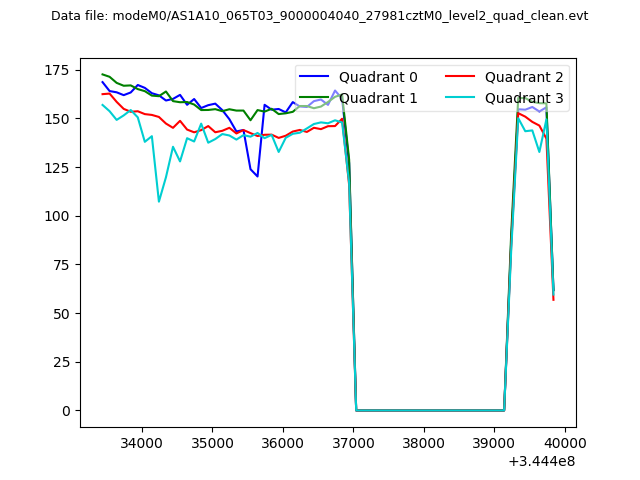 |
|
| Module-wise count rates for Quadrant A Data is divided into 100 sec bins |
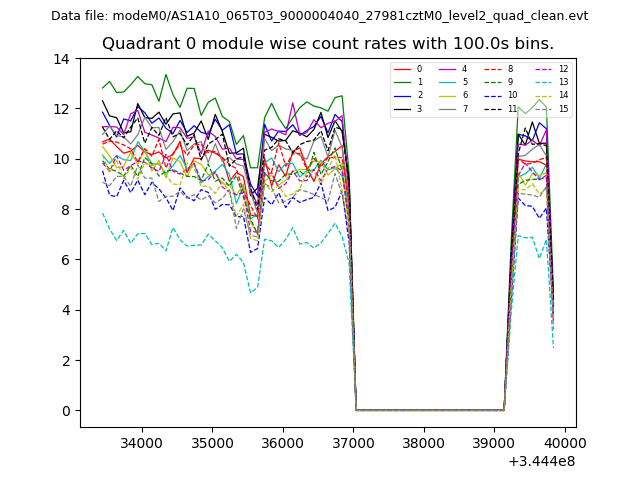 |
 |
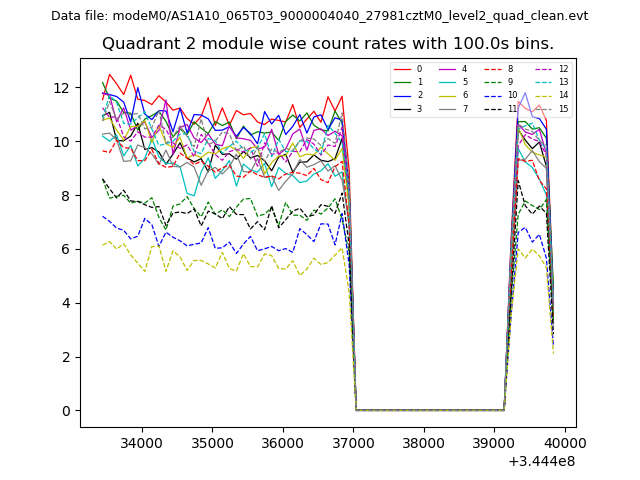
| Module-wise count rates for Quadrant B Data is divided into 100 sec bins |
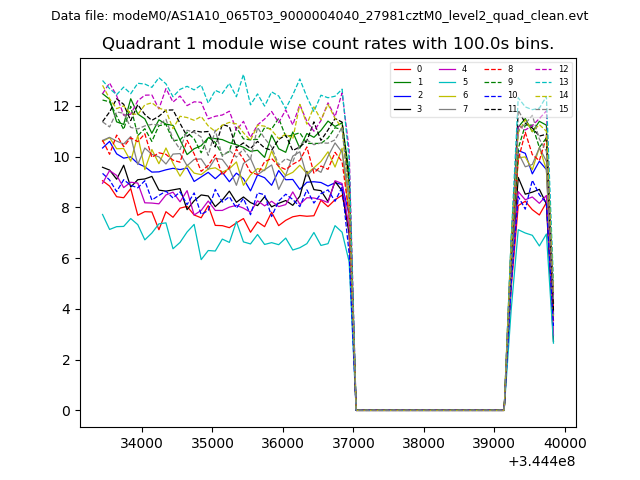 |
 |
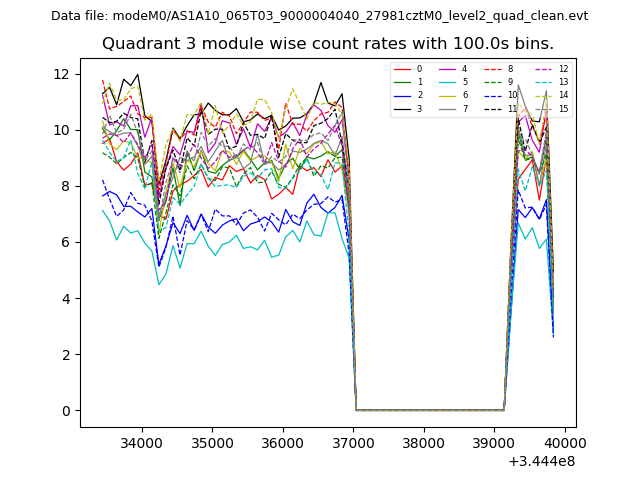
| Module-wise count rates for Quadrant C Data is divided into 100 sec bins |
 |
 |
| Module-wise count rates for Quadrant D Data is divided into 100 sec bins |
 |
 |
| Parameter | Plot |
|---|---|
| CZT HV Monitor | 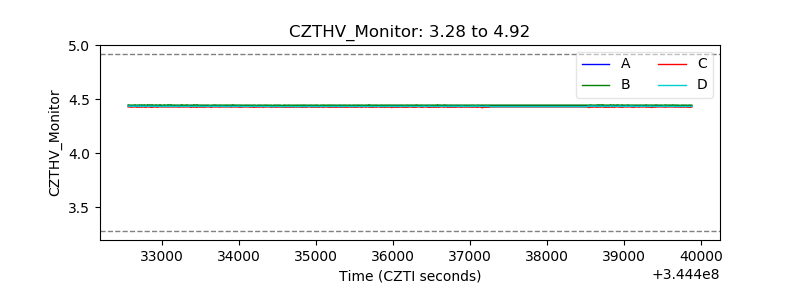 |
| D_VDD | 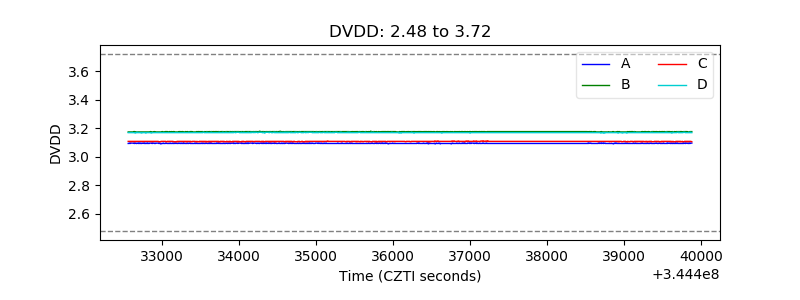 |
| Temperature 1 | 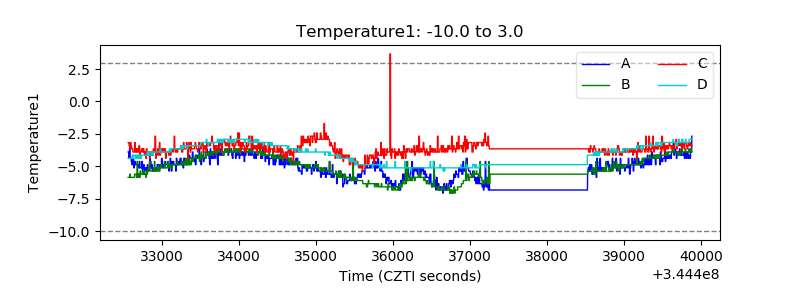 |
| Veto HV Monitor | 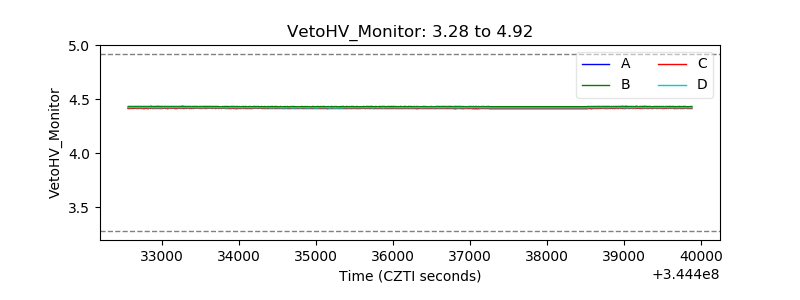 |
| Veto LLD | 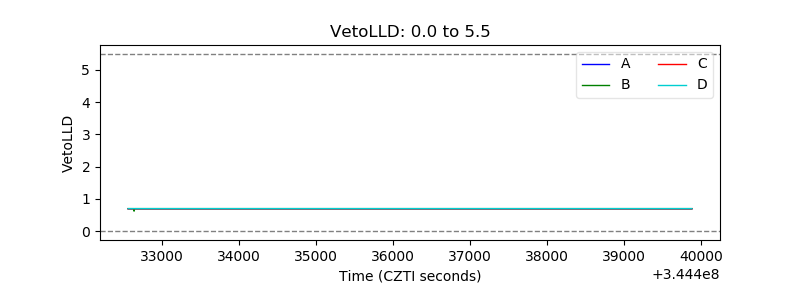 |
| Alpha Counter | 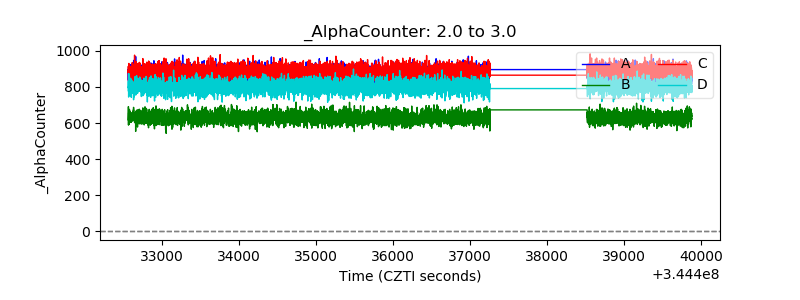 |
| _CPM_Rate | 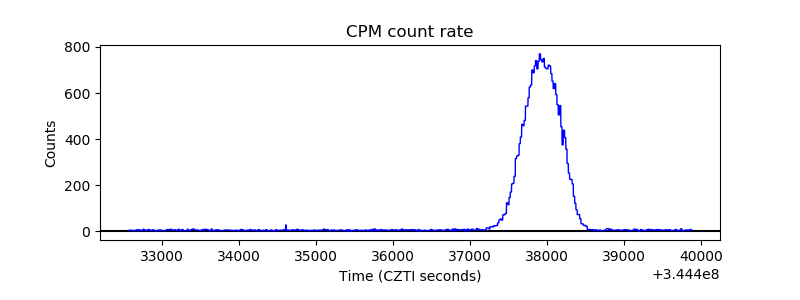 |
| CZT Counter | 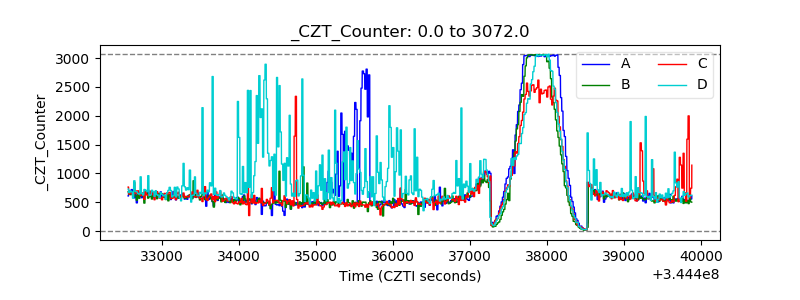 |
| +2.5 Volts monitor |  |
| +5 Volts monitor |  |
| _ROLL_ROT | 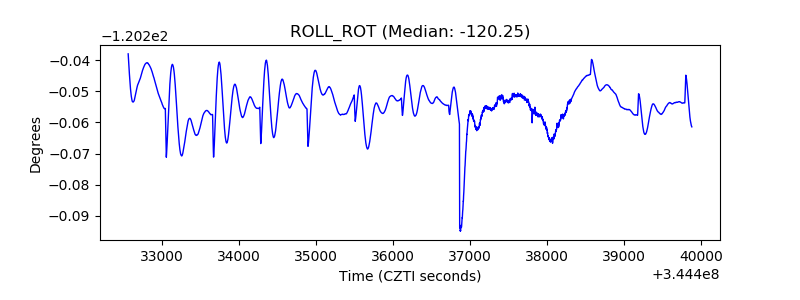 |
| _Roll_DEC | 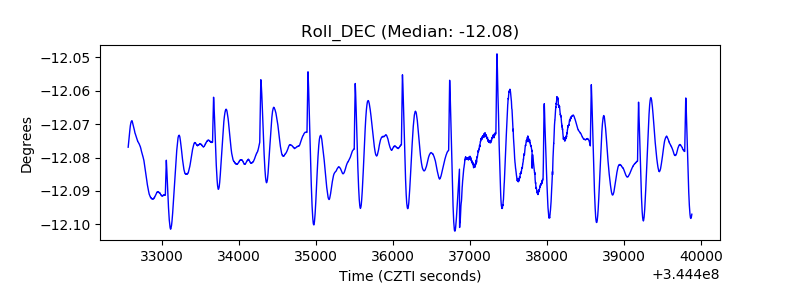 |
| _Roll_RA | 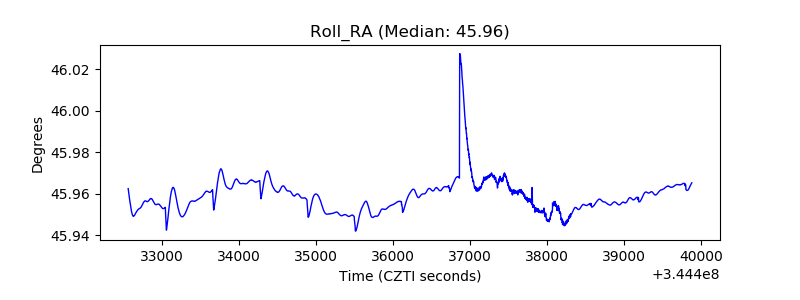 |
| Veto Counter | 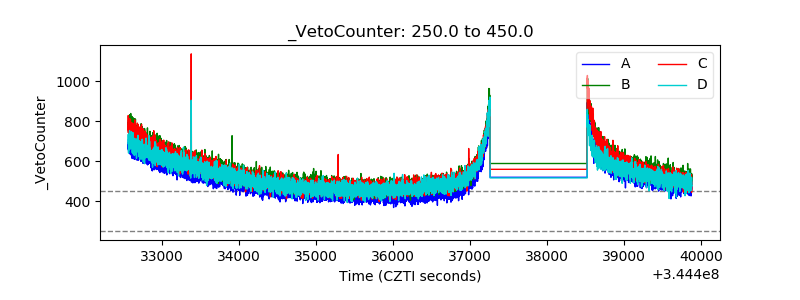 |