| Param | Original file | Final file |
|---|---|---|
| Filename | modeM0/AS1A10_065T03_9000004040_27983cztM0_level2.evt | modeM0/AS1A10_065T03_9000004040_27983cztM0_level2_quad_clean.evt |
| Size (bytes) | 582,431,040 | 107,254,080 |
| Size | 555.4 MB | 102.3 MB |
| Events in quadrant A | 3,636,164 | 718,713 |
| Events in quadrant B | 3,674,819 | 707,971 |
| Events in quadrant C | 3,931,205 | 660,561 |
| Events in quadrant D | 5,910,742 | 661,697 |
| Mode M9 | |||
|---|---|---|---|
| Quadrant | BADHDUFLAG | Total packets | Discarded packets |
| A | 0 | 5 | 0 |
| B | 0 | 5 | 0 |
| C | 0 | 5 | 0 |
| D | 0 | 5 | 0 |
| Mode M0 | |||
|---|---|---|---|
| Quadrant | BADHDUFLAG | Total packets | Discarded packets |
| A | 0 | 15069 | 0 |
| B | 0 | 15270 | 0 |
| C | 0 | 16198 | 0 |
| D | 0 | 22586 | 0 |
| Quadrant | Total seconds | Saturated seconds | Saturation percentage |
|---|---|---|---|
| A | 7160 | 147 | 2.053073% |
| B | 7161 | 160 | 2.234325% |
| C | 7161 | 209 | 2.918587% |
| D | 7161 | 431 | 6.018712% |
Noise dominated data is calculated using 1-second bins in cleaned event files. If a bin has >2000 counts, and if more than 50% of those come from <1% of pixels, then it is considered to be noise-dominated and hence unusable.
| Quadrant | # 1 sec bins | Bins with >0 counts | Bins with >2000 counts | High rate bins dominated by noise | Noise dominated (total time) | Noise dominated (detector-on time) | Marked lightcurve |
|---|---|---|---|---|---|---|---|
| A | 7720 | 7160 | 0 | 0 | 0.00% | 0.00% | 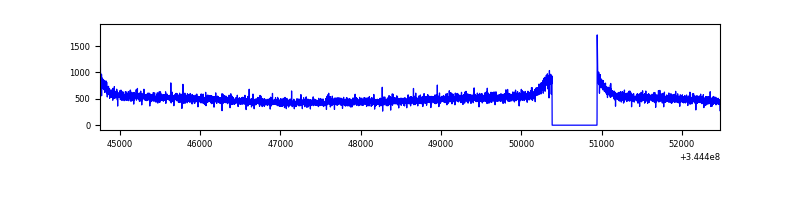 |
| B | 7721 | 7161 | 1 | 1 | 0.01% | 0.01% | 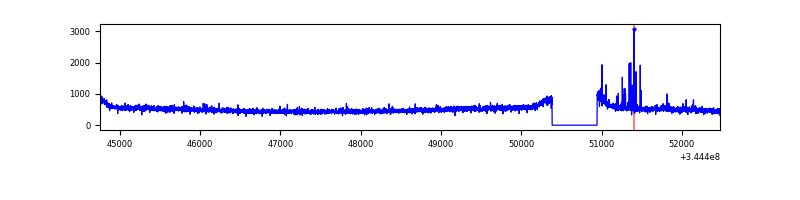 |
| C | 7721 | 7161 | 34 | 34 | 0.44% | 0.47% | 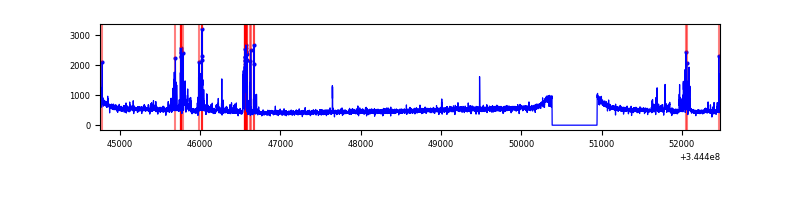 |
| D | 7721 | 7161 | 289 | 289 | 3.74% | 4.04% | 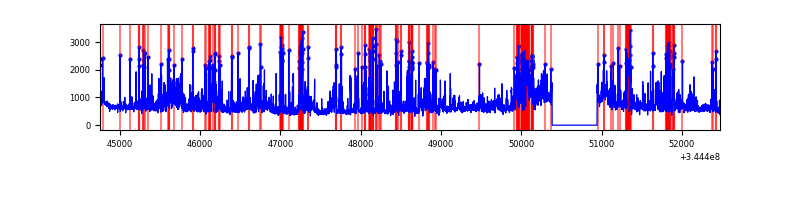 |
Top three noisy pixels from each quadrant. If the there are fewer than three noisy pixels in the level2.evt file, extra rows are filled as -1
| Pixel properties | Quadrant properties | ||||||
|---|---|---|---|---|---|---|---|
| Quadrant | DetID | PixID | Counts | Sigma | Mean | Median | Sigma |
| A | 8 | 192 | 10132 | 48.54 | 941 | 923 | 189.7 |
| A | 13 | 254 | 9442 | 44.9 | 941 | 923 | 189.7 |
| A | 3 | 137 | 9242 | 43.85 | 941 | 923 | 189.7 |
| B | 5 | 255 | 30981 | 170.33 | 922 | 899 | 176.6 |
| B | 12 | 111 | 22786 | 123.93 | 922 | 899 | 176.6 |
| B | 11 | 111 | 20547 | 111.25 | 922 | 899 | 176.6 |
| C | 10 | 22 | 313452 | 1515.22 | 880 | 885 | 206.3 |
| C | 14 | 238 | 142812 | 688.01 | 880 | 885 | 206.3 |
| C | 3 | 233 | 31838 | 150.05 | 880 | 885 | 206.3 |
| D | 1 | 52 | 1825631 | 8668.08 | 886 | 866 | 210.5 |
| D | 8 | 195 | 472464 | 2240.21 | 886 | 866 | 210.5 |
| D | 7 | 80 | 237737 | 1125.2 | 886 | 866 | 210.5 |
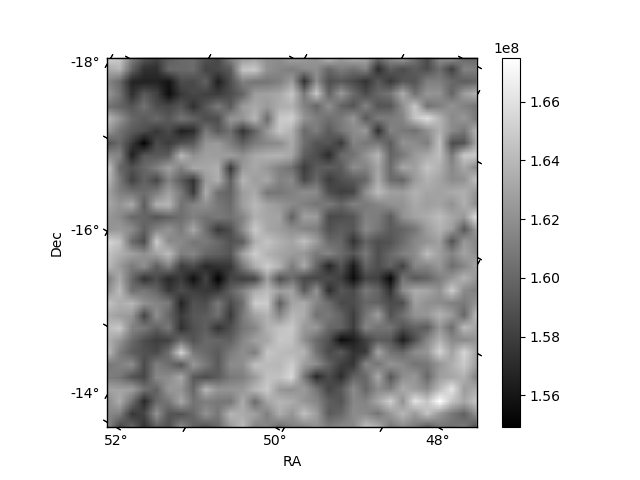
Histogram calculated using DETX and DETY for each event in the final _common_clean file
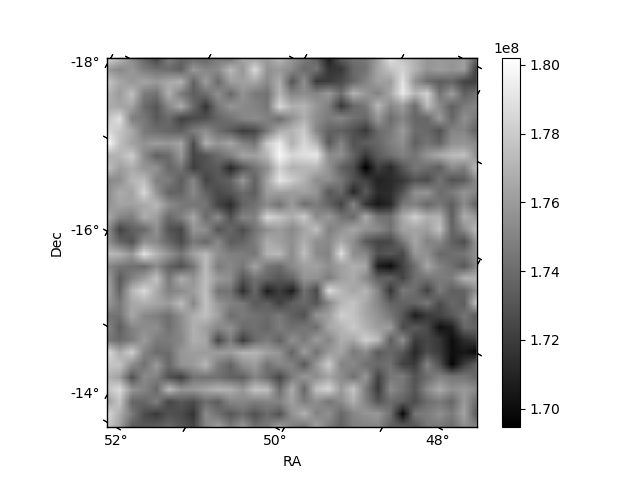
| Quadrant A | 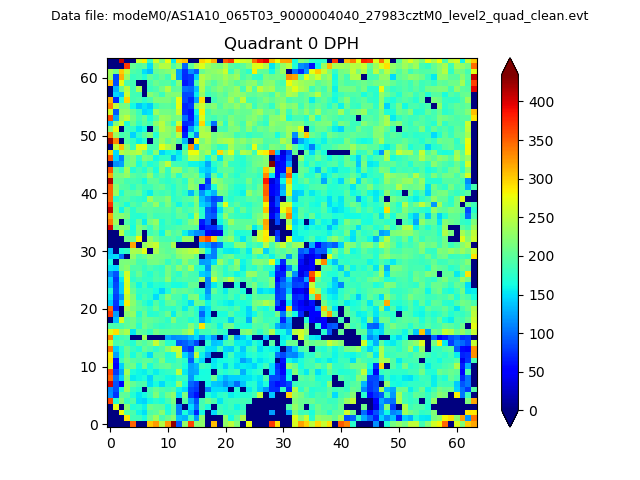 |
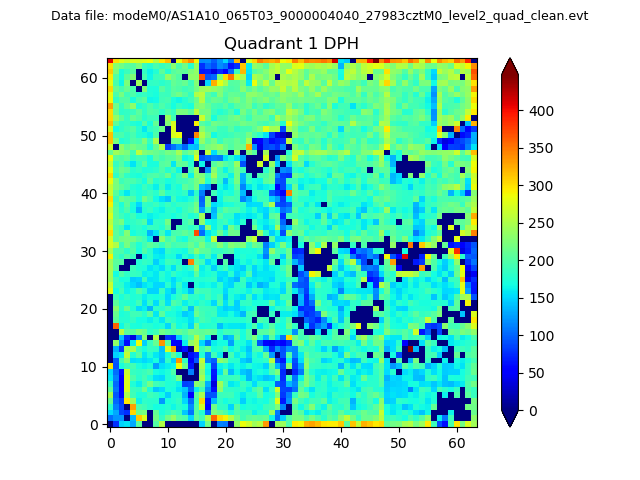 |
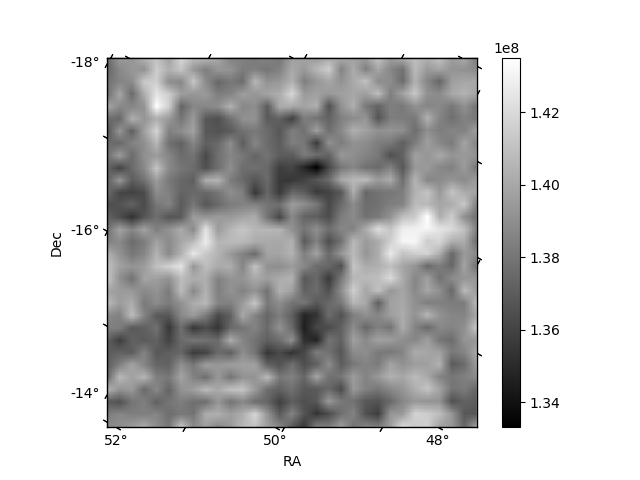
Quadrant B |
|---|---|---|---|
| Quadrant D | 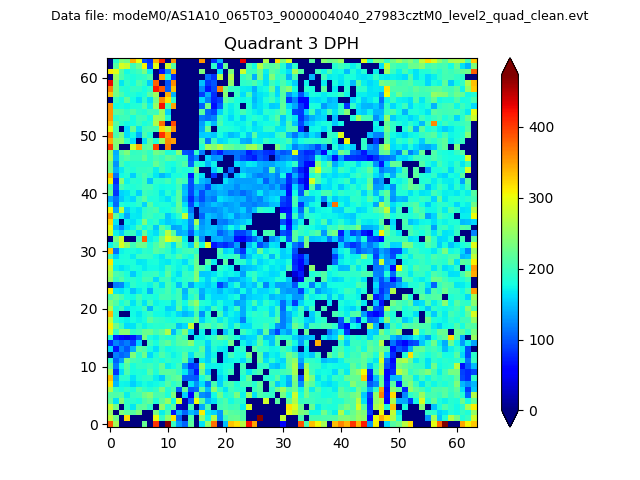 |
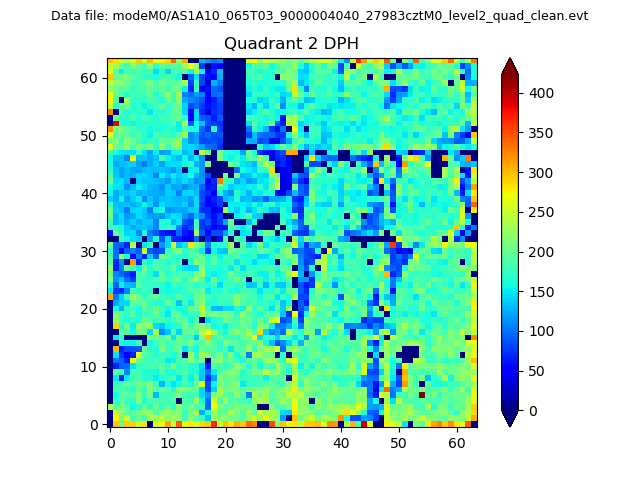 |
Quadrant C |
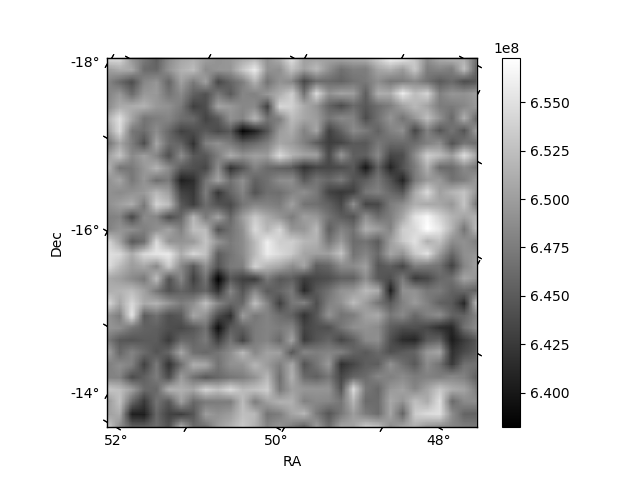
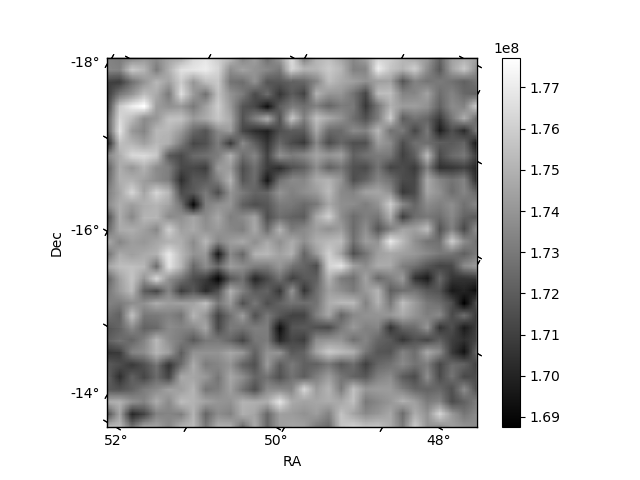
| Plot type | Count rate plots | Images |
|---|---|---|
| Comparison with Poisson distribution Blue bars denote a histogram of data divided into 1 sec bins. Red curve is a Poisson curve with rate = median count rate of data. |
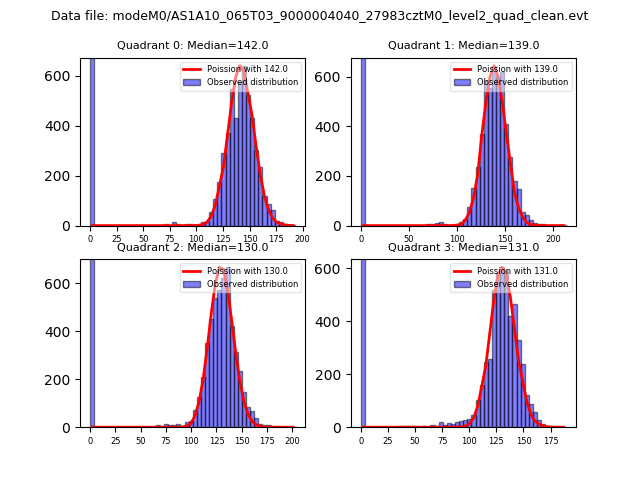 |
 |
| Quadrant-wise count rates Data is divided into 100 sec bins |
 |
|
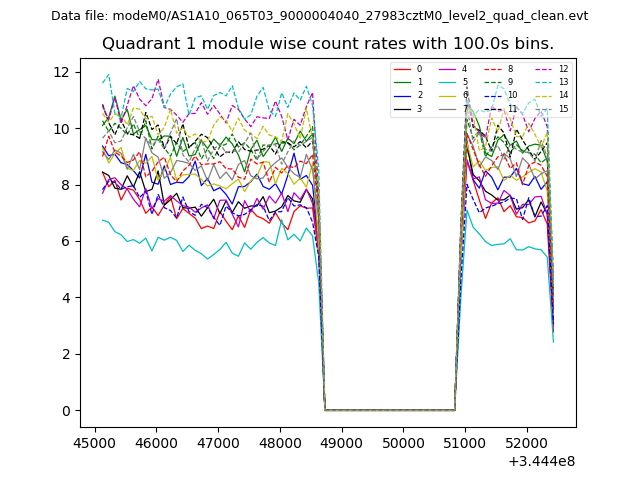
| Module-wise count rates for Quadrant A Data is divided into 100 sec bins |
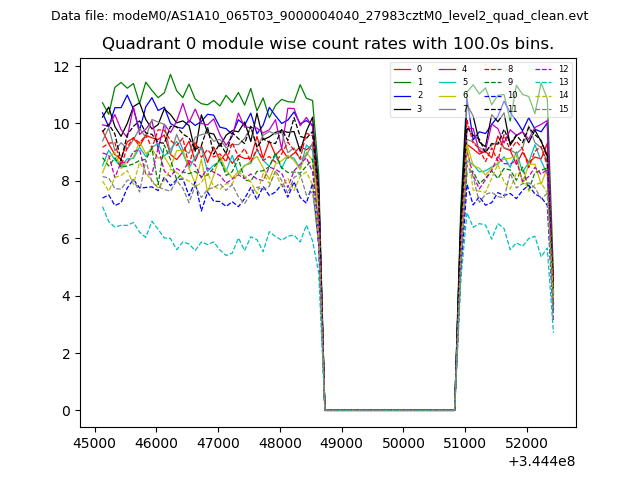 |
 |
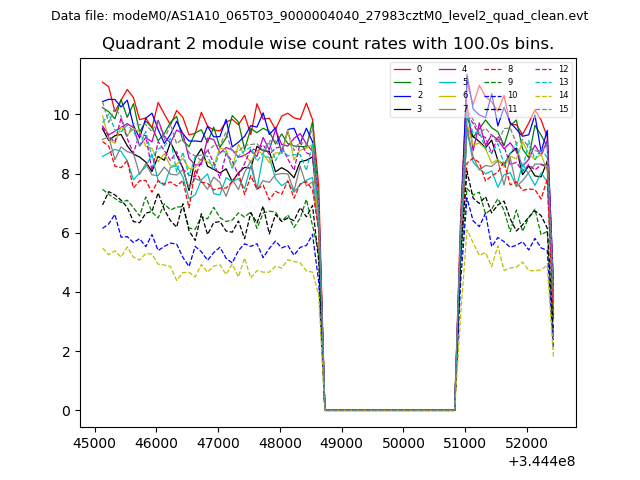
| Module-wise count rates for Quadrant B Data is divided into 100 sec bins |
 |
 |
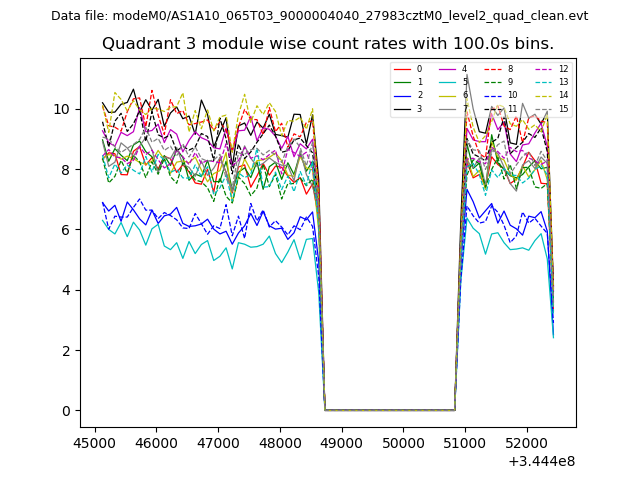
| Module-wise count rates for Quadrant C Data is divided into 100 sec bins |
 |
 |
| Module-wise count rates for Quadrant D Data is divided into 100 sec bins |
 |
 |
| Parameter | Plot |
|---|---|
| CZT HV Monitor | 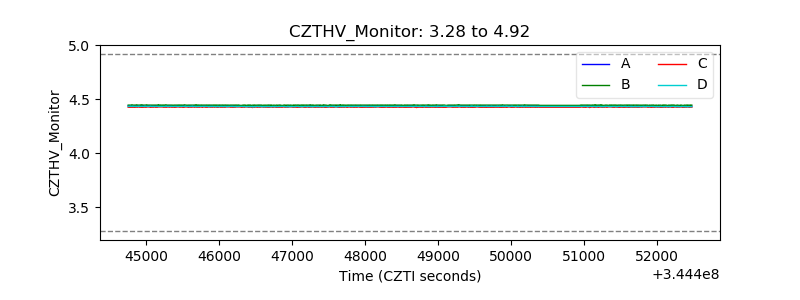 |
| D_VDD | 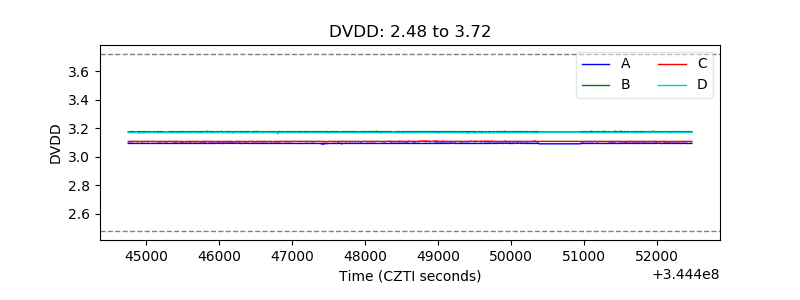 |
| Temperature 1 | 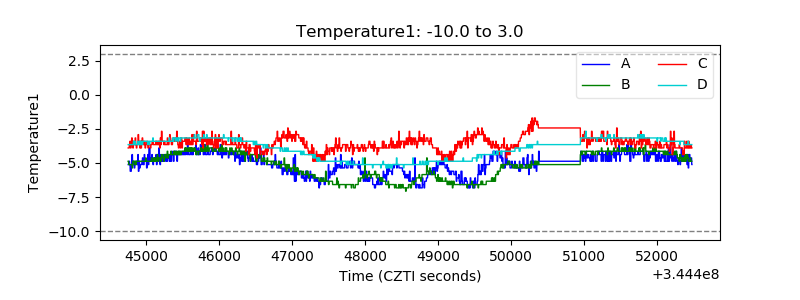 |
| Veto HV Monitor | 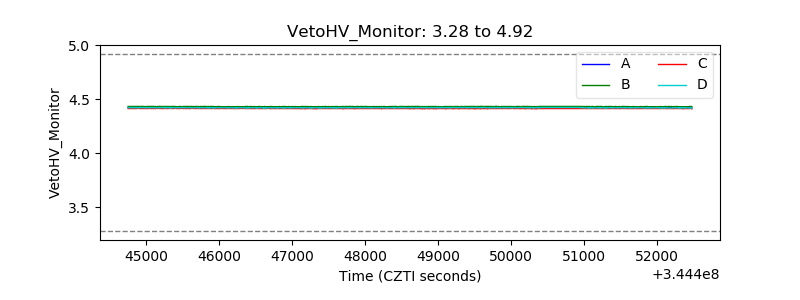 |
| Veto LLD | 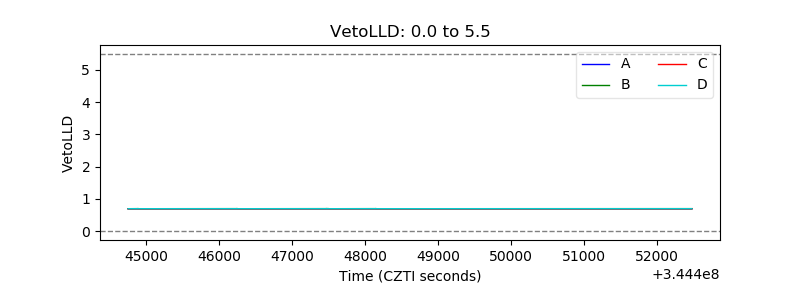 |
| Alpha Counter |  |
| _CPM_Rate | 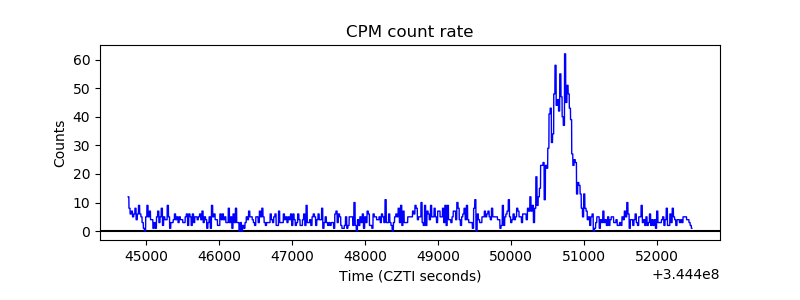 |
| CZT Counter | 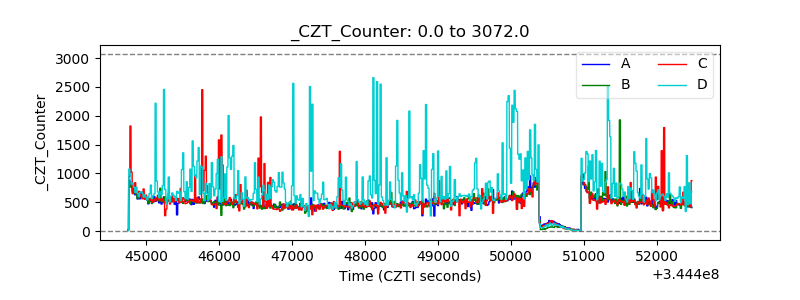 |
| +2.5 Volts monitor |  |
| +5 Volts monitor |  |
| _ROLL_ROT | 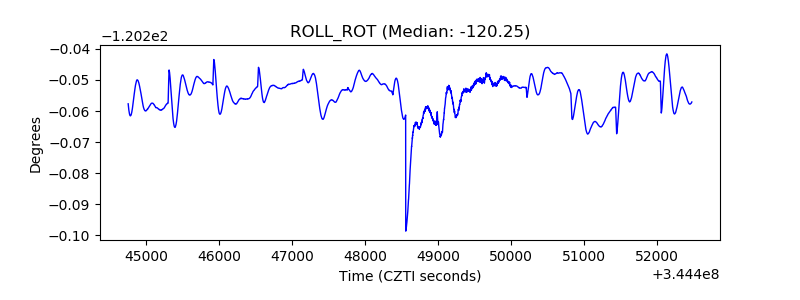 |
| _Roll_DEC | 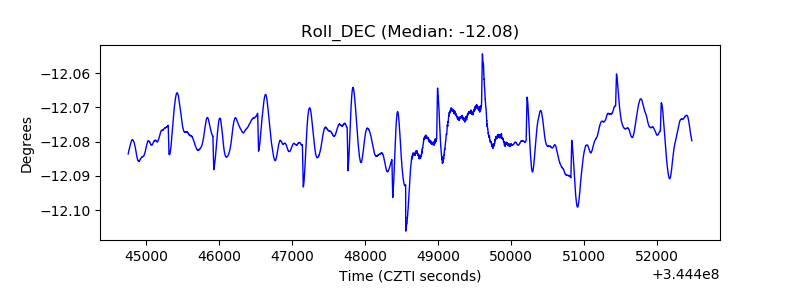 |
| _Roll_RA |  |
| Veto Counter | 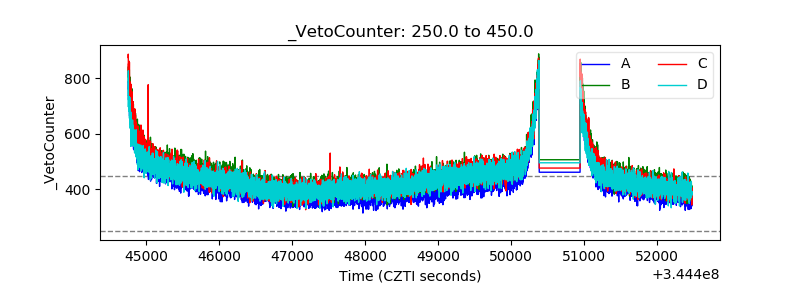 |