| Param | Original file | Final file |
|---|---|---|
| Filename | modeM0/AS1A10_065T03_9000004040_27984cztM0_level2.evt | modeM0/AS1A10_065T03_9000004040_27984cztM0_level2_quad_clean.evt |
| Size (bytes) | 530,498,880 | 103,576,320 |
| Size | 505.9 MB | 98.8 MB |
| Events in quadrant A | 3,574,823 | 686,751 |
| Events in quadrant B | 3,629,112 | 674,770 |
| Events in quadrant C | 3,666,128 | 629,543 |
| Events in quadrant D | 4,704,559 | 641,405 |
| Mode M9 | |||
|---|---|---|---|
| Quadrant | BADHDUFLAG | Total packets | Discarded packets |
| A | 0 | 2 | 0 |
| B | 0 | 2 | 0 |
| C | 0 | 2 | 0 |
| D | 0 | 2 | 0 |
| Mode M0 | |||
|---|---|---|---|
| Quadrant | BADHDUFLAG | Total packets | Discarded packets |
| A | 0 | 15093 | 0 |
| B | 0 | 15292 | 0 |
| C | 0 | 15502 | 0 |
| D | 0 | 18553 | 0 |
| Quadrant | Total seconds | Saturated seconds | Saturation percentage |
|---|---|---|---|
| A | 7245 | 64 | 0.883368% |
| B | 7246 | 121 | 1.669887% |
| C | 7246 | 116 | 1.600883% |
| D | 7246 | 152 | 2.097709% |
Noise dominated data is calculated using 1-second bins in cleaned event files. If a bin has >2000 counts, and if more than 50% of those come from <1% of pixels, then it is considered to be noise-dominated and hence unusable.
| Quadrant | # 1 sec bins | Bins with >0 counts | Bins with >2000 counts | High rate bins dominated by noise | Noise dominated (total time) | Noise dominated (detector-on time) | Marked lightcurve |
|---|---|---|---|---|---|---|---|
| A | 7440 | 7247 | 0 | 0 | 0.00% | 0.00% | 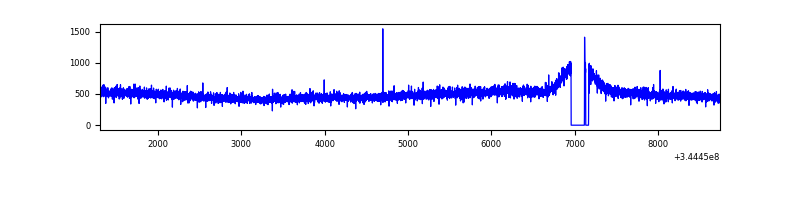 |
| B | 7441 | 7248 | 1 | 1 | 0.01% | 0.01% | 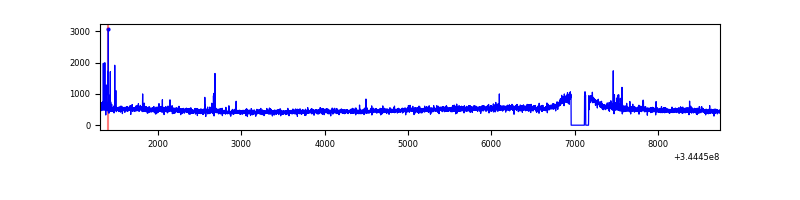 |
| C | 7441 | 7248 | 5 | 5 | 0.07% | 0.07% | 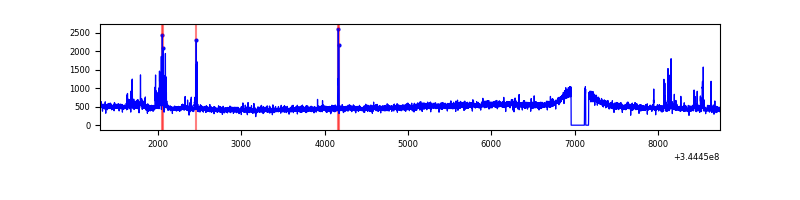 |
| D | 7441 | 7247 | 115 | 115 | 1.55% | 1.59% | 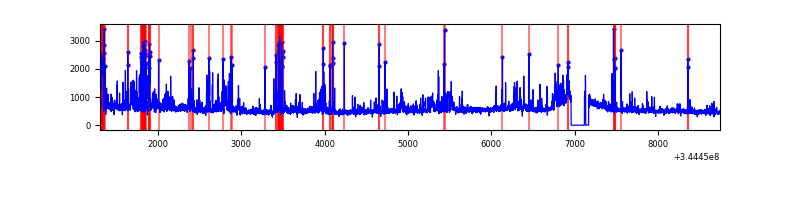 |
Top three noisy pixels from each quadrant. If the there are fewer than three noisy pixels in the level2.evt file, extra rows are filled as -1
| Pixel properties | Quadrant properties | ||||||
|---|---|---|---|---|---|---|---|
| Quadrant | DetID | PixID | Counts | Sigma | Mean | Median | Sigma |
| A | 13 | 254 | 10491 | 51.11 | 925 | 908 | 187.5 |
| A | 3 | 137 | 9290 | 44.7 | 925 | 908 | 187.5 |
| A | 0 | 226 | 7784 | 36.67 | 925 | 908 | 187.5 |
| B | 12 | 111 | 22584 | 123.6 | 907 | 884 | 175.6 |
| B | 11 | 111 | 20465 | 111.53 | 907 | 884 | 175.6 |
| B | 14 | 111 | 19873 | 108.16 | 907 | 884 | 175.6 |
| C | 14 | 238 | 139025 | 678.23 | 868 | 873 | 203.7 |
| C | 10 | 22 | 85563 | 415.77 | 868 | 873 | 203.7 |
| C | 3 | 233 | 59946 | 290.01 | 868 | 873 | 203.7 |
| D | 1 | 52 | 997593 | 4729.81 | 880 | 856 | 210.7 |
| D | 8 | 195 | 261746 | 1238.0 | 880 | 856 | 210.7 |
| D | 7 | 80 | 95933 | 451.17 | 880 | 856 | 210.7 |
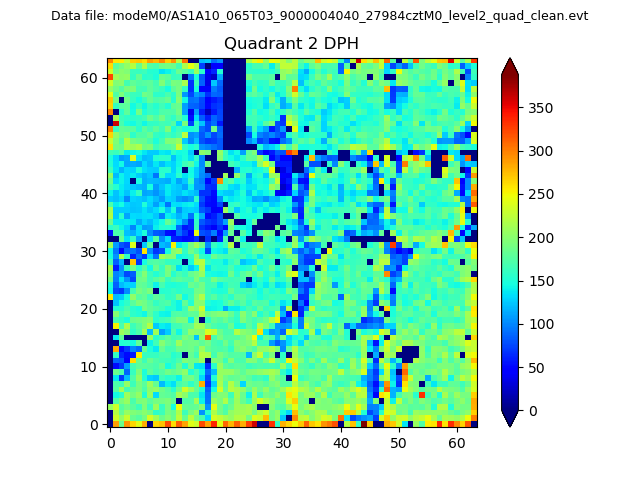
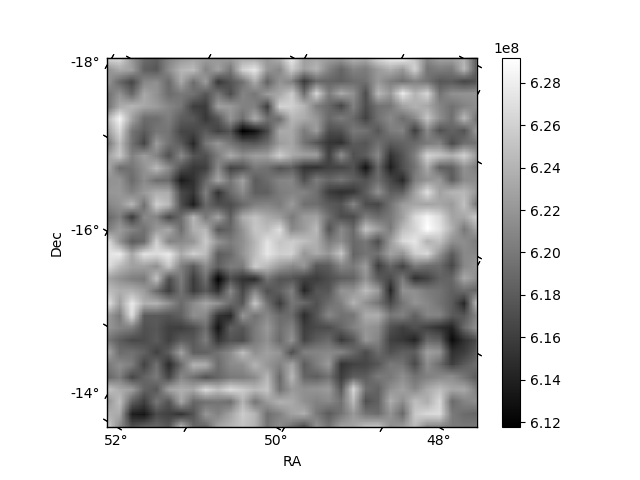
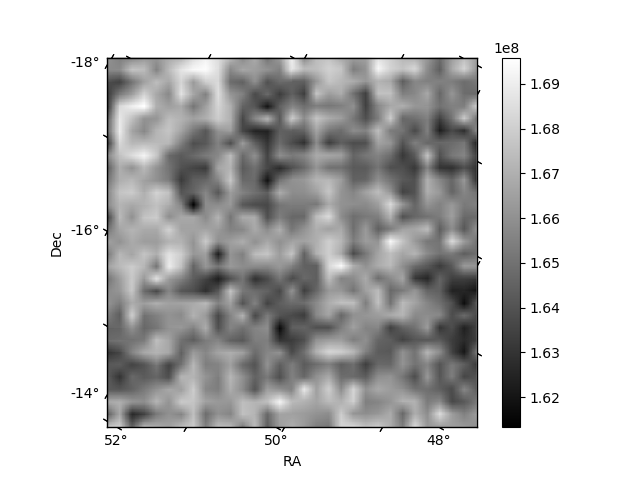
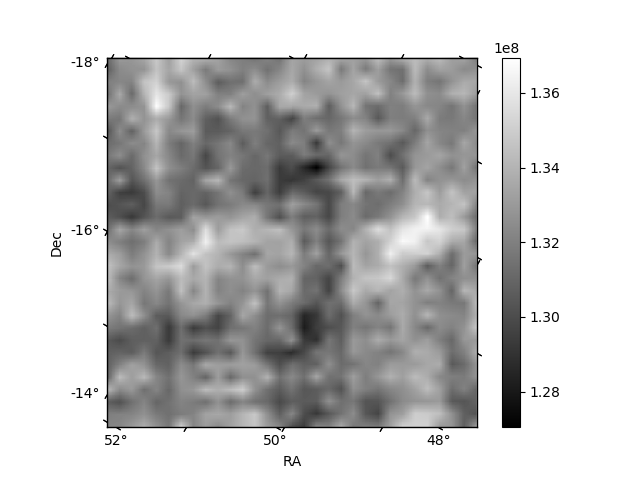
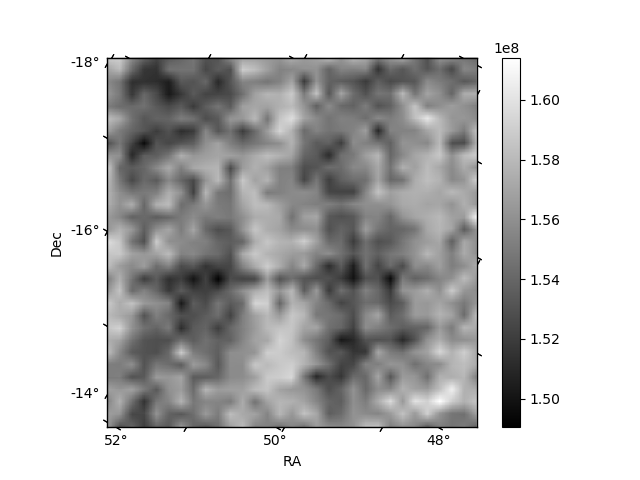
Histogram calculated using DETX and DETY for each event in the final _common_clean file
| Quadrant A | 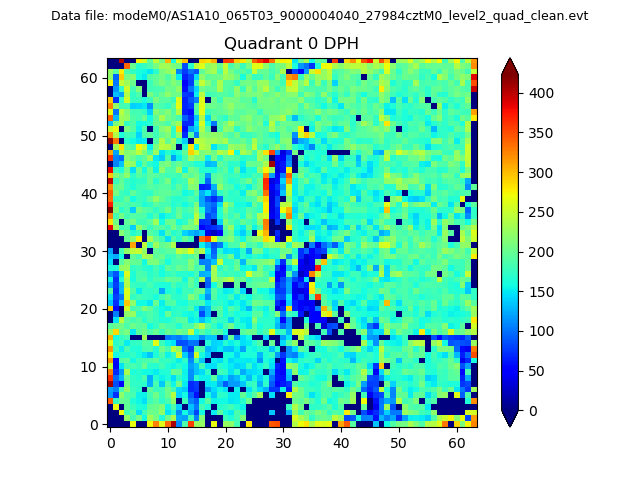 |
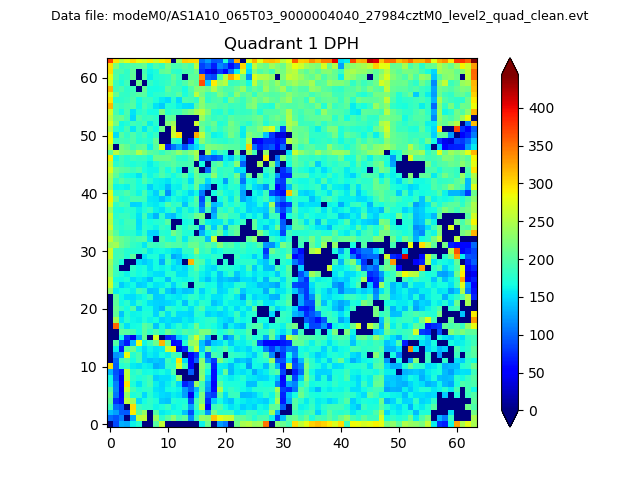 |
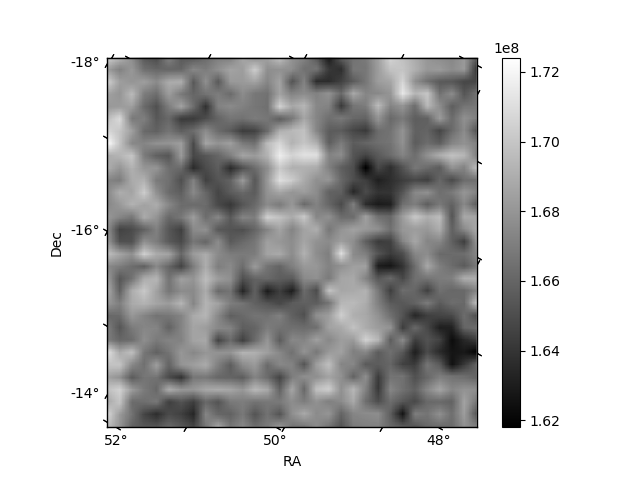
Quadrant B |
|---|---|---|---|
| Quadrant D | 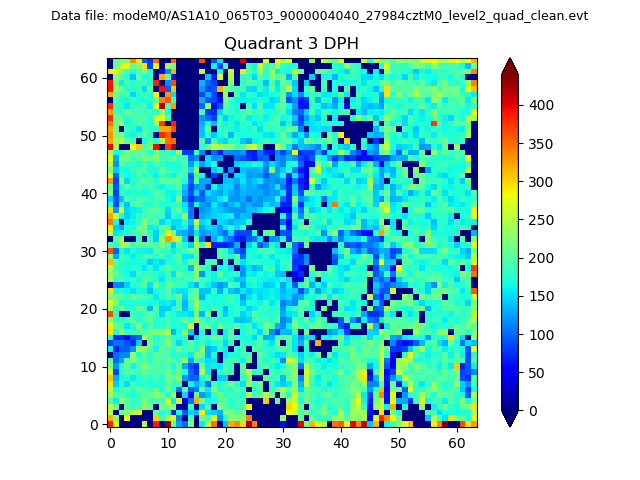 |
 |
Quadrant C |
| Plot type | Count rate plots | Images |
|---|---|---|
| Comparison with Poisson distribution Blue bars denote a histogram of data divided into 1 sec bins. Red curve is a Poisson curve with rate = median count rate of data. |
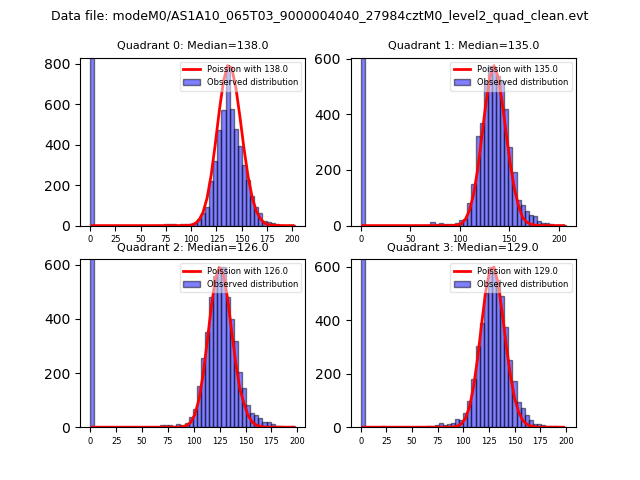 |
 |
| Quadrant-wise count rates Data is divided into 100 sec bins |
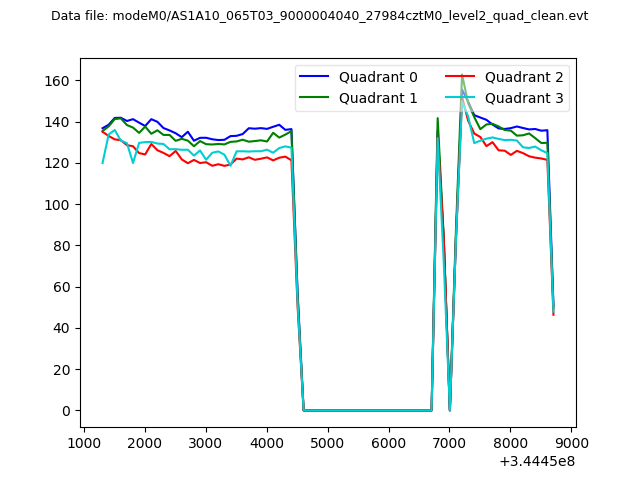 |
|
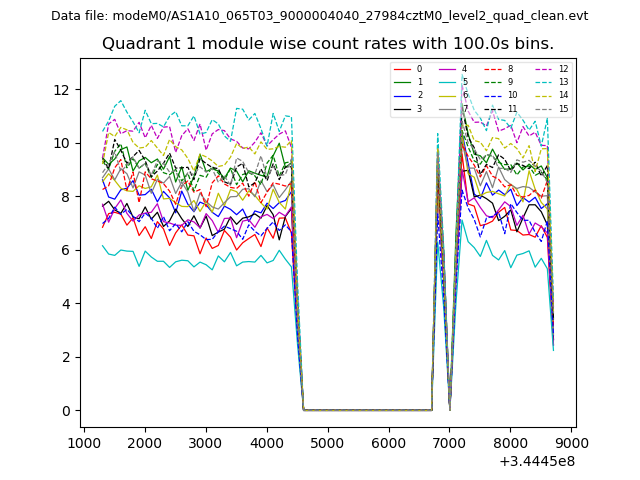
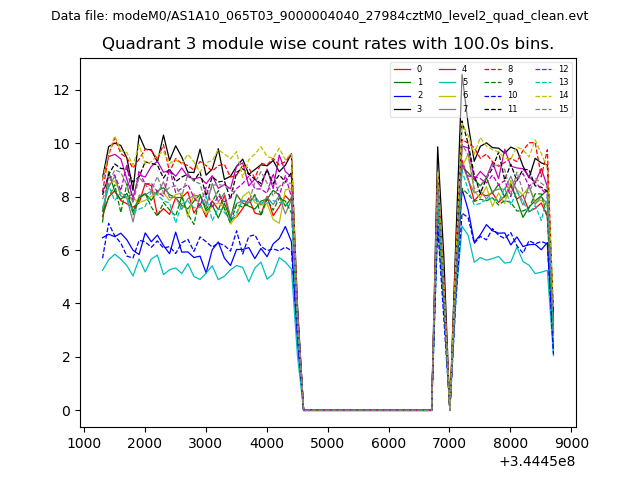
| Module-wise count rates for Quadrant A Data is divided into 100 sec bins |
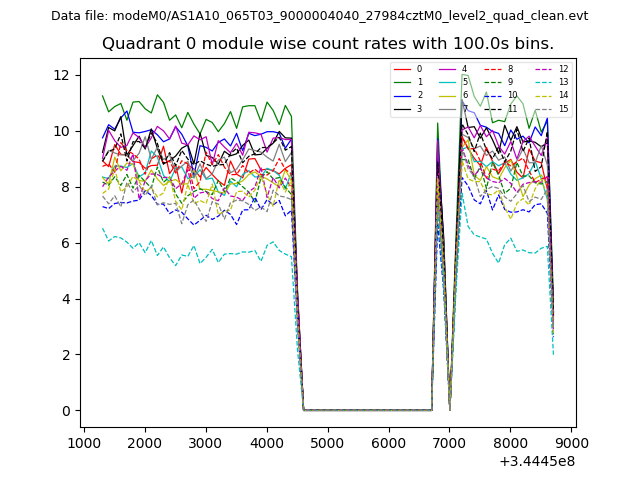 |
 |
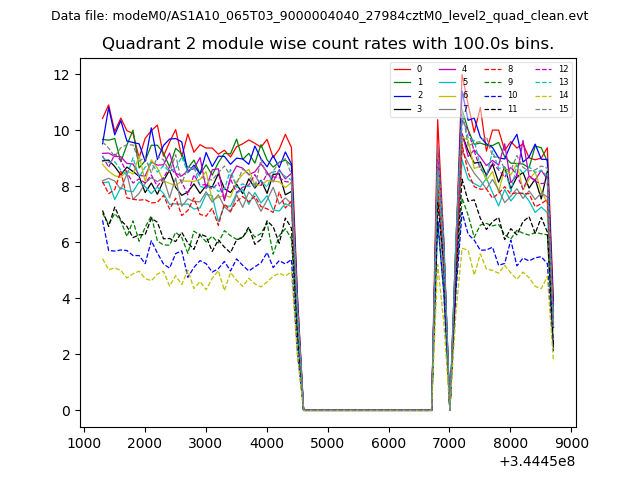
| Module-wise count rates for Quadrant B Data is divided into 100 sec bins |
 |
 |
| Module-wise count rates for Quadrant C Data is divided into 100 sec bins |
 |
 |
| Module-wise count rates for Quadrant D Data is divided into 100 sec bins |
 |
 |
| Parameter | Plot |
|---|---|
| CZT HV Monitor | 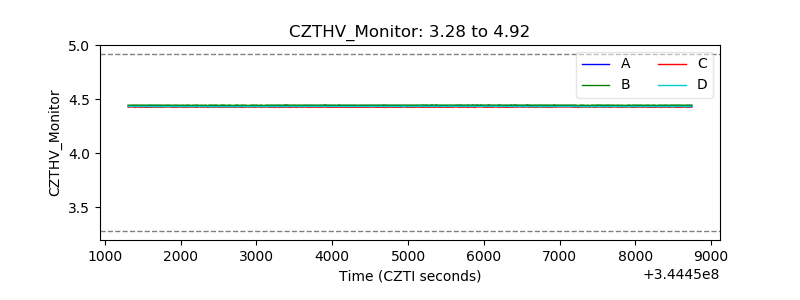 |
| D_VDD | 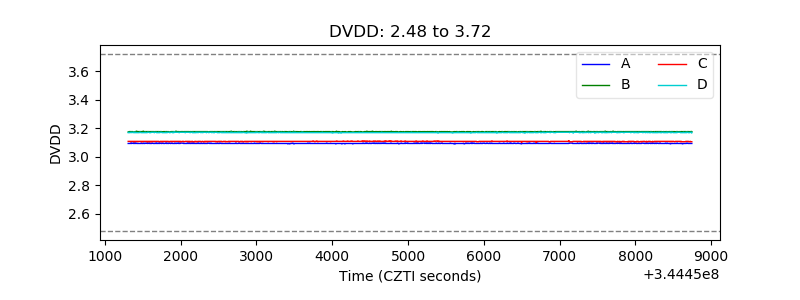 |
| Temperature 1 | 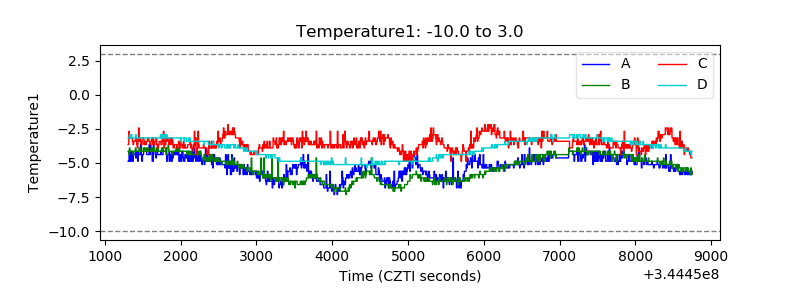 |
| Veto HV Monitor | 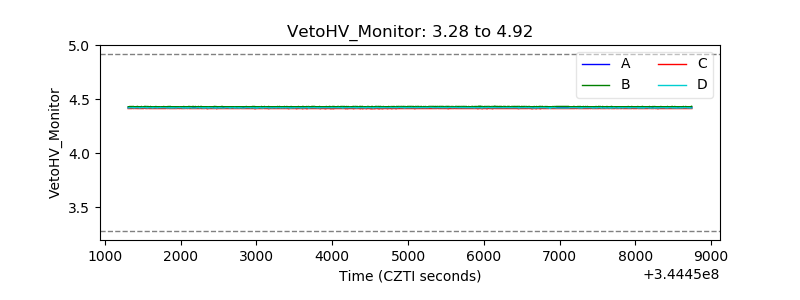 |
| Veto LLD | 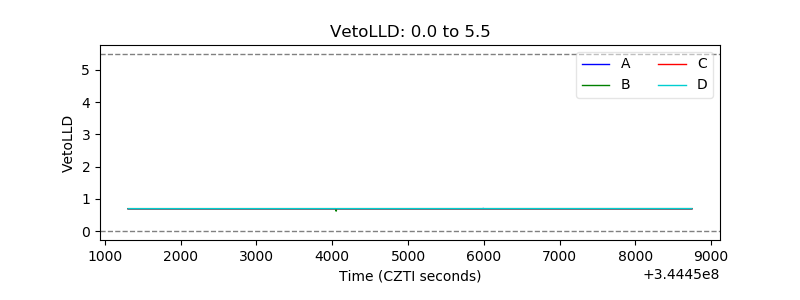 |
| Alpha Counter | 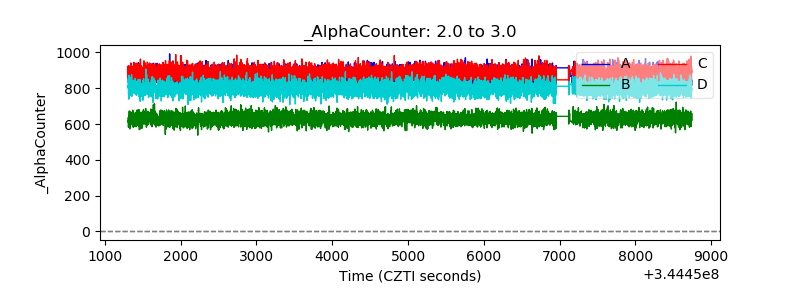 |
| _CPM_Rate | 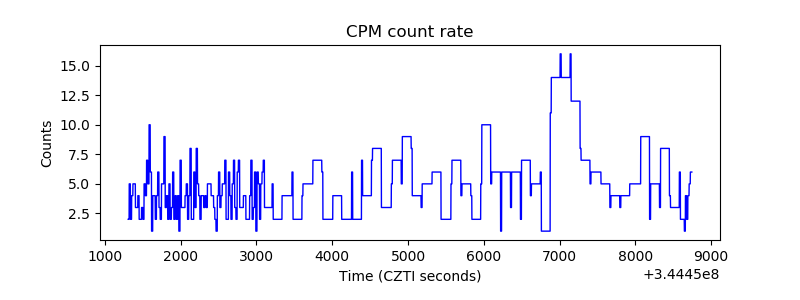 |
| CZT Counter |  |
| +2.5 Volts monitor | 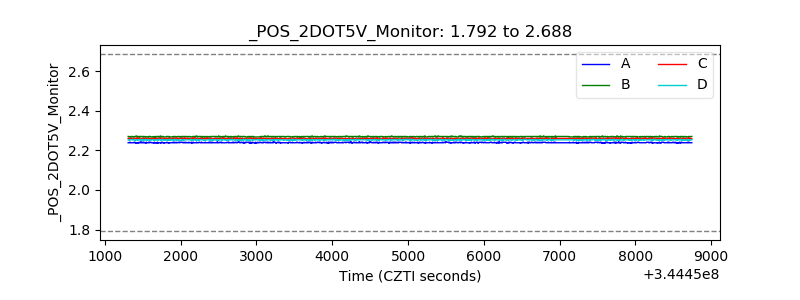 |
| +5 Volts monitor | 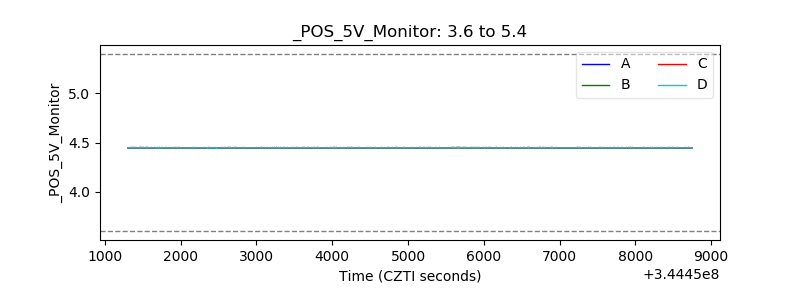 |
| _ROLL_ROT | 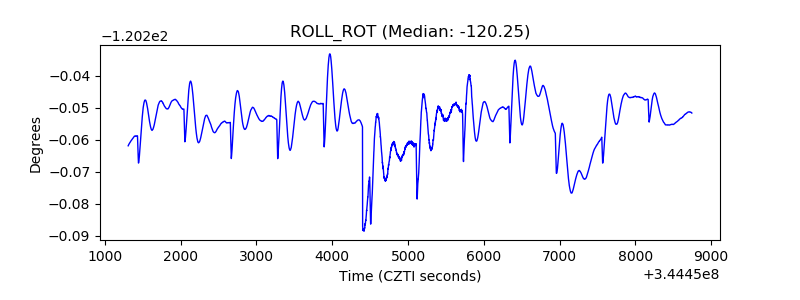 |
| _Roll_DEC | 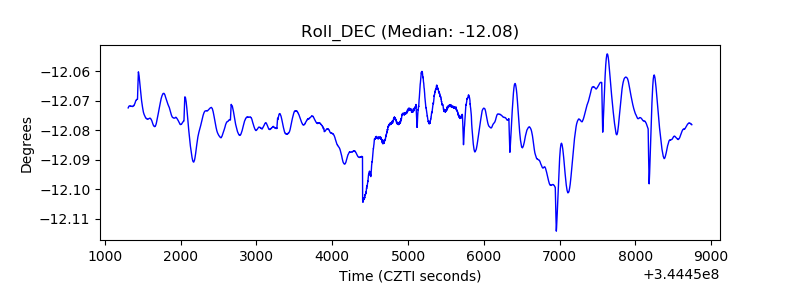 |
| _Roll_RA | 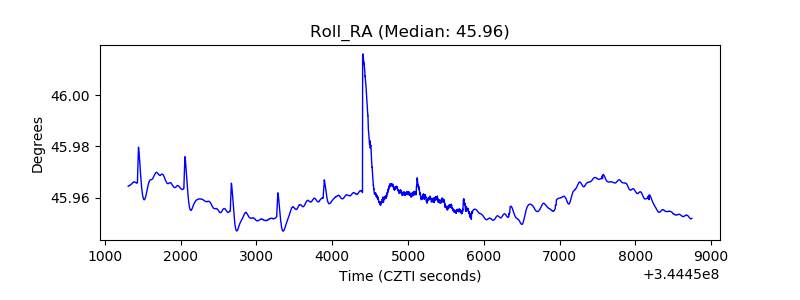 |
| Veto Counter | 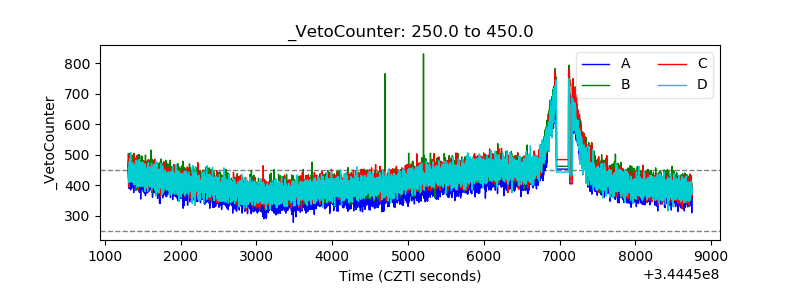 |