| Param | Original file | Final file |
|---|---|---|
| Filename | modeM0/AS1A10_065T03_9000004040_27985cztM0_level2.evt | modeM0/AS1A10_065T03_9000004040_27985cztM0_level2_quad_clean.evt |
| Size (bytes) | 1,847,897,280 | 344,280,960 |
| Size | 1.7 GB | 328.3 MB |
| Events in quadrant A | 12,769,035 | 2,277,676 |
| Events in quadrant B | 12,013,549 | 2,271,606 |
| Events in quadrant C | 12,712,111 | 2,113,749 |
| Events in quadrant D | 16,858,740 | 2,122,642 |
| Mode M9 | |||
|---|---|---|---|
| Quadrant | BADHDUFLAG | Total packets | Discarded packets |
| A | 0 | 18 | 0 |
| B | 0 | 18 | 0 |
| C | 0 | 18 | 0 |
| D | 0 | 18 | 0 |
| Mode M0 | |||
|---|---|---|---|
| Quadrant | BADHDUFLAG | Total packets | Discarded packets |
| A | 0 | 52686 | 0 |
| B | 0 | 50452 | 0 |
| C | 0 | 53012 | 0 |
| D | 0 | 65744 | 0 |
| Quadrant | Total seconds | Saturated seconds | Saturation percentage |
|---|---|---|---|
| A | 23857 | 764 | 3.202414% |
| B | 23858 | 490 | 2.053818% |
| C | 23858 | 600 | 2.514880% |
| D | 23857 | 942 | 3.948527% |
Noise dominated data is calculated using 1-second bins in cleaned event files. If a bin has >2000 counts, and if more than 50% of those come from <1% of pixels, then it is considered to be noise-dominated and hence unusable.
| Quadrant | # 1 sec bins | Bins with >0 counts | Bins with >2000 counts | High rate bins dominated by noise | Noise dominated (total time) | Noise dominated (detector-on time) | Marked lightcurve |
|---|---|---|---|---|---|---|---|
| A | 25782 | 23860 | 401 | 401 | 1.56% | 1.68% | 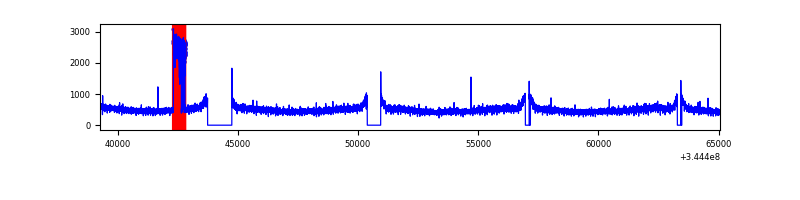 |
| B | 25783 | 23860 | 2 | 2 | 0.01% | 0.01% | 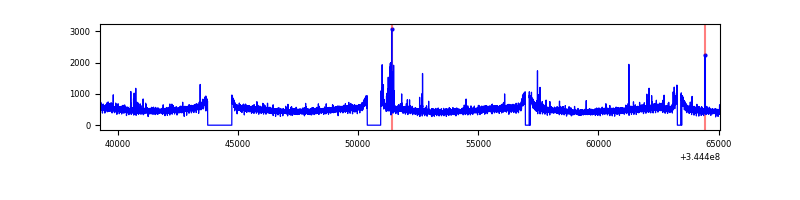 |
| C | 25783 | 23861 | 106 | 106 | 0.41% | 0.44% | 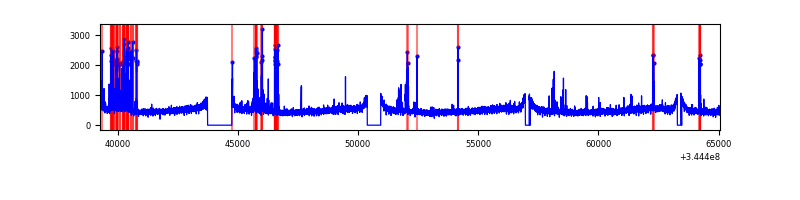 |
| D | 25782 | 23859 | 613 | 613 | 2.38% | 2.57% | 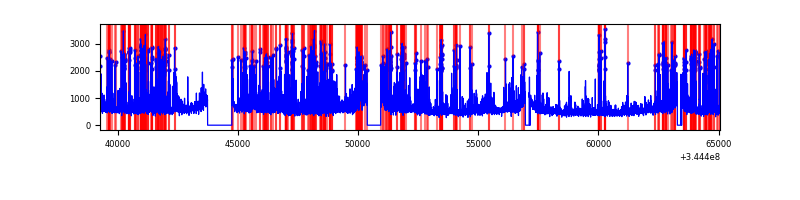 |
Top three noisy pixels from each quadrant. If the there are fewer than three noisy pixels in the level2.evt file, extra rows are filled as -1
| Pixel properties | Quadrant properties | ||||||
|---|---|---|---|---|---|---|---|
| Quadrant | DetID | PixID | Counts | Sigma | Mean | Median | Sigma |
| A | 6 | 16 | 975448 | 1596.31 | 3058 | 3002 | 609.2 |
| A | 13 | 254 | 32987 | 49.22 | 3058 | 3002 | 609.2 |
| A | 3 | 137 | 30158 | 44.58 | 3058 | 3002 | 609.2 |
| B | 12 | 111 | 74505 | 123.79 | 3026 | 2950 | 578.0 |
| B | 11 | 111 | 67466 | 111.61 | 3026 | 2950 | 578.0 |
| B | 14 | 111 | 65003 | 107.35 | 3026 | 2950 | 578.0 |
| C | 10 | 22 | 846253 | 1249.82 | 2894 | 2916 | 674.8 |
| C | 14 | 238 | 463458 | 682.52 | 2894 | 2916 | 674.8 |
| C | 3 | 233 | 111100 | 160.33 | 2894 | 2916 | 674.8 |
| D | 1 | 52 | 4249464 | 6141.51 | 2923 | 2850 | 691.5 |
| D | 8 | 195 | 1189853 | 1716.66 | 2923 | 2850 | 691.5 |
| D | 7 | 80 | 332211 | 476.33 | 2923 | 2850 | 691.5 |
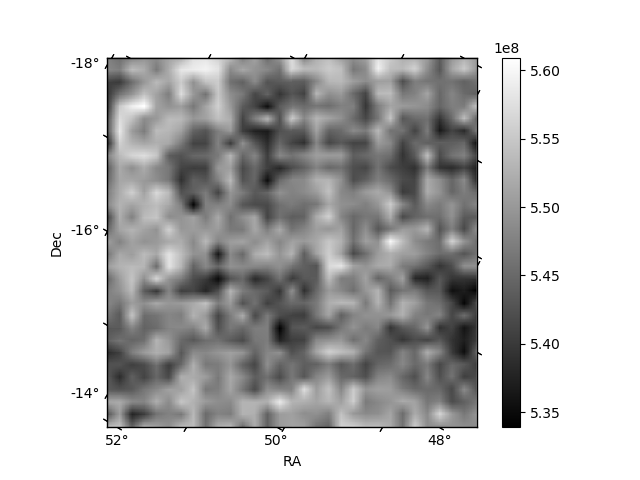
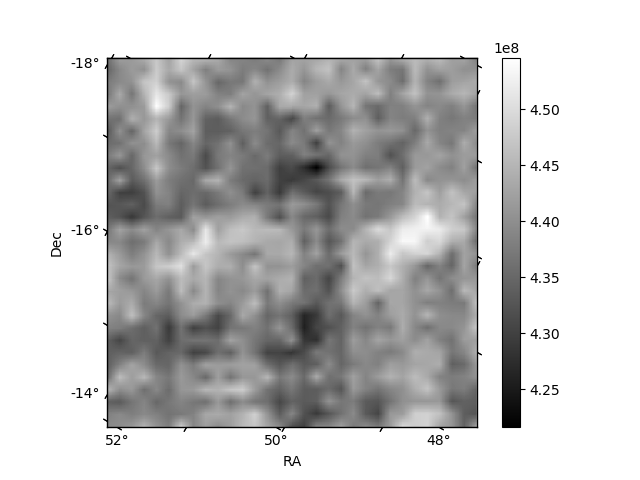
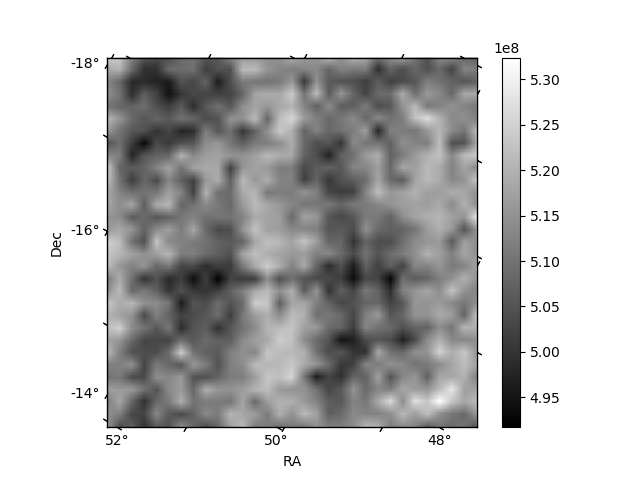
Histogram calculated using DETX and DETY for each event in the final _common_clean file
| Quadrant A |  |
 |
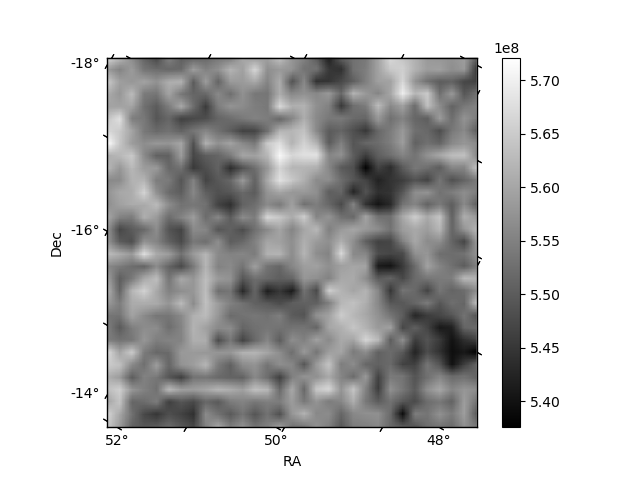
Quadrant B |
|---|---|---|---|
| Quadrant D | 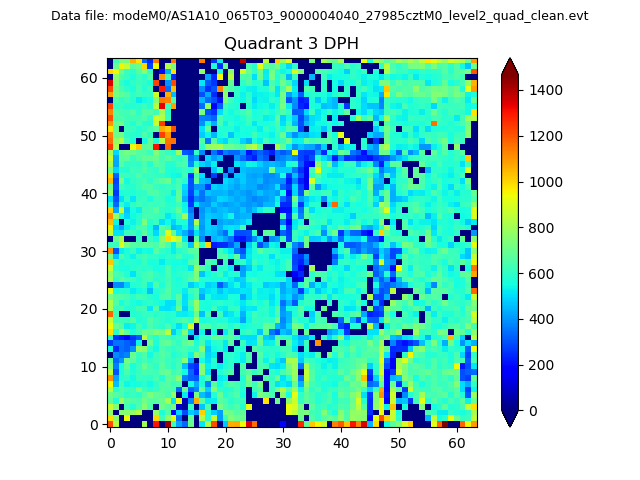 |
 |
Quadrant C |
| Plot type | Count rate plots | Images |
|---|---|---|
| Comparison with Poisson distribution Blue bars denote a histogram of data divided into 1 sec bins. Red curve is a Poisson curve with rate = median count rate of data. |
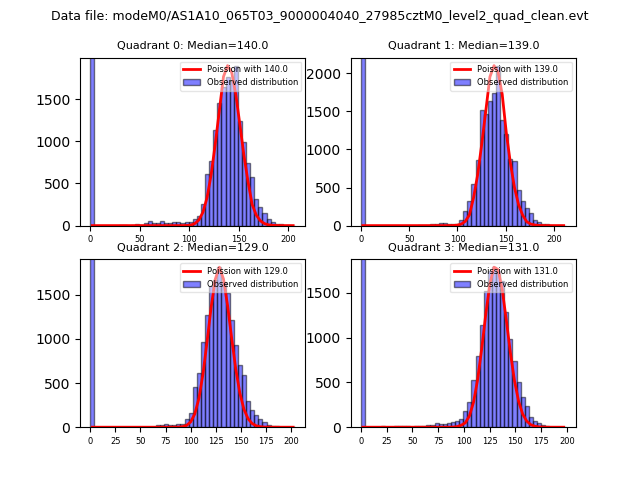 |
 |
| Quadrant-wise count rates Data is divided into 100 sec bins |
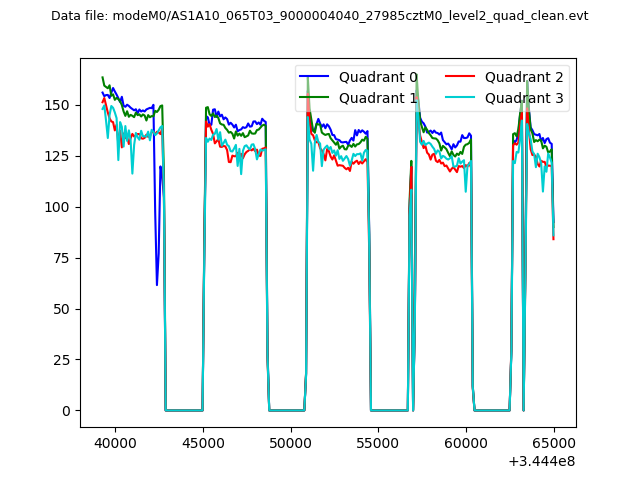 |
|
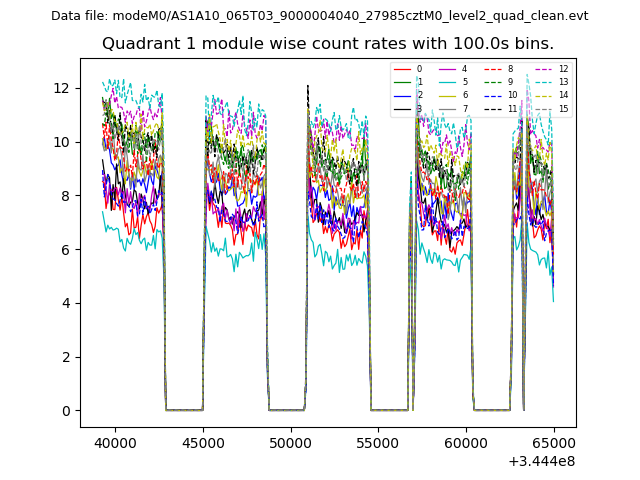
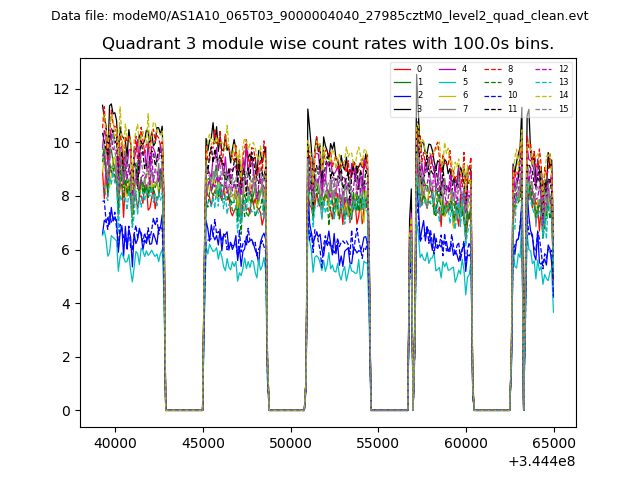
| Module-wise count rates for Quadrant A Data is divided into 100 sec bins |
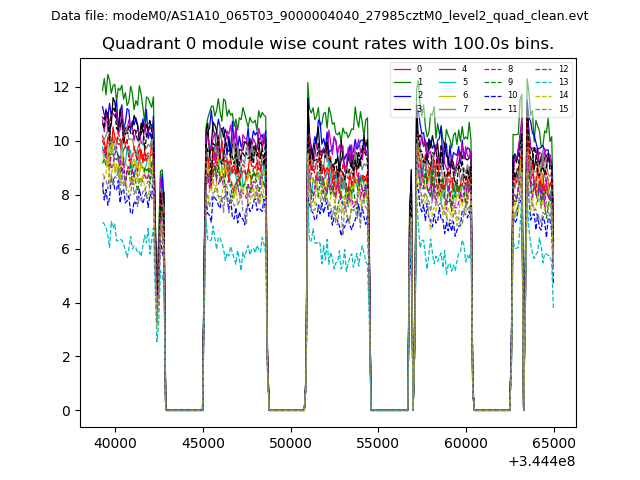 |
 |
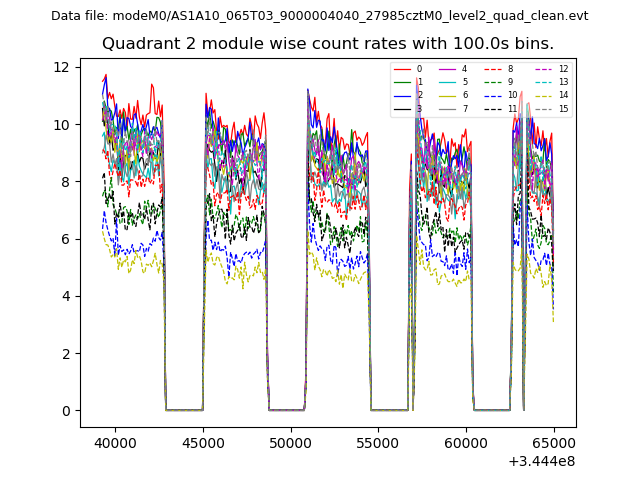
| Module-wise count rates for Quadrant B Data is divided into 100 sec bins |
 |
 |
| Module-wise count rates for Quadrant C Data is divided into 100 sec bins |
 |
 |
| Module-wise count rates for Quadrant D Data is divided into 100 sec bins |
 |
 |
| Parameter | Plot |
|---|---|
| CZT HV Monitor | 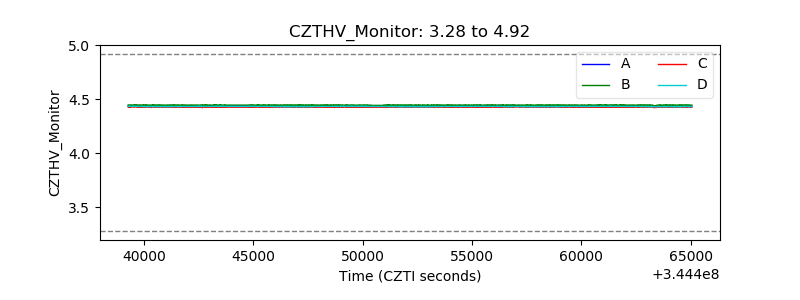 |
| D_VDD | 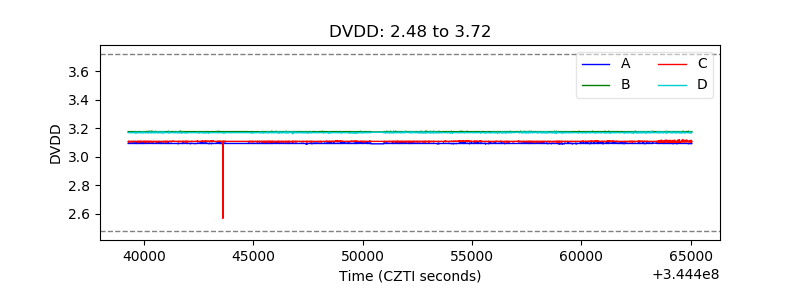 |
| Temperature 1 | 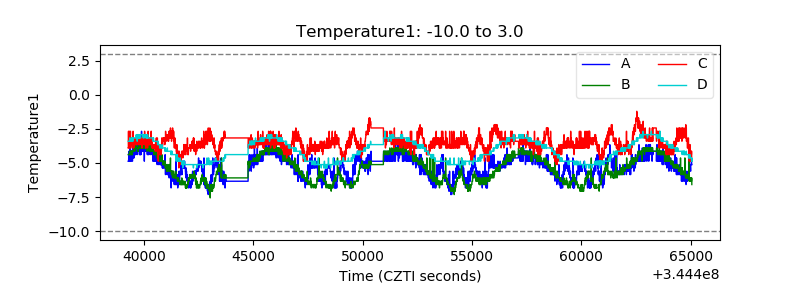 |
| Veto HV Monitor | 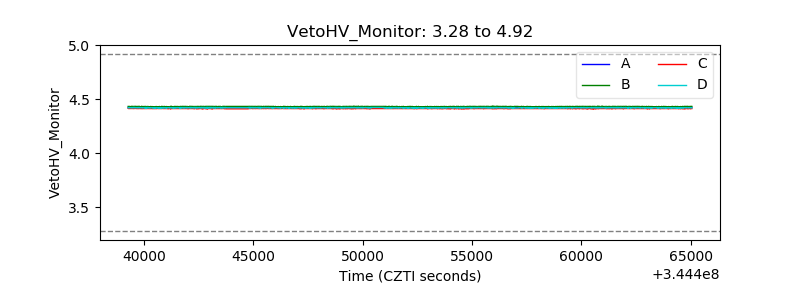 |
| Veto LLD | 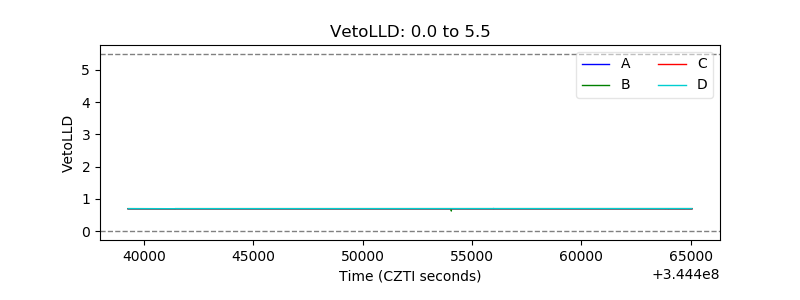 |
| Alpha Counter | 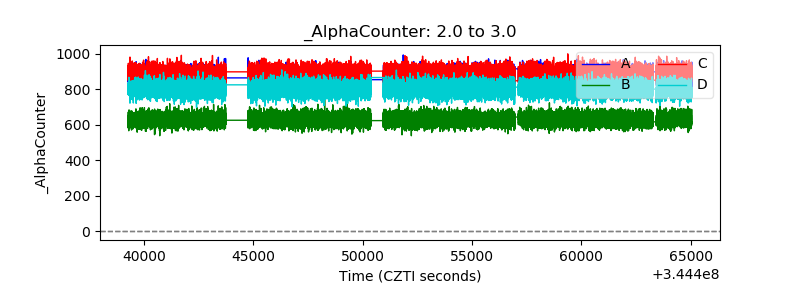 |
| _CPM_Rate | 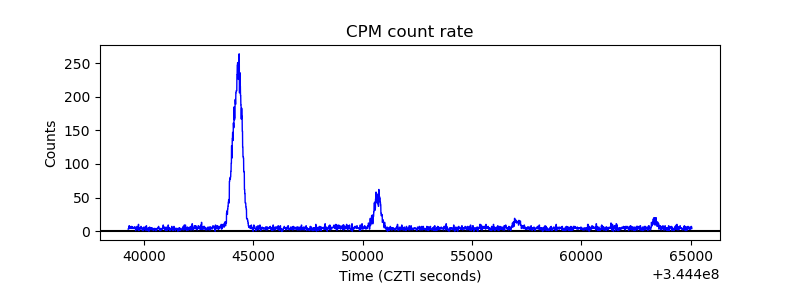 |
| CZT Counter |  |
| +2.5 Volts monitor |  |
| +5 Volts monitor |  |
| _ROLL_ROT |  |
| _Roll_DEC | 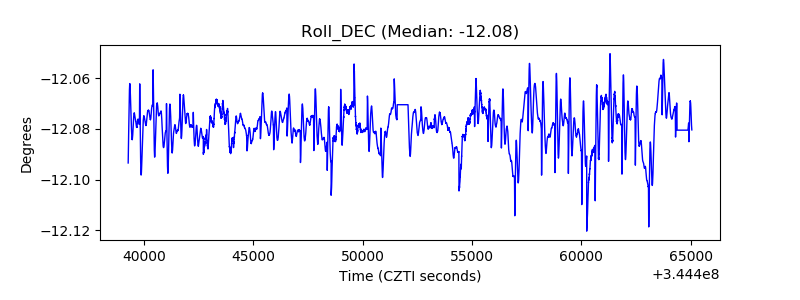 |
| _Roll_RA |  |
| Veto Counter | 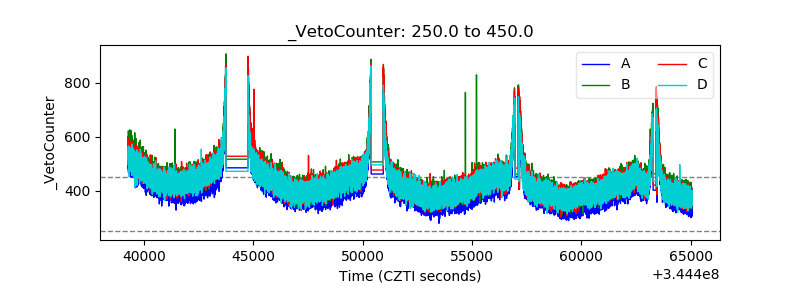 |