| Param | Original file | Final file |
|---|---|---|
| Filename | modeM0/AS1A10_065T03_9000004040_27986cztM0_level2.evt | modeM0/AS1A10_065T03_9000004040_27986cztM0_level2_quad_clean.evt |
| Size (bytes) | 562,288,320 | 110,001,600 |
| Size | 536.2 MB | 104.9 MB |
| Events in quadrant A | 3,711,187 | 731,576 |
| Events in quadrant B | 3,738,028 | 718,405 |
| Events in quadrant C | 3,919,350 | 671,302 |
| Events in quadrant D | 5,139,605 | 676,173 |
| Mode M9 | |||
|---|---|---|---|
| Quadrant | BADHDUFLAG | Total packets | Discarded packets |
| A | 0 | 5 | 0 |
| B | 0 | 5 | 0 |
| C | 0 | 5 | 0 |
| D | 0 | 5 | 0 |
| Mode M0 | |||
|---|---|---|---|
| Quadrant | BADHDUFLAG | Total packets | Discarded packets |
| A | 0 | 15971 | 0 |
| B | 0 | 15998 | 0 |
| C | 0 | 16630 | 0 |
| D | 0 | 20310 | 0 |
| Quadrant | Total seconds | Saturated seconds | Saturation percentage |
|---|---|---|---|
| A | 7668 | 61 | 0.795514% |
| B | 7669 | 99 | 1.290911% |
| C | 7668 | 129 | 1.682316% |
| D | 7668 | 277 | 3.612415% |
Noise dominated data is calculated using 1-second bins in cleaned event files. If a bin has >2000 counts, and if more than 50% of those come from <1% of pixels, then it is considered to be noise-dominated and hence unusable.
| Quadrant | # 1 sec bins | Bins with >0 counts | Bins with >2000 counts | High rate bins dominated by noise | Noise dominated (total time) | Noise dominated (detector-on time) | Marked lightcurve |
|---|---|---|---|---|---|---|---|
| A | 8263 | 7670 | 0 | 0 | 0.00% | 0.00% | 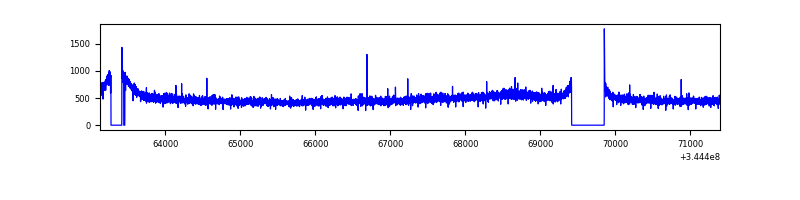 |
| B | 8264 | 7670 | 1 | 1 | 0.01% | 0.01% | 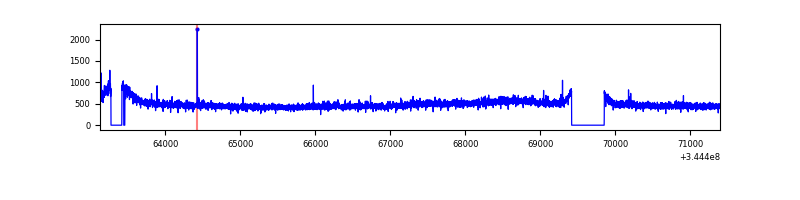 |
| C | 8263 | 7670 | 16 | 16 | 0.19% | 0.21% | 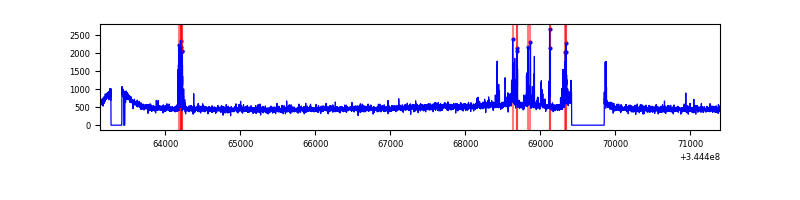 |
| D | 8263 | 7670 | 172 | 172 | 2.08% | 2.24% | 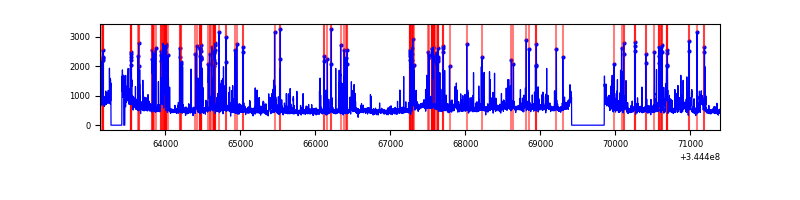 |
Top three noisy pixels from each quadrant. If the there are fewer than three noisy pixels in the level2.evt file, extra rows are filled as -1
| Pixel properties | Quadrant properties | ||||||
|---|---|---|---|---|---|---|---|
| Quadrant | DetID | PixID | Counts | Sigma | Mean | Median | Sigma |
| A | 13 | 254 | 11054 | 51.96 | 961 | 944 | 194.6 |
| A | 3 | 137 | 9683 | 44.92 | 961 | 944 | 194.6 |
| A | 8 | 192 | 8214 | 37.37 | 961 | 944 | 194.6 |
| B | 12 | 111 | 23831 | 122.39 | 946 | 919 | 187.2 |
| B | 11 | 111 | 22053 | 112.89 | 946 | 919 | 187.2 |
| B | 14 | 111 | 20896 | 106.71 | 946 | 919 | 187.2 |
| C | 10 | 22 | 220698 | 1024.12 | 904 | 908 | 214.6 |
| C | 14 | 238 | 143528 | 664.54 | 904 | 908 | 214.6 |
| C | 3 | 233 | 20153 | 89.67 | 904 | 908 | 214.6 |
| D | 1 | 52 | 1342379 | 6224.35 | 910 | 889 | 215.5 |
| D | 8 | 195 | 273425 | 1264.53 | 910 | 889 | 215.5 |
| D | 7 | 80 | 48000 | 218.59 | 910 | 889 | 215.5 |
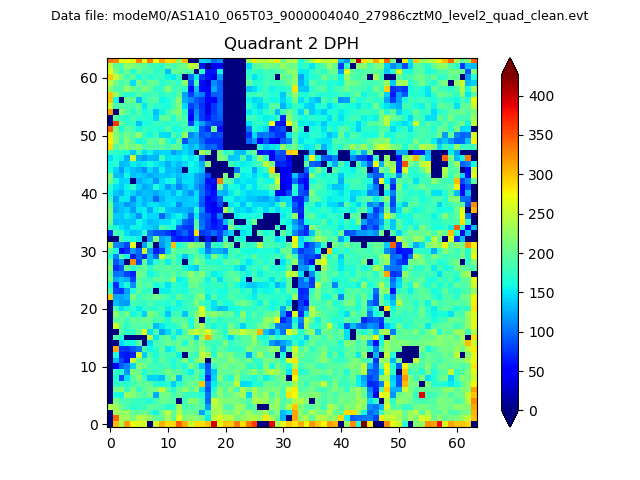
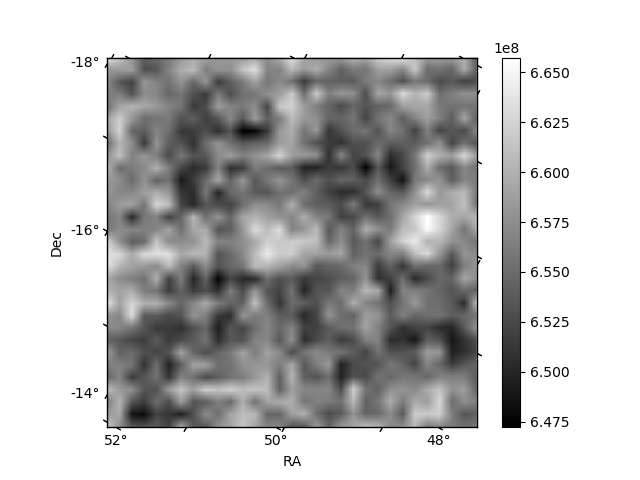
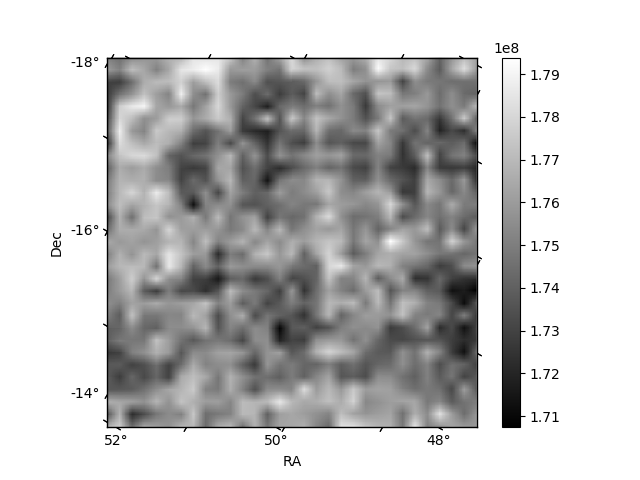
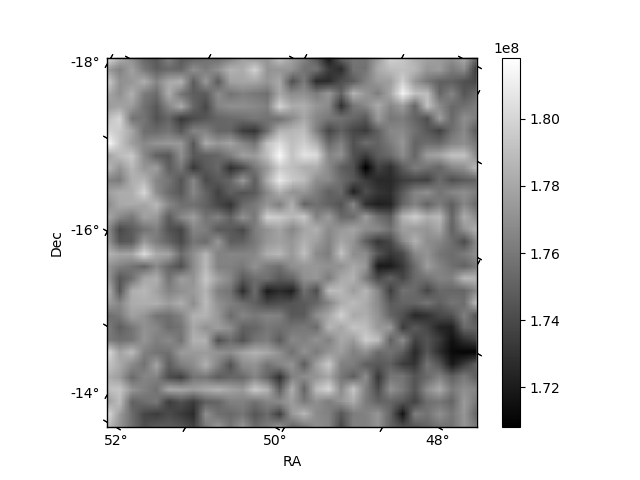
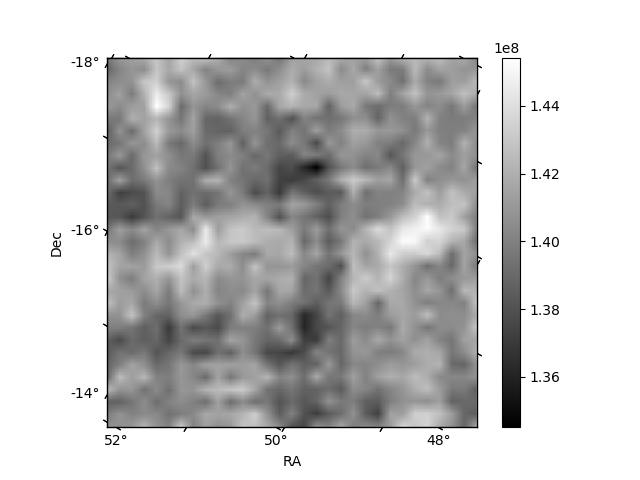
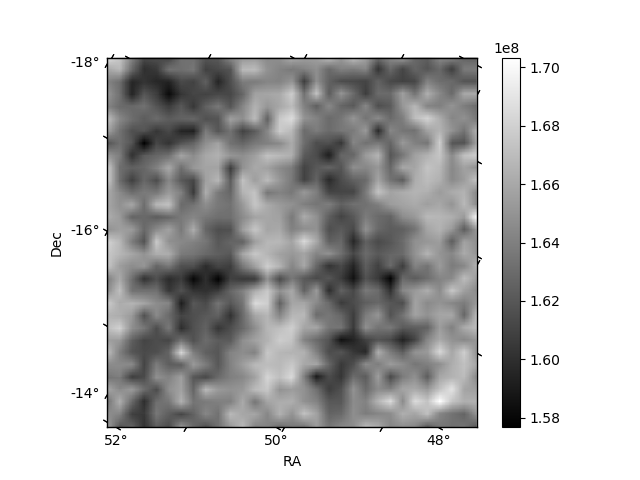
Histogram calculated using DETX and DETY for each event in the final _common_clean file
| Quadrant A | 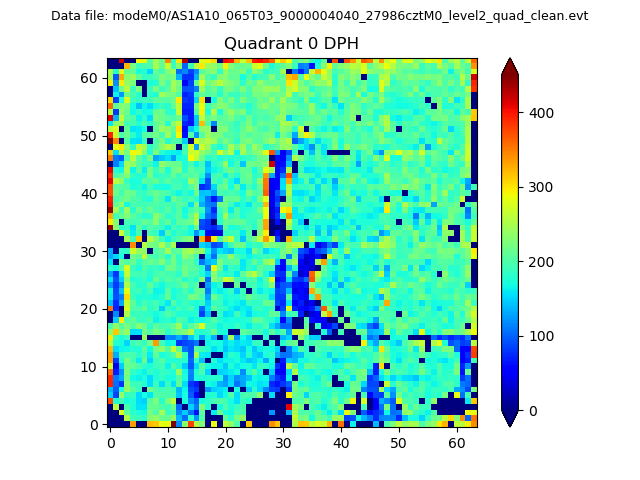 |
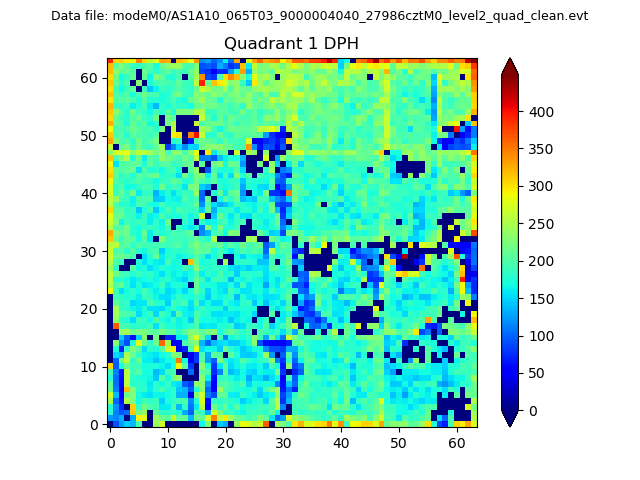 |
Quadrant B |
|---|---|---|---|
| Quadrant D | 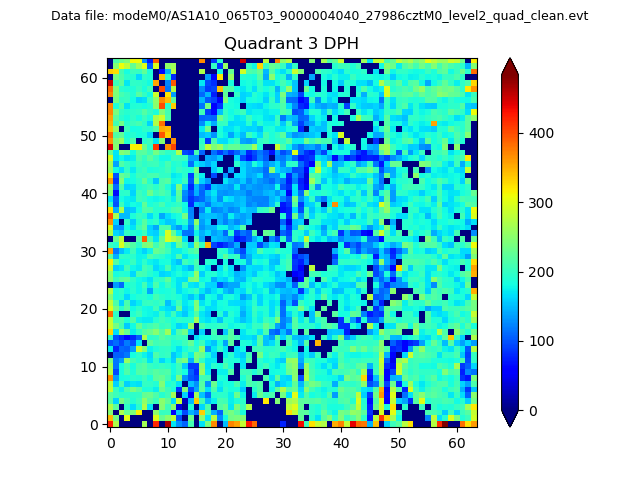 |
 |
Quadrant C |
| Plot type | Count rate plots | Images |
|---|---|---|
| Comparison with Poisson distribution Blue bars denote a histogram of data divided into 1 sec bins. Red curve is a Poisson curve with rate = median count rate of data. |
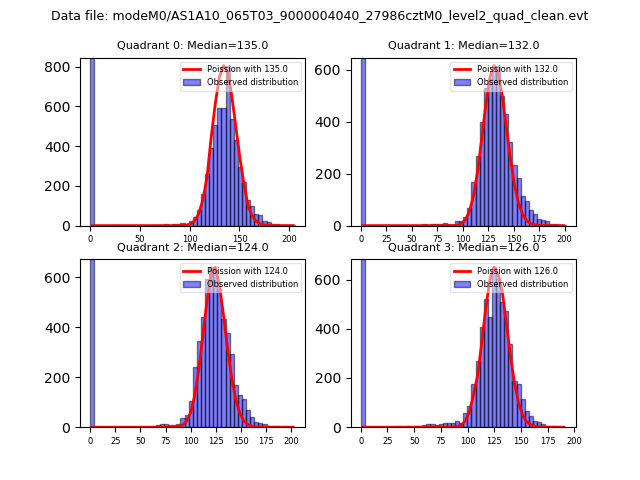 |
 |
| Quadrant-wise count rates Data is divided into 100 sec bins |
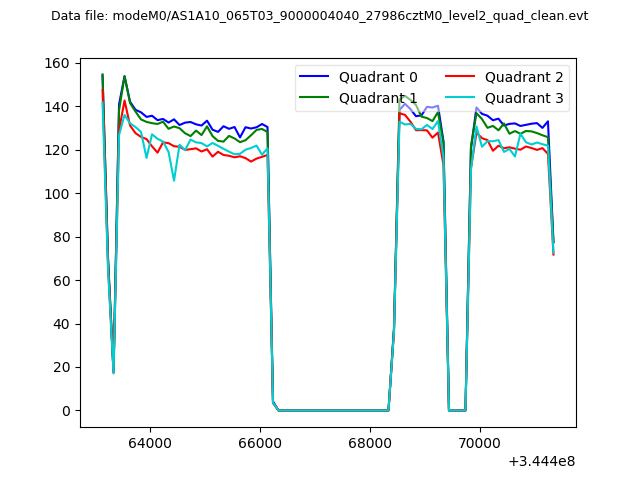 |
|
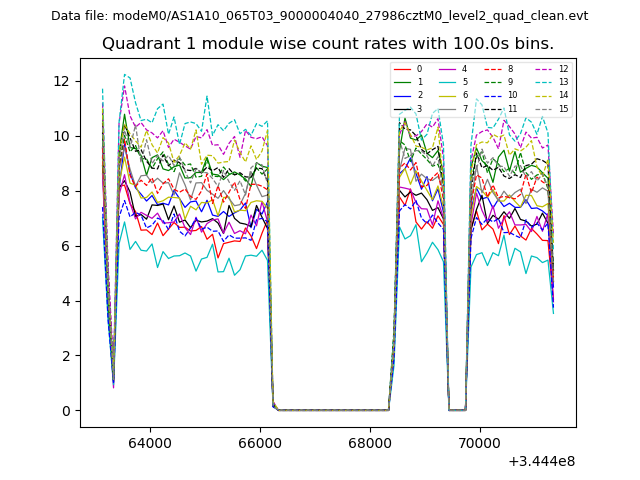
| Module-wise count rates for Quadrant A Data is divided into 100 sec bins |
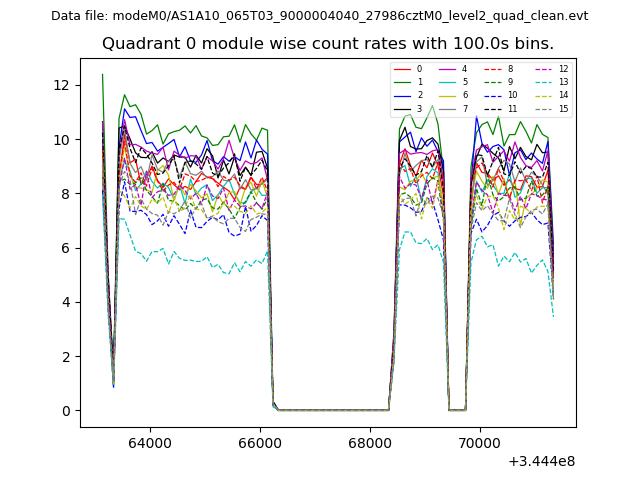 |
 |
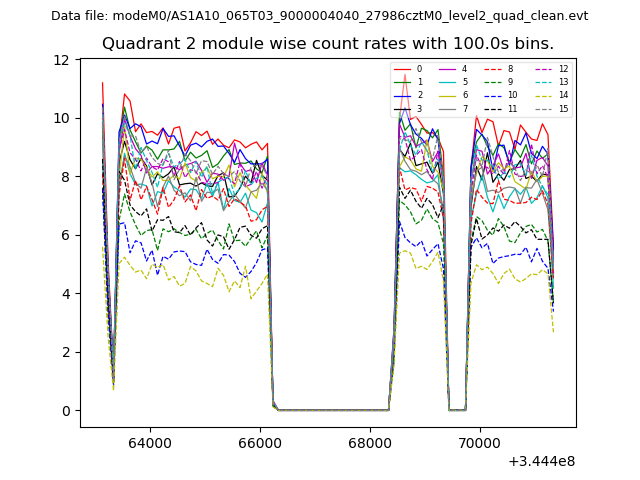
| Module-wise count rates for Quadrant B Data is divided into 100 sec bins |
 |
 |
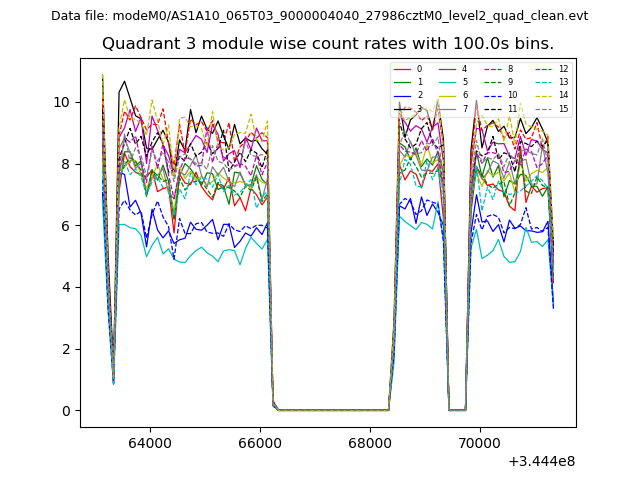
| Module-wise count rates for Quadrant C Data is divided into 100 sec bins |
 |
 |
| Module-wise count rates for Quadrant D Data is divided into 100 sec bins |
 |
 |
| Parameter | Plot |
|---|---|
| CZT HV Monitor | 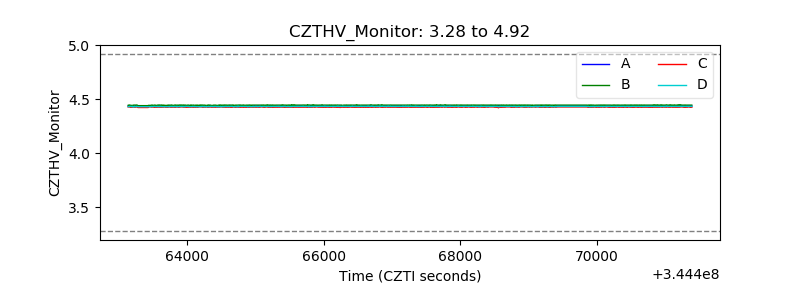 |
| D_VDD | 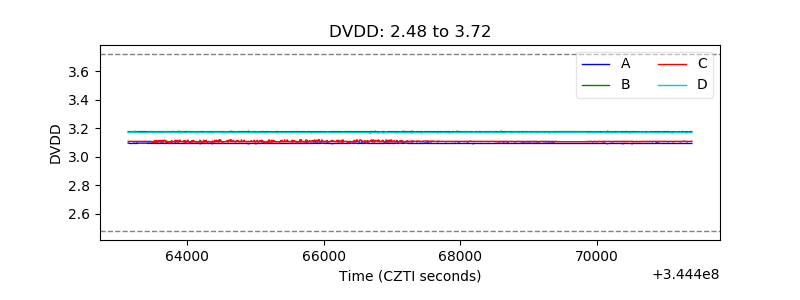 |
| Temperature 1 | 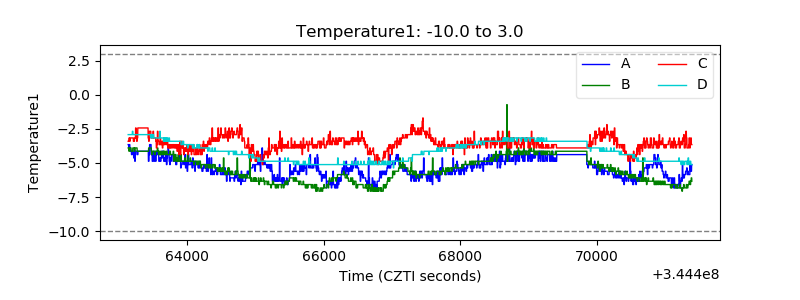 |
| Veto HV Monitor | 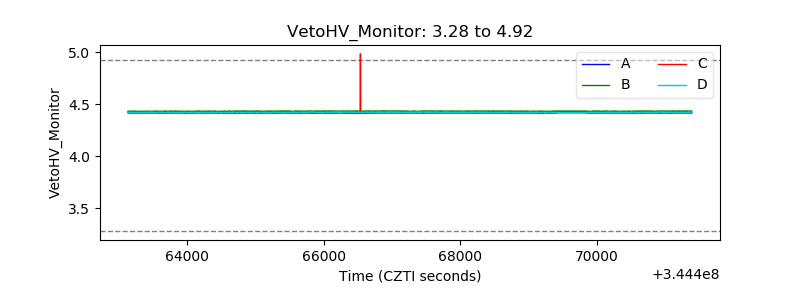 |
| Veto LLD | 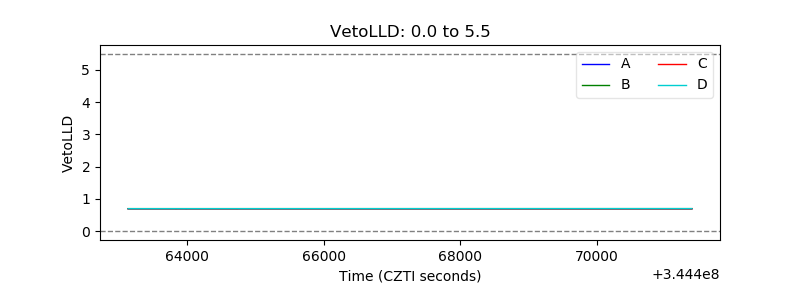 |
| Alpha Counter | 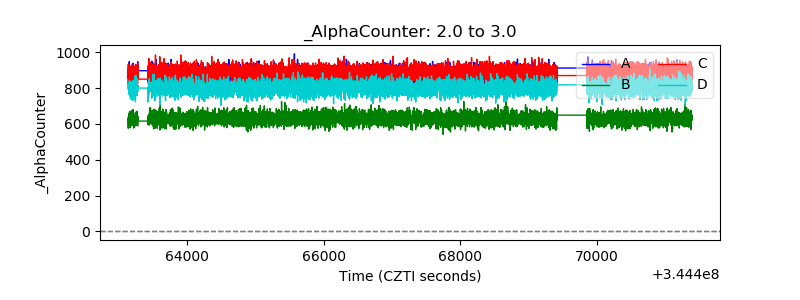 |
| _CPM_Rate | 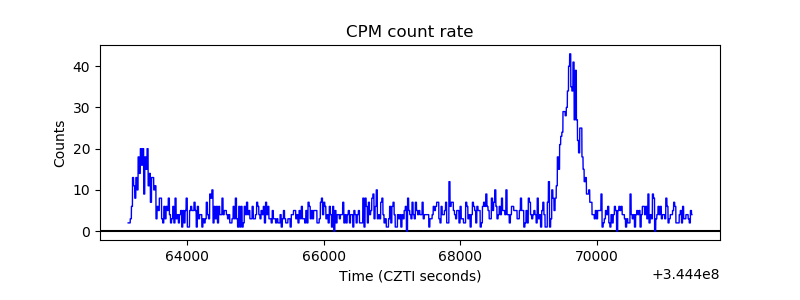 |
| CZT Counter | 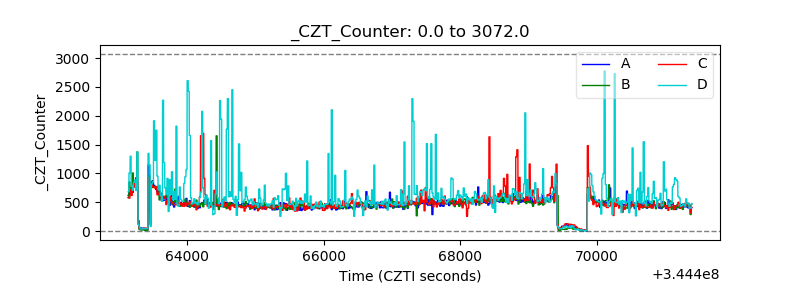 |
| +2.5 Volts monitor |  |
| +5 Volts monitor | 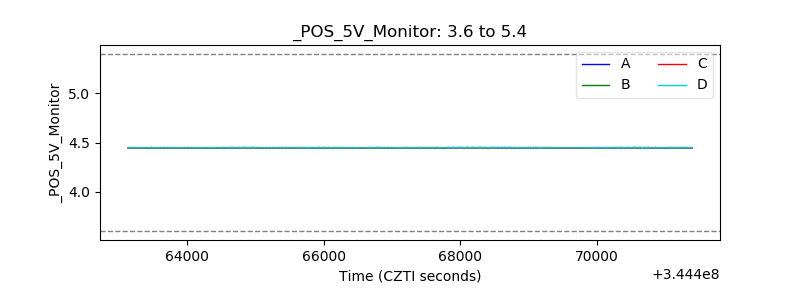 |
| _ROLL_ROT | 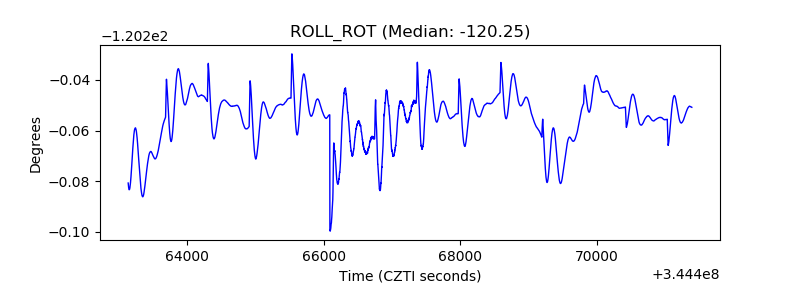 |
| _Roll_DEC | 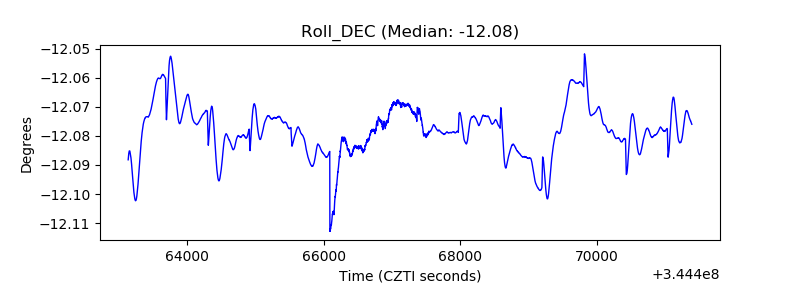 |
| _Roll_RA | 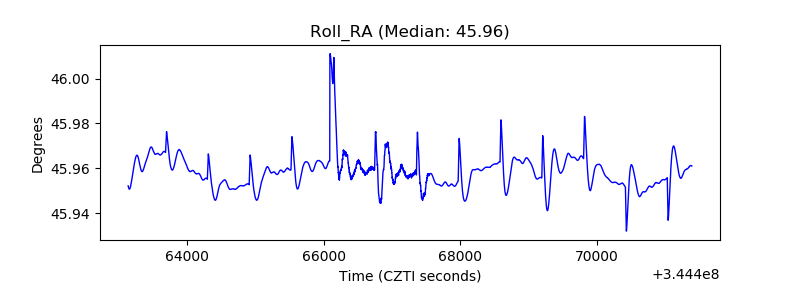 |
| Veto Counter | 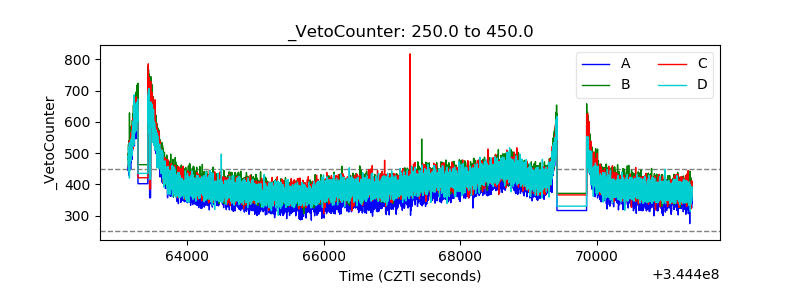 |