| Param | Original file | Final file |
|---|---|---|
| Filename | modeM0/AS1A10_065T03_9000004040_27988cztM0_level2.evt | modeM0/AS1A10_065T03_9000004040_27988cztM0_level2_quad_clean.evt |
| Size (bytes) | 940,524,480 | 169,436,160 |
| Size | 897.0 MB | 161.6 MB |
| Events in quadrant A | 6,131,740 | 1,109,332 |
| Events in quadrant B | 6,130,391 | 1,090,386 |
| Events in quadrant C | 6,281,810 | 1,022,402 |
| Events in quadrant D | 9,071,752 | 1,022,443 |
| Mode M9 | |||
|---|---|---|---|
| Quadrant | BADHDUFLAG | Total packets | Discarded packets |
| A | 0 | 16 | 0 |
| B | 0 | 16 | 0 |
| C | 0 | 16 | 0 |
| D | 0 | 16 | 0 |
| Mode M0 | |||
|---|---|---|---|
| Quadrant | BADHDUFLAG | Total packets | Discarded packets |
| A | 0 | 26331 | 0 |
| B | 0 | 26190 | 0 |
| C | 0 | 26553 | 0 |
| D | 0 | 35194 | 0 |
| Quadrant | Total seconds | Saturated seconds | Saturation percentage |
|---|---|---|---|
| A | 12823 | 55 | 0.428917% |
| B | 12822 | 70 | 0.545937% |
| C | 12822 | 162 | 1.263453% |
| D | 12822 | 497 | 3.876150% |
Noise dominated data is calculated using 1-second bins in cleaned event files. If a bin has >2000 counts, and if more than 50% of those come from <1% of pixels, then it is considered to be noise-dominated and hence unusable.
| Quadrant | # 1 sec bins | Bins with >0 counts | Bins with >2000 counts | High rate bins dominated by noise | Noise dominated (total time) | Noise dominated (detector-on time) | Marked lightcurve |
|---|---|---|---|---|---|---|---|
| A | 14593 | 12825 | 0 | 0 | 0.00% | 0.00% |  |
| B | 14592 | 12823 | 2 | 2 | 0.01% | 0.02% |  |
| C | 14592 | 12824 | 21 | 21 | 0.14% | 0.16% |  |
| D | 14592 | 12824 | 400 | 400 | 2.74% | 3.12% | 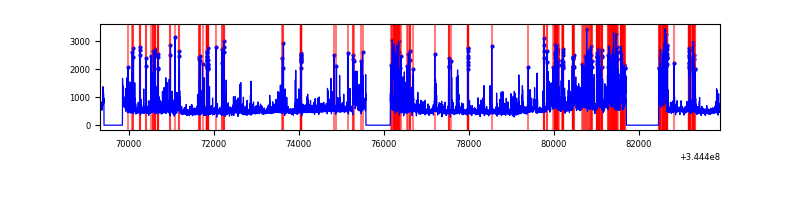 |
Top three noisy pixels from each quadrant. If the there are fewer than three noisy pixels in the level2.evt file, extra rows are filled as -1
| Pixel properties | Quadrant properties | ||||||
|---|---|---|---|---|---|---|---|
| Quadrant | DetID | PixID | Counts | Sigma | Mean | Median | Sigma |
| A | 12 | 16 | 32537 | 97.81 | 1576 | 1544 | 316.9 |
| A | 13 | 254 | 18532 | 53.61 | 1576 | 1544 | 316.9 |
| A | 8 | 192 | 16432 | 46.98 | 1576 | 1544 | 316.9 |
| B | 12 | 111 | 38866 | 124.97 | 1555 | 1511 | 298.9 |
| B | 11 | 111 | 35753 | 114.56 | 1555 | 1511 | 298.9 |
| B | 14 | 111 | 33717 | 107.74 | 1555 | 1511 | 298.9 |
| C | 14 | 238 | 242706 | 684.0 | 1500 | 1512 | 352.6 |
| C | 10 | 22 | 74874 | 208.05 | 1500 | 1512 | 352.6 |
| C | 15 | 208 | 69825 | 193.73 | 1500 | 1512 | 352.6 |
| D | 1 | 52 | 1588904 | 4450.21 | 1502 | 1466 | 356.7 |
| D | 7 | 80 | 1097419 | 3072.39 | 1502 | 1466 | 356.7 |
| D | 8 | 195 | 442969 | 1237.71 | 1502 | 1466 | 356.7 |
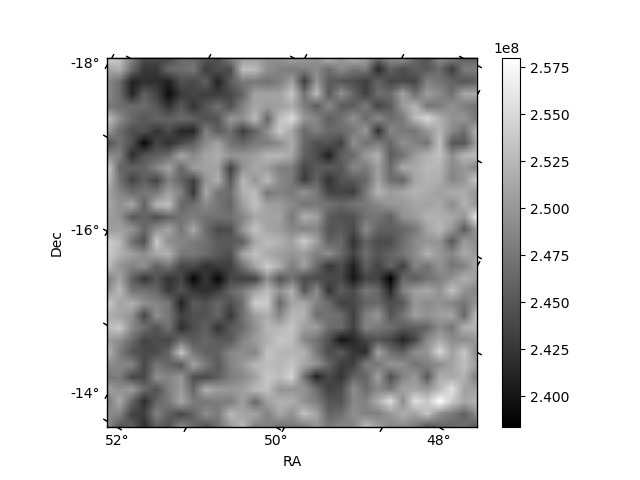
Histogram calculated using DETX and DETY for each event in the final _common_clean file
| Quadrant A | 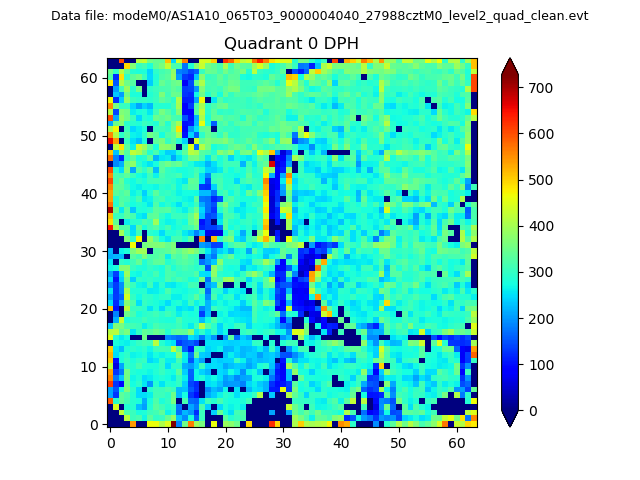 |
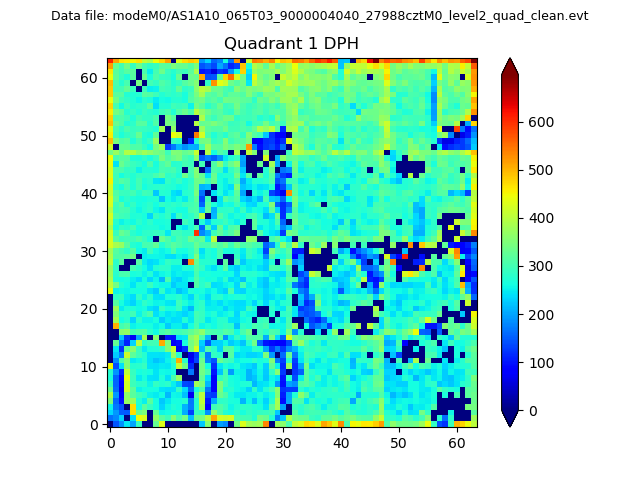 |
Quadrant B |
|---|---|---|---|
| Quadrant D | 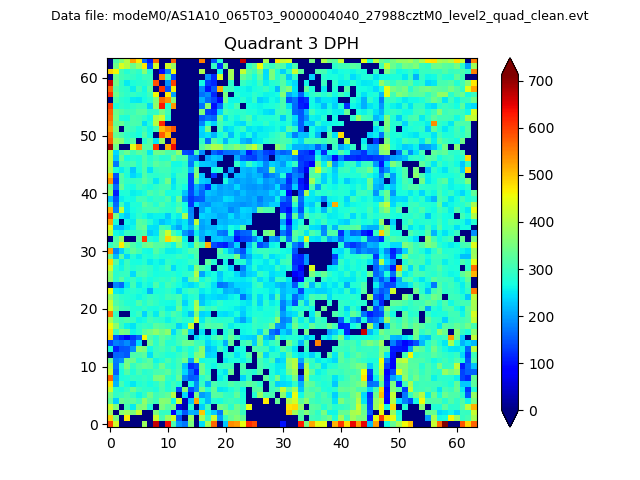 |
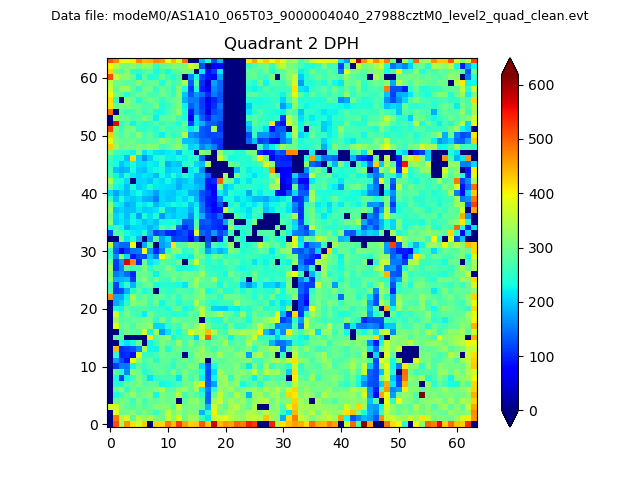 |
Quadrant C |
| Plot type | Count rate plots | Images |
|---|---|---|
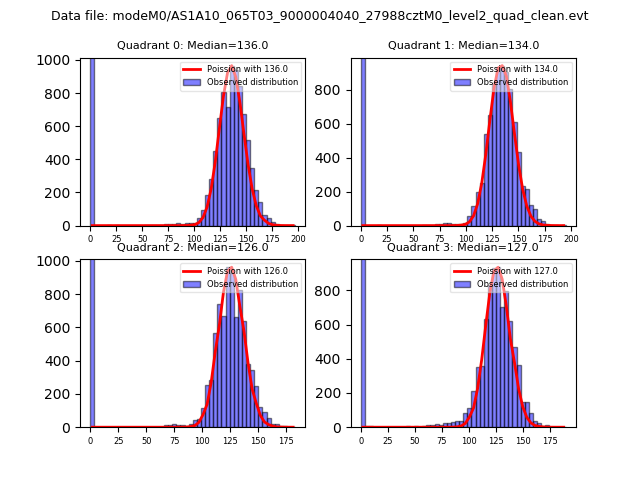
| Comparison with Poisson distribution Blue bars denote a histogram of data divided into 1 sec bins. Red curve is a Poisson curve with rate = median count rate of data. |
 |
 |
| Quadrant-wise count rates Data is divided into 100 sec bins |
 |
|
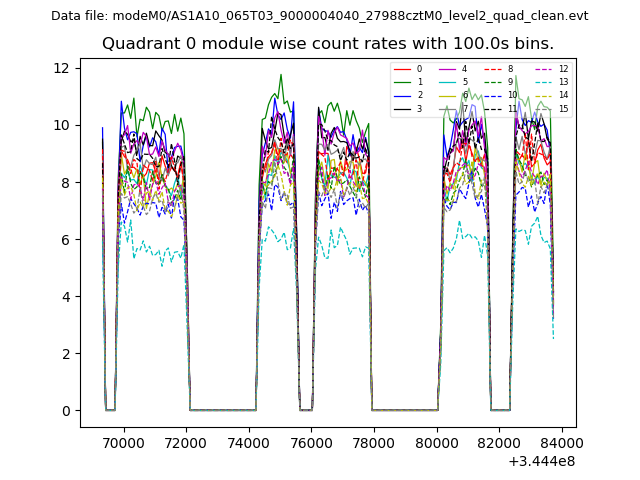
| Module-wise count rates for Quadrant A Data is divided into 100 sec bins |
 |
 |
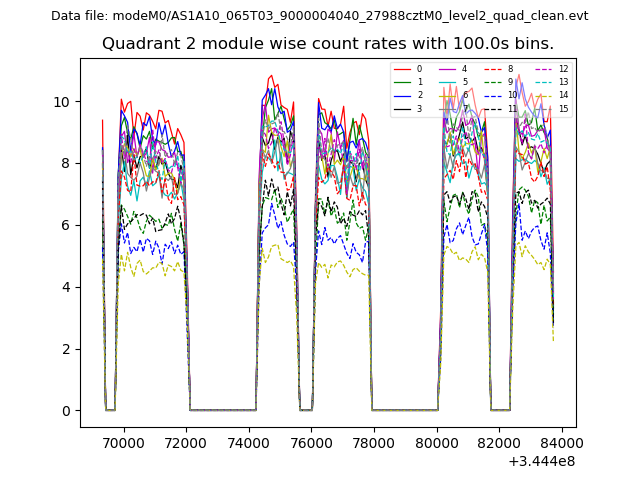
| Module-wise count rates for Quadrant B Data is divided into 100 sec bins |
 |
 |
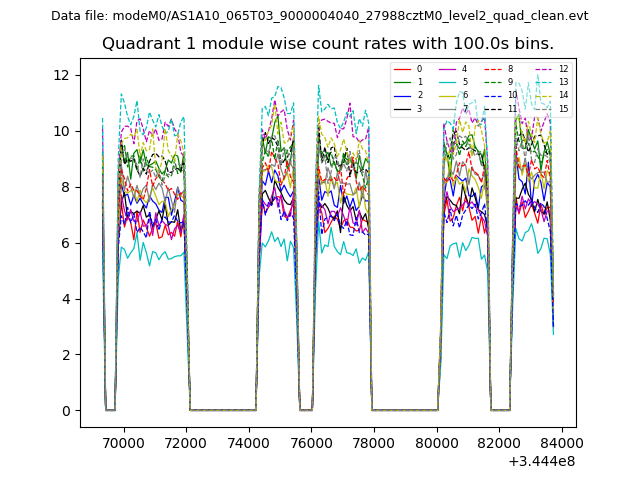
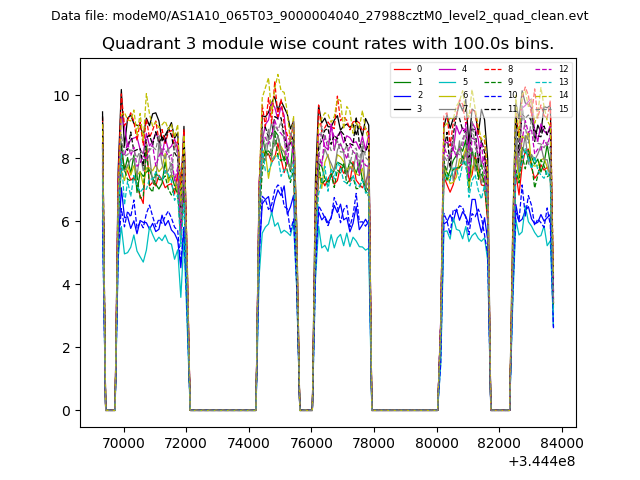
| Module-wise count rates for Quadrant C Data is divided into 100 sec bins |
 |
 |
| Module-wise count rates for Quadrant D Data is divided into 100 sec bins |
 |
 |
| Parameter | Plot |
|---|---|
| CZT HV Monitor | 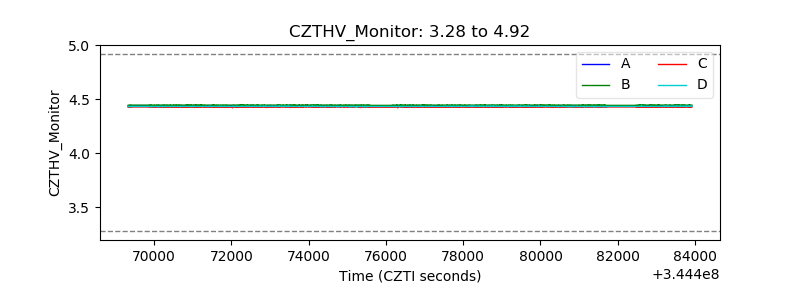 |
| D_VDD | 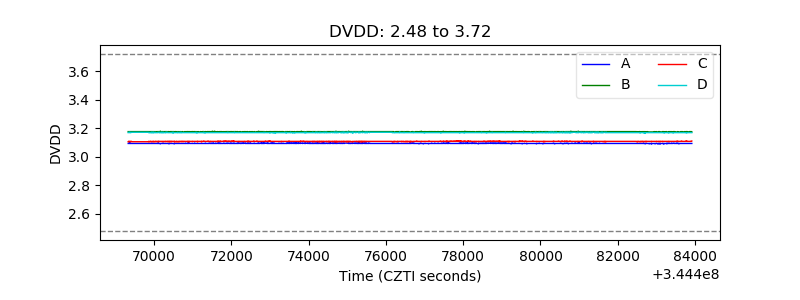 |
| Temperature 1 |  |
| Veto HV Monitor | 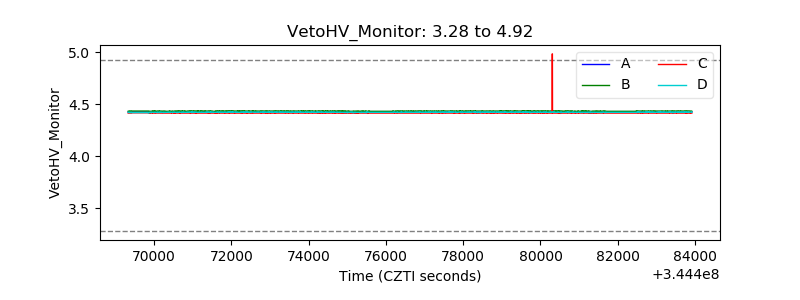 |
| Veto LLD | 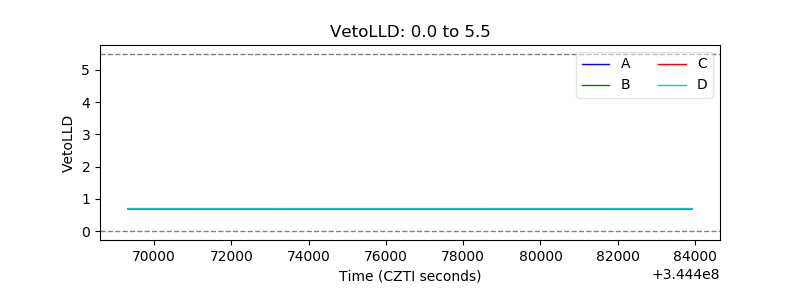 |
| Alpha Counter | 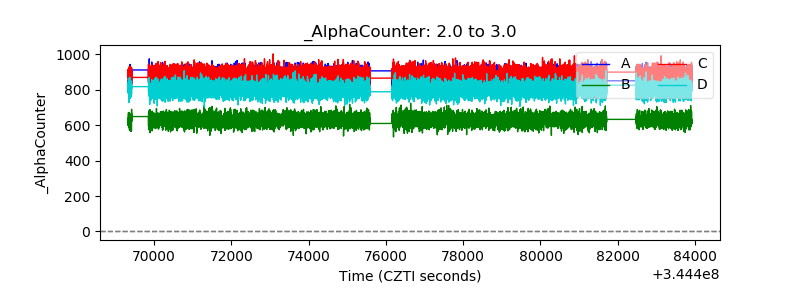 |
| _CPM_Rate | 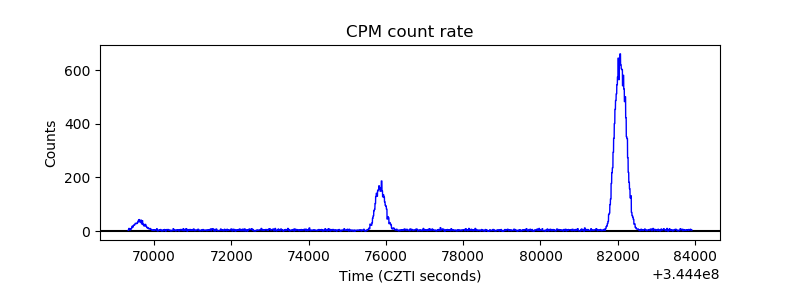 |
| CZT Counter | 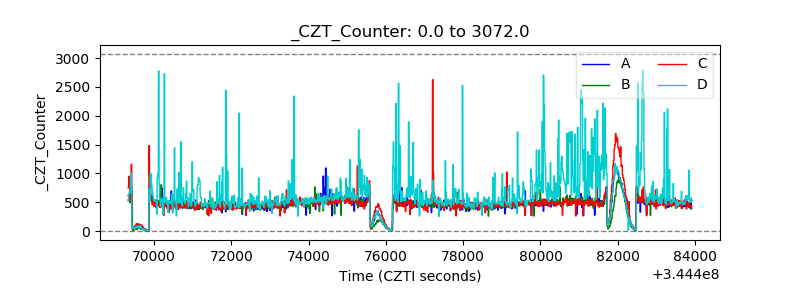 |
| +2.5 Volts monitor |  |
| +5 Volts monitor |  |
| _ROLL_ROT | 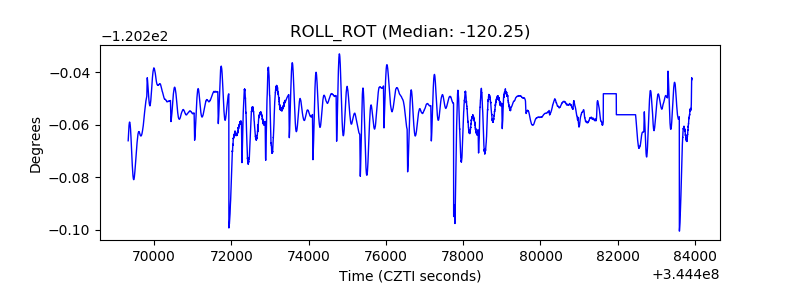 |
| _Roll_DEC |  |
| _Roll_RA | 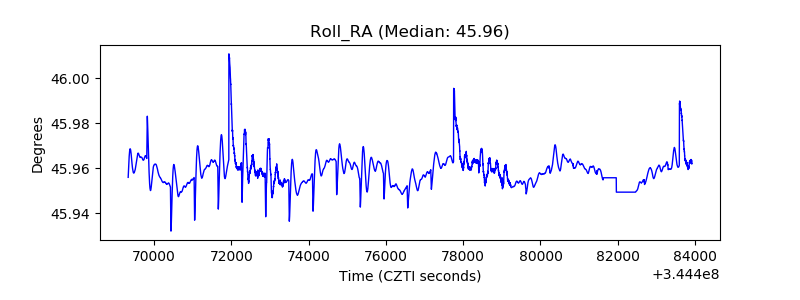 |
| Veto Counter | 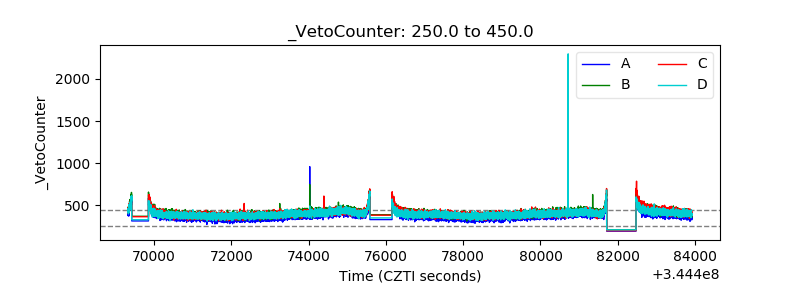 |