| Param | Original file | Final file |
|---|---|---|
| Filename | modeM0/AS1A10_065T03_9000004040_27990cztM0_level2.evt | modeM0/AS1A10_065T03_9000004040_27990cztM0_level2_quad_clean.evt |
| Size (bytes) | 483,416,640 | 79,191,360 |
| Size | 461.0 MB | 75.5 MB |
| Events in quadrant A | 3,292,153 | 497,319 |
| Events in quadrant B | 3,342,831 | 498,170 |
| Events in quadrant C | 3,565,965 | 470,831 |
| Events in quadrant D | 3,994,611 | 474,709 |
| Mode M9 | |||
|---|---|---|---|
| Quadrant | BADHDUFLAG | Total packets | Discarded packets |
| A | 0 | 17 | 0 |
| B | 0 | 18 | 0 |
| C | 0 | 18 | 0 |
| D | 0 | 18 | 0 |
| Mode M0 | |||
|---|---|---|---|
| Quadrant | BADHDUFLAG | Total packets | Discarded packets |
| A | 0 | 13751 | 0 |
| B | 0 | 13932 | 0 |
| C | 0 | 14692 | 0 |
| D | 0 | 15917 | 0 |
| Quadrant | Total seconds | Saturated seconds | Saturation percentage |
|---|---|---|---|
| A | 6542 | 36 | 0.550290% |
| B | 6542 | 56 | 0.856007% |
| C | 6542 | 114 | 1.742586% |
| D | 6542 | 83 | 1.268725% |
Noise dominated data is calculated using 1-second bins in cleaned event files. If a bin has >2000 counts, and if more than 50% of those come from <1% of pixels, then it is considered to be noise-dominated and hence unusable.
| Quadrant | # 1 sec bins | Bins with >0 counts | Bins with >2000 counts | High rate bins dominated by noise | Noise dominated (total time) | Noise dominated (detector-on time) | Marked lightcurve |
|---|---|---|---|---|---|---|---|
| A | 7627 | 6542 | 0 | 0 | 0.00% | 0.00% | 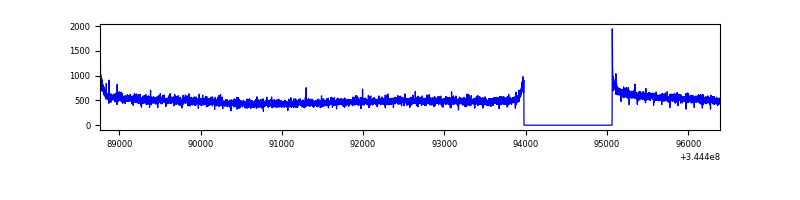 |
| B | 7627 | 6542 | 0 | 0 | 0.00% | 0.00% | 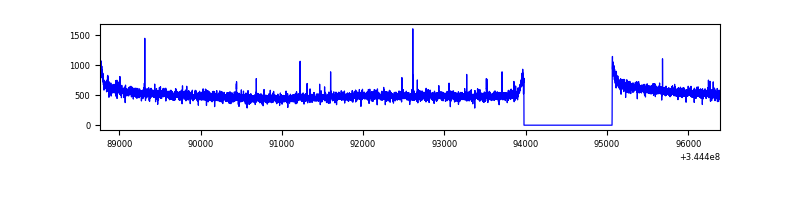 |
| C | 7627 | 6542 | 2 | 2 | 0.03% | 0.03% | 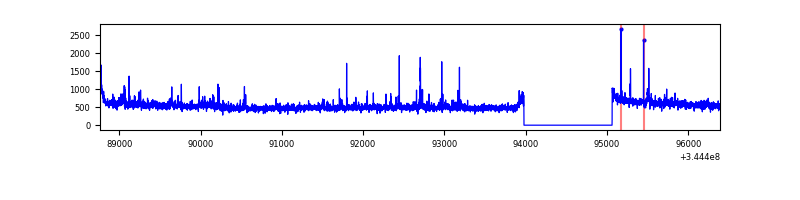 |
| D | 7627 | 6542 | 54 | 54 | 0.71% | 0.83% | 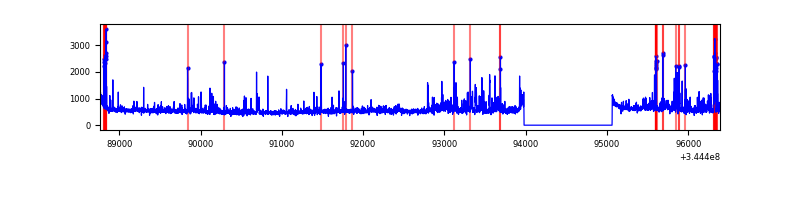 |
Top three noisy pixels from each quadrant. If the there are fewer than three noisy pixels in the level2.evt file, extra rows are filled as -1
| Pixel properties | Quadrant properties | ||||||
|---|---|---|---|---|---|---|---|
| Quadrant | DetID | PixID | Counts | Sigma | Mean | Median | Sigma |
| A | 8 | 192 | 9314 | 50.14 | 851 | 836 | 169.1 |
| A | 13 | 254 | 8741 | 46.75 | 851 | 836 | 169.1 |
| A | 3 | 137 | 7932 | 41.96 | 851 | 836 | 169.1 |
| B | 12 | 111 | 20134 | 119.12 | 848 | 829 | 162.1 |
| B | 11 | 111 | 18411 | 108.49 | 848 | 829 | 162.1 |
| B | 14 | 111 | 17685 | 104.01 | 848 | 829 | 162.1 |
| C | 3 | 233 | 158926 | 816.1 | 826 | 831 | 193.7 |
| C | 14 | 238 | 134082 | 687.85 | 826 | 831 | 193.7 |
| C | 10 | 22 | 43675 | 221.16 | 826 | 831 | 193.7 |
| D | 1 | 52 | 543040 | 2770.08 | 830 | 810 | 195.7 |
| D | 8 | 195 | 252601 | 1286.32 | 830 | 810 | 195.7 |
| D | 7 | 223 | 58550 | 294.97 | 830 | 810 | 195.7 |
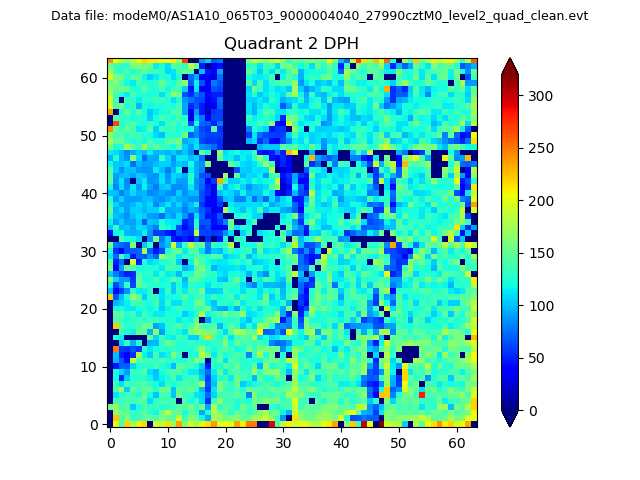
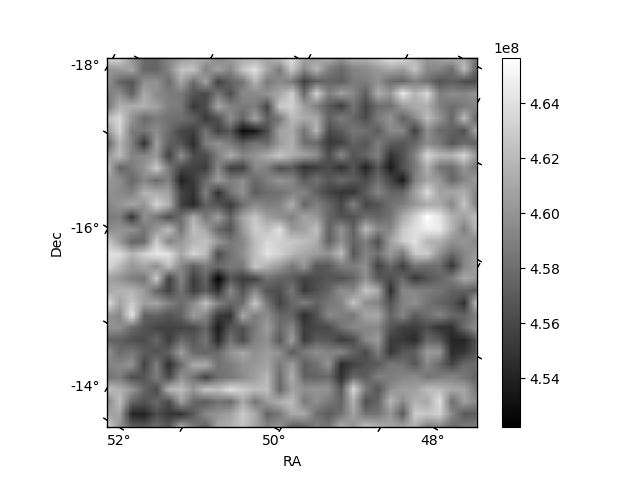
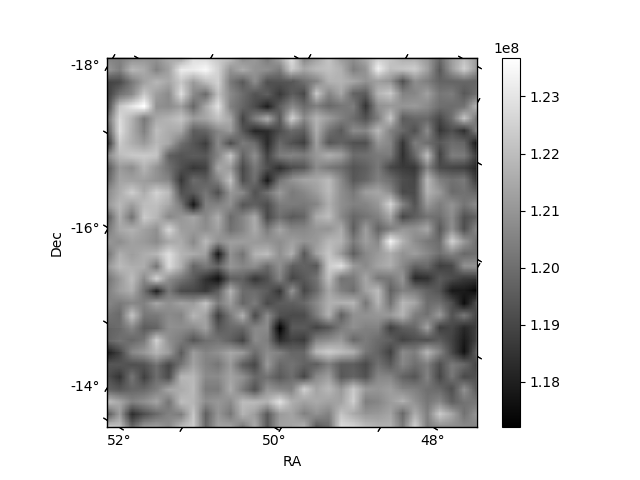
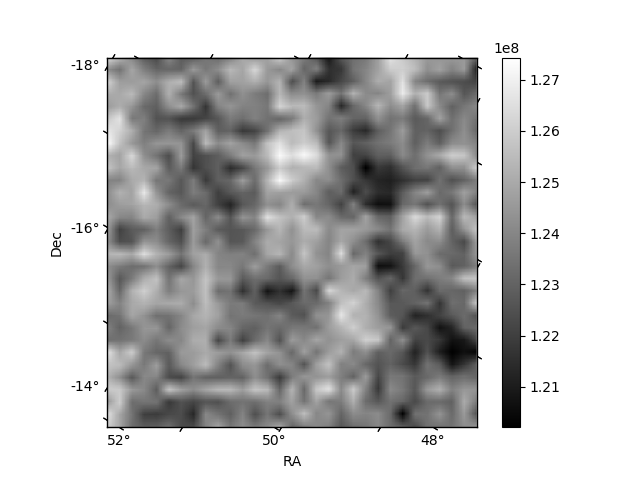
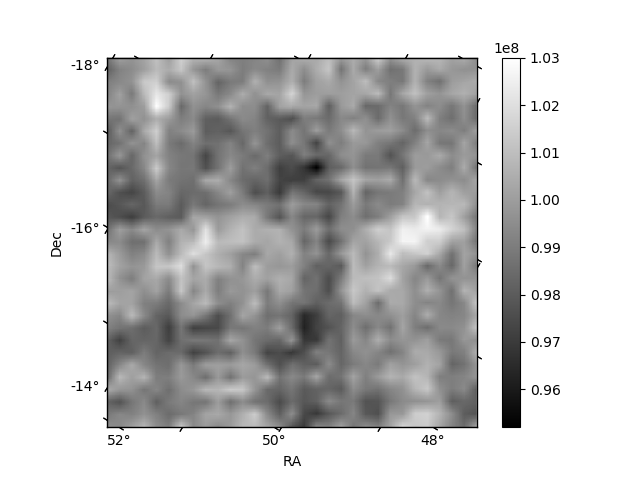
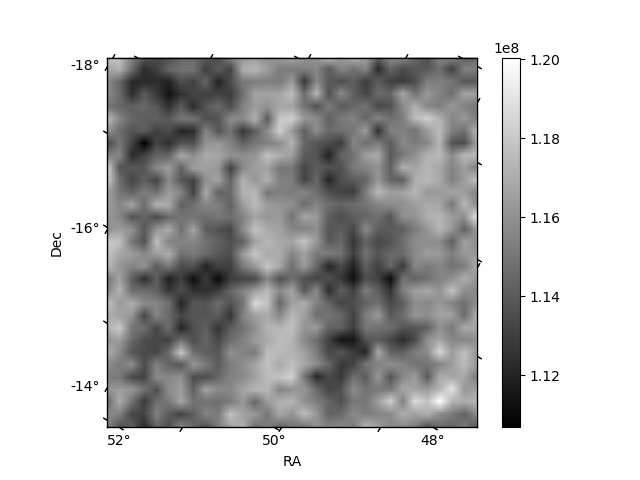
Histogram calculated using DETX and DETY for each event in the final _common_clean file
| Quadrant A | 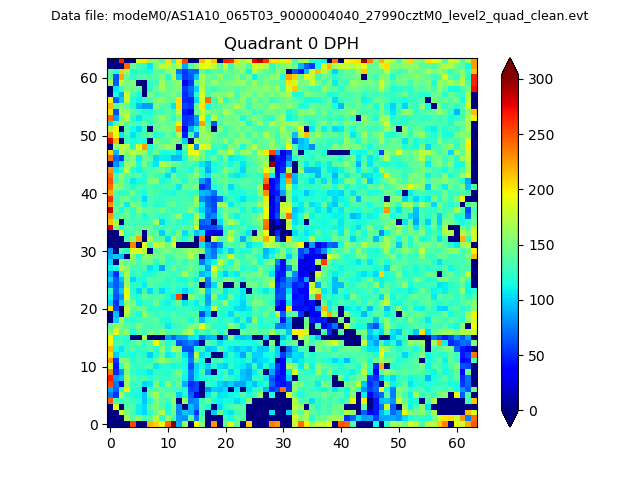 |
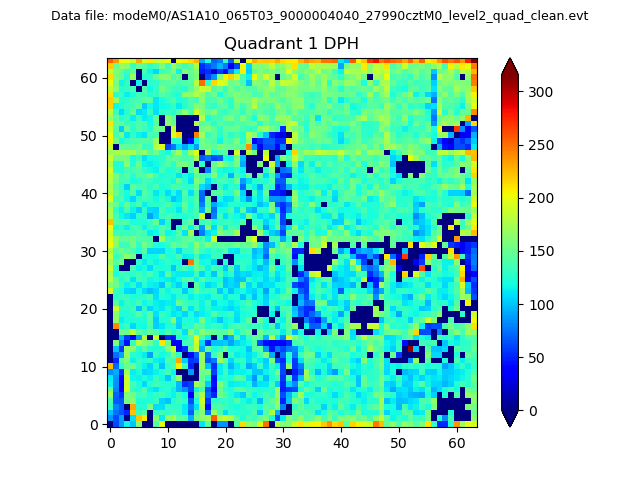 |
Quadrant B |
|---|---|---|---|
| Quadrant D | 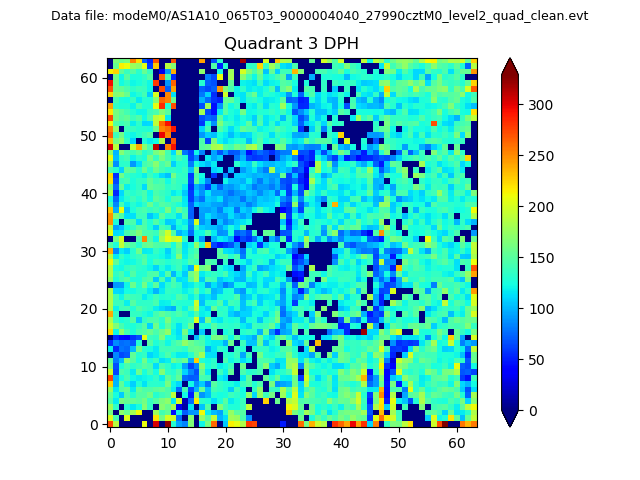 |
 |
Quadrant C |
| Plot type | Count rate plots | Images |
|---|---|---|
| Comparison with Poisson distribution Blue bars denote a histogram of data divided into 1 sec bins. Red curve is a Poisson curve with rate = median count rate of data. |
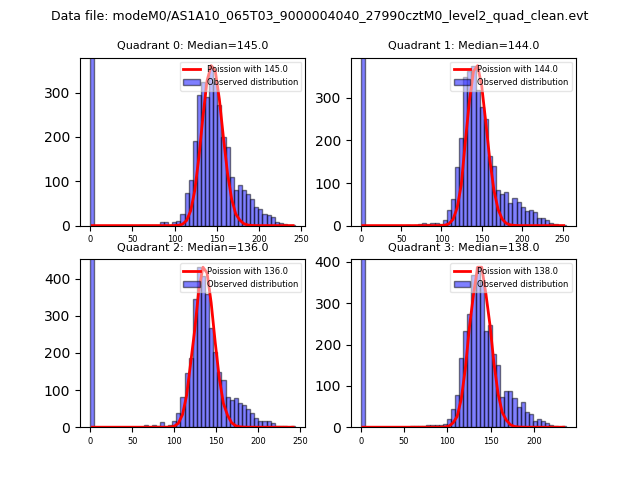 |
 |
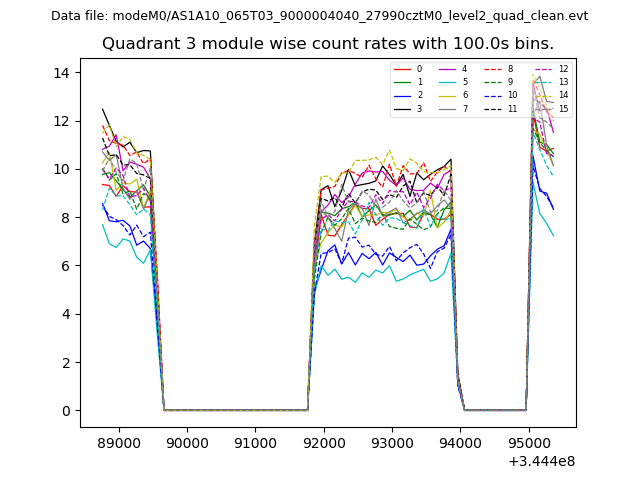
| Quadrant-wise count rates Data is divided into 100 sec bins |
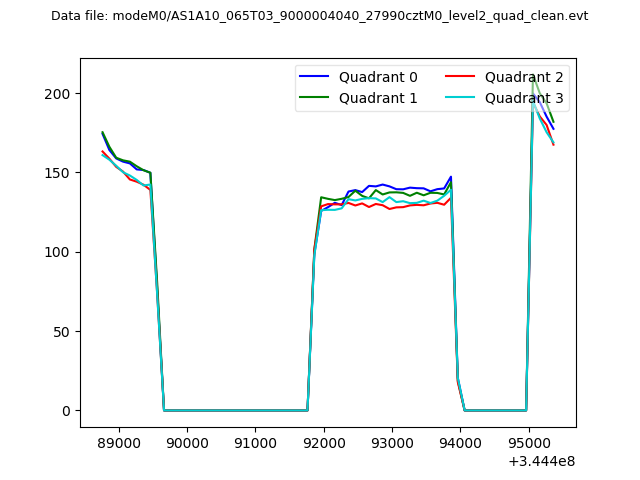 |
|
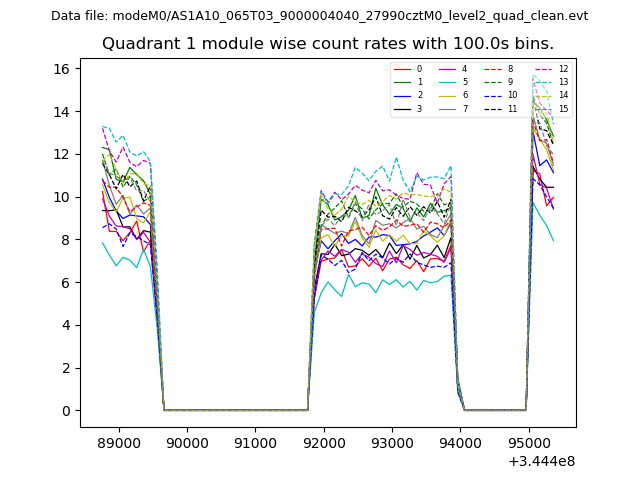
| Module-wise count rates for Quadrant A Data is divided into 100 sec bins |
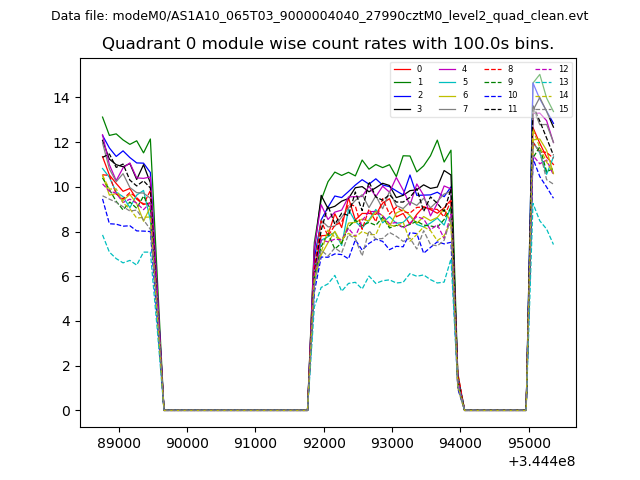 |
 |
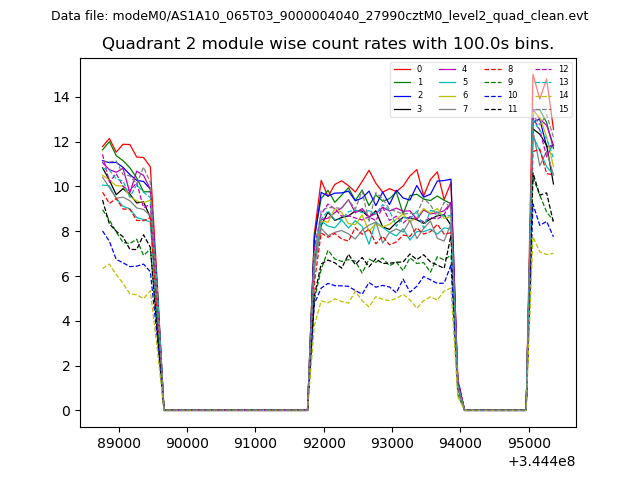
| Module-wise count rates for Quadrant B Data is divided into 100 sec bins |
 |
 |
| Module-wise count rates for Quadrant C Data is divided into 100 sec bins |
 |
 |
| Module-wise count rates for Quadrant D Data is divided into 100 sec bins |
 |
 |
| Parameter | Plot |
|---|---|
| CZT HV Monitor | 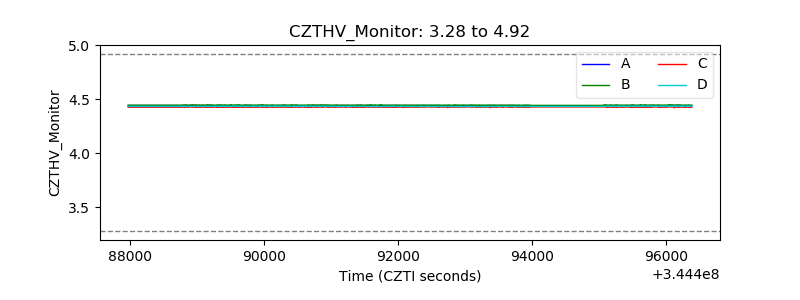 |
| D_VDD | 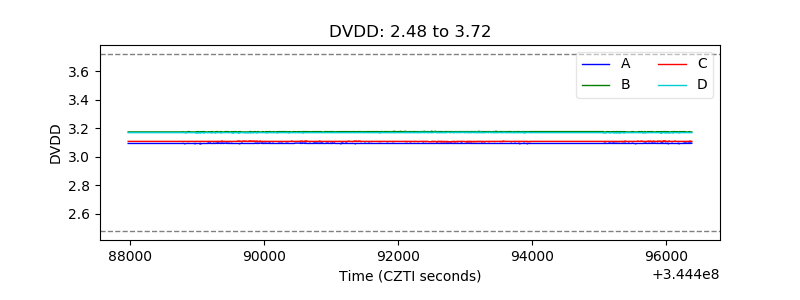 |
| Temperature 1 | 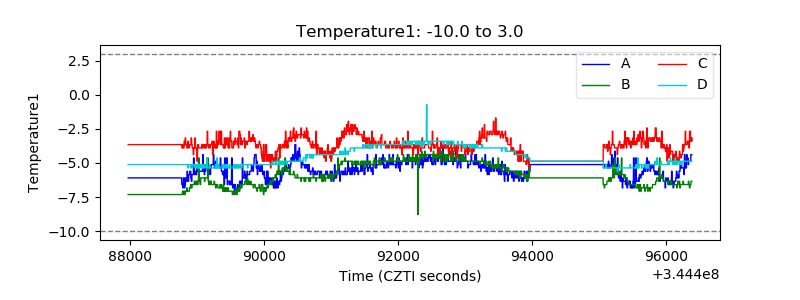 |
| Veto HV Monitor | 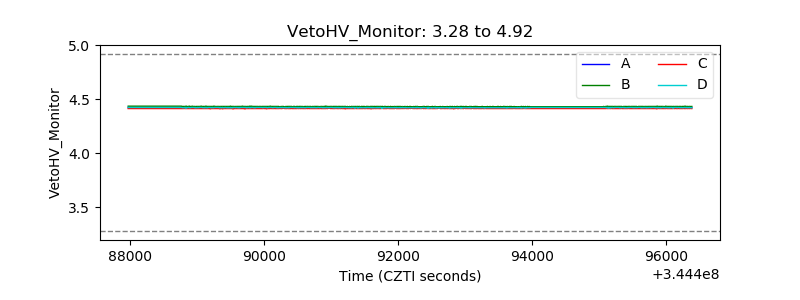 |
| Veto LLD | 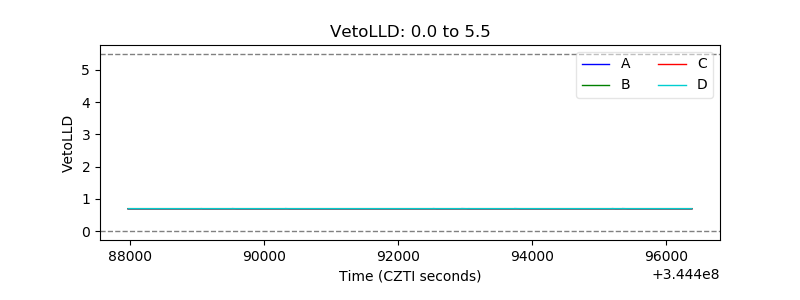 |
| Alpha Counter | 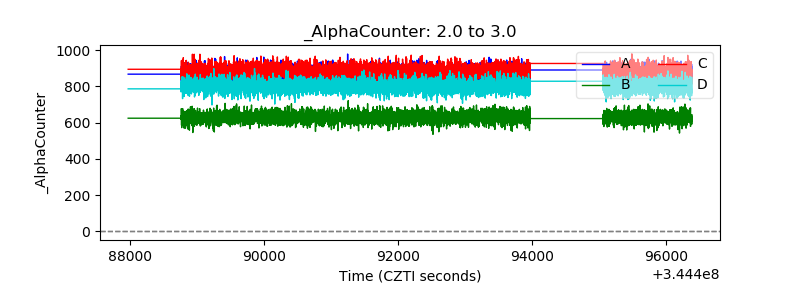 |
| _CPM_Rate | 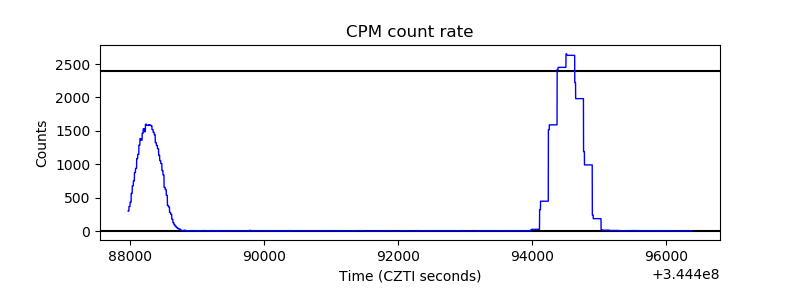 |
| CZT Counter | 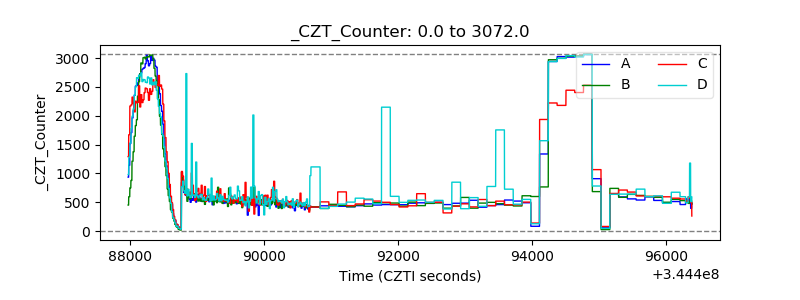 |
| +2.5 Volts monitor | 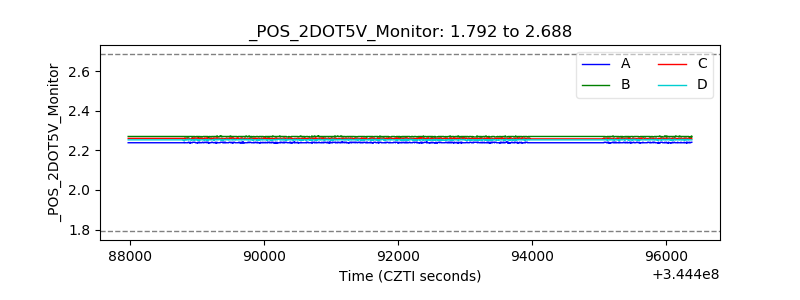 |
| +5 Volts monitor |  |
| _ROLL_ROT | 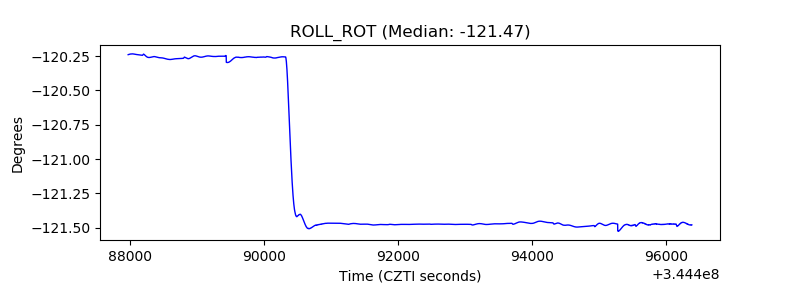 |
| _Roll_DEC | 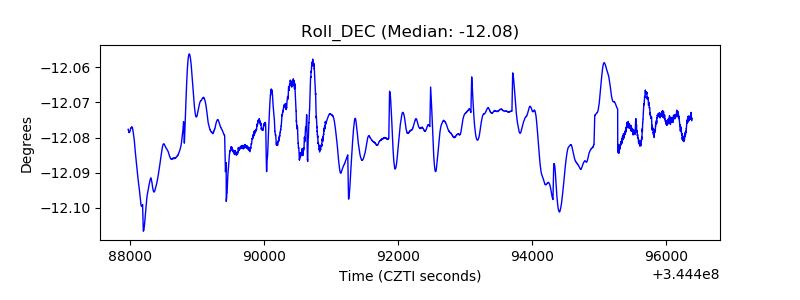 |
| _Roll_RA | 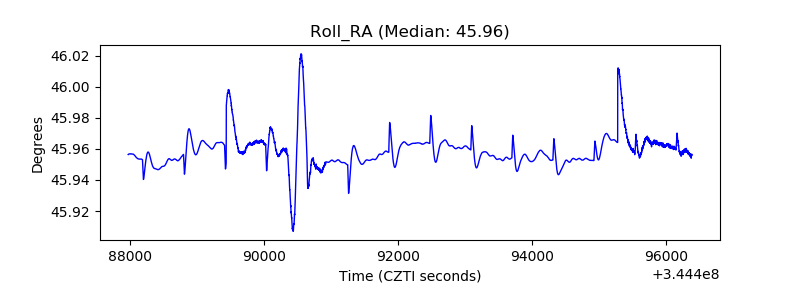 |
| Veto Counter | 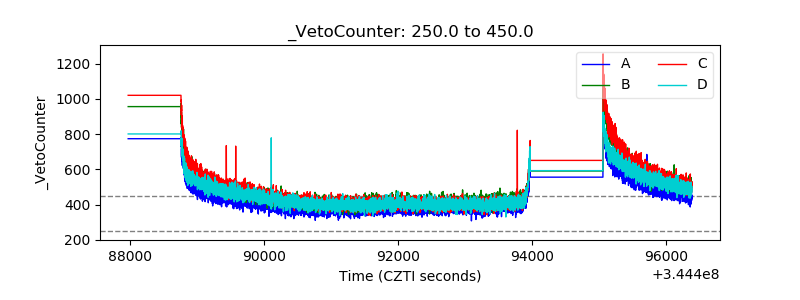 |